Explore
 Validate
 Learn
LearnMA5-14949
antibody from Invitrogen Antibodies
Targeting: CDKN1A
CAP20, CDKN1, CIP1, P21, p21CIP1, p21Cip1/Waf1, SDI1, WAF1
 Western blot
 Immunocytochemistry Immunoprecipitation
 Immunohistochemistry Flow cytometry Other assay
Antibody data
- Antibody Data
- Antigen structure
- References [19]
- Comments [0]
- Validations
- Immunocytochemistry [3]
- Flow cytometry [1]
- Other assay [26]
Submit
Validation data
Reference
Comment
Report error
- Product number
- MA5-14949 - Provider product page

- Provider
- Invitrogen Antibodies
- Product name
- p21 Monoclonal Antibody (R.229.6)
- Antibody type
- Monoclonal
- Antigen
- Synthetic peptide
- Description
- Antibodies to this protein (and modification) were previously sold as part of a Thermo Scientific Cellomics High Content Screening Kit. This replacement antibody is now recommended for researchers who need an antibody for high content cell based assays. It has been thoroughly tested and validated for cellular immunofluorescence (IF) applications. Further optimization including the selection of the most appropriate fluorescent Dylight conjugated secondary antibody may have to be performed for your high content assay. It is not recommended to aliquot this antibody. This antibody is not cross-reactive with other CDK inhibitors.
- Reactivity
- Human
- Host
- Rabbit
- Isotype
- IgG
- Antibody clone number
- R.229.6
- Vial size
- 100 µL
- Concentration
- 244 µg/mL
- Storage
- -20°C
Submitted references Cyanidin 3-O-arabinoside suppresses DHT-induced dermal papilla cell senescence by modulating p38-dependent ER-mitochondria contacts.
Palbociclib-mediated cell cycle arrest can occur in the absence of the CDK inhibitors p21 and p27.
The lack of functional DNMT2/TRDMT1 gene modulates cancer cell responses during drug-induced senescence.
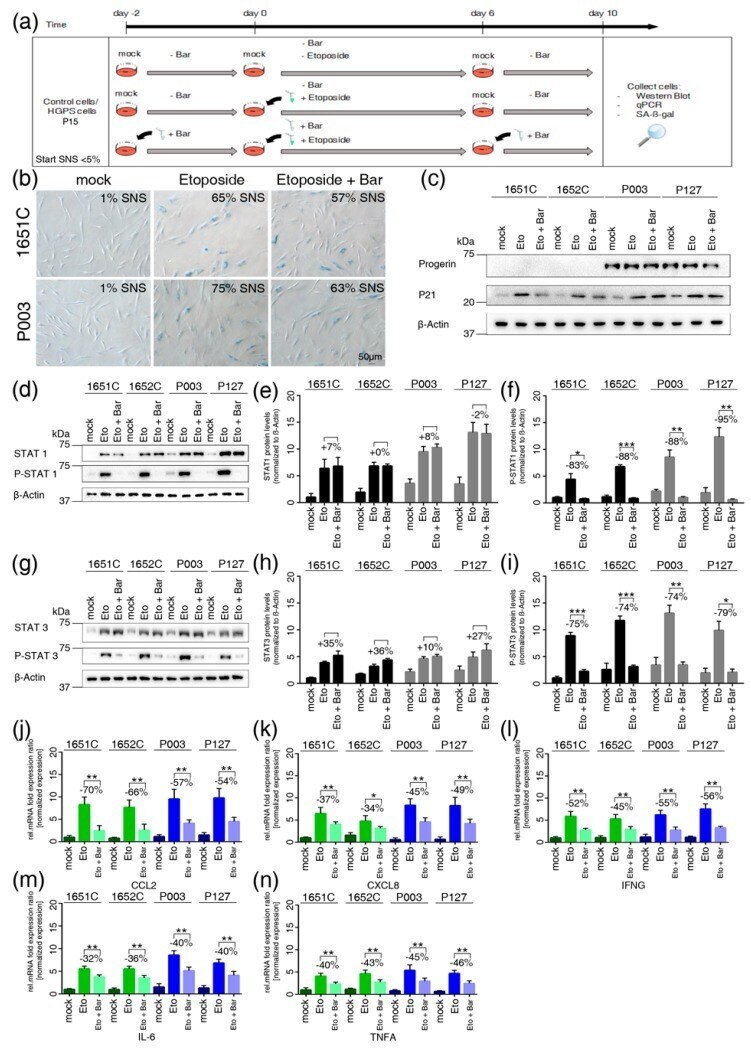
Baricitinib, a JAK-STAT Inhibitor, Reduces the Cellular Toxicity of the Farnesyltransferase Inhibitor Lonafarnib in Progeria Cells.
Interleukin-6 neutralization ameliorates symptoms in prematurely aged mice.
Decreased p53 is associated with a decline in asymmetric stem cell self-renewal in aged human epidermis.
Insights into epithelial cell senescence from transcriptome and secretome analysis of human oral keratinocytes.
Emerin Phosphorylation during the Early Phase of the Oxidative Stress Response Influences Emerin-BAF Interaction and BAF Nuclear Localization.
Sodium butyrate inhibits high cholesterol-induced neuronal amyloidogenesis by modulating NRF2 stabilization-mediated ROS levels: involvement of NOX2 and SOD1.
AMPK-mediated senolytic and senostatic activity of quercetin surface functionalized Fe(3)O(4) nanoparticles during oxidant-induced senescence in human fibroblasts.
Modulated Electro-Hyperthermia-Induced Tumor Damage Mechanisms Revealed in Cancer Models.
Inhibition of JAK-STAT Signaling with Baricitinib Reduces Inflammation and Improves Cellular Homeostasis in Progeria Cells.
Altered modulation of lamin A/C-HDAC2 interaction and p21 expression during oxidative stress response in HGPS.
Reduced levels of methyltransferase DNMT2 sensitize human fibroblasts to oxidative stress and DNA damage that is accompanied by changes in proliferation-related miRNA expression.
Detection of mesenchymal stem cells senescence by prelamin A accumulation at the nuclear level.
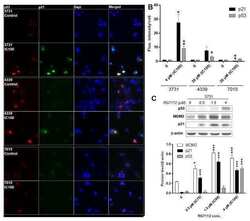
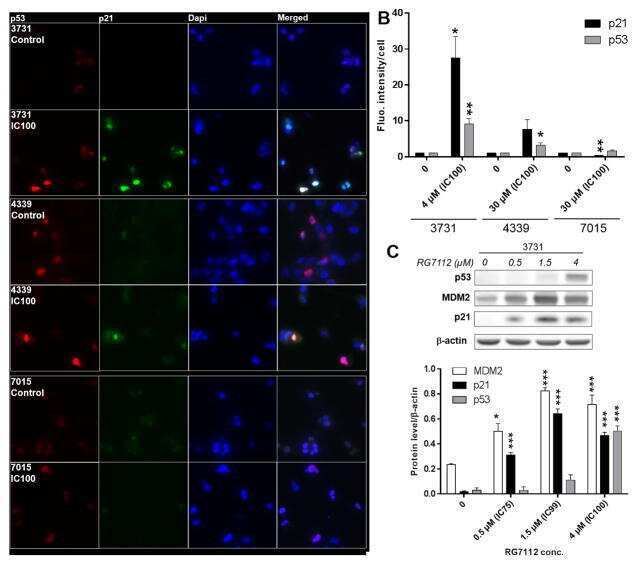
Preclinical Efficacy of the MDM2 Inhibitor RG7112 in MDM2-Amplified and TP53 Wild-type Glioblastomas.
Disentangling the aneuploidy and senescence paradoxes: a study of triploid breast cancers non-responsive to neoadjuvant therapy.
Role of stress-activated OCT4A in the cell fate decisions of embryonal carcinoma cells treated with etoposide.
Sp1 acetylation is associated with loss of DNA binding at promoters associated with cell cycle arrest and cell death in a colon cell line.
Jung YH, Chae CW, Choi GE, Shin HC, Lim JR, Chang HS, Park J, Cho JH, Park MR, Lee HJ, Han HJ
Journal of biomedical science 2022 Mar 7;29(1):17
Journal of biomedical science 2022 Mar 7;29(1):17
Palbociclib-mediated cell cycle arrest can occur in the absence of the CDK inhibitors p21 and p27.
Pennycook BR, Barr AR
Open biology 2021 Nov;11(11):210125
Open biology 2021 Nov;11(11):210125
The lack of functional DNMT2/TRDMT1 gene modulates cancer cell responses during drug-induced senescence.
Bloniarz D, Adamczyk-Grochala J, Lewinska A, Wnuk M
Aging 2021 Jun 17;13(12):15833-15874
Aging 2021 Jun 17;13(12):15833-15874
Baricitinib, a JAK-STAT Inhibitor, Reduces the Cellular Toxicity of the Farnesyltransferase Inhibitor Lonafarnib in Progeria Cells.
Arnold R, Vehns E, Randl H, Djabali K
International journal of molecular sciences 2021 Jul 12;22(14)
International journal of molecular sciences 2021 Jul 12;22(14)
Interleukin-6 neutralization ameliorates symptoms in prematurely aged mice.
Squarzoni S, Schena E, Sabatelli P, Mattioli E, Capanni C, Cenni V, D'Apice MR, Andrenacci D, Sarli G, Pellegrino V, Festa A, Baruffaldi F, Storci G, Bonafè M, Barboni C, Sanapo M, Zaghini A, Lattanzi G
Aging cell 2021 Jan;20(1):e13285
Aging cell 2021 Jan;20(1):e13285
Decreased p53 is associated with a decline in asymmetric stem cell self-renewal in aged human epidermis.
Charruyer A, Weisenberger T, Li H, Khalifa A, Schroeder AW, Belzer A, Ghadially R
Aging cell 2021 Feb;20(2):e13310
Aging cell 2021 Feb;20(2):e13310
Insights into epithelial cell senescence from transcriptome and secretome analysis of human oral keratinocytes.
Schwartz RE, Shokhirev MN, Andrade LR, Gutkind JS, Iglesias-Bartolome R, Shadel GS
Aging 2021 Feb 12;13(4):4747-4777
Aging 2021 Feb 12;13(4):4747-4777
Emerin Phosphorylation during the Early Phase of the Oxidative Stress Response Influences Emerin-BAF Interaction and BAF Nuclear Localization.
Cenni V, Squarzoni S, Loi M, Mattioli E, Lattanzi G, Capanni C
Cells 2020 Jun 6;9(6)
Cells 2020 Jun 6;9(6)
Sodium butyrate inhibits high cholesterol-induced neuronal amyloidogenesis by modulating NRF2 stabilization-mediated ROS levels: involvement of NOX2 and SOD1.
Kim SY, Chae CW, Lee HJ, Jung YH, Choi GE, Kim JS, Lim JR, Lee JE, Cho JH, Park H, Park C, Han HJ
Cell death & disease 2020 Jun 18;11(6):469
Cell death & disease 2020 Jun 18;11(6):469
AMPK-mediated senolytic and senostatic activity of quercetin surface functionalized Fe(3)O(4) nanoparticles during oxidant-induced senescence in human fibroblasts.
Lewinska A, Adamczyk-Grochala J, Bloniarz D, Olszowka J, Kulpa-Greszta M, Litwinienko G, Tomaszewska A, Wnuk M, Pazik R
Redox biology 2020 Jan;28:101337
Redox biology 2020 Jan;28:101337
Modulated Electro-Hyperthermia-Induced Tumor Damage Mechanisms Revealed in Cancer Models.
Krenacs T, Meggyeshazi N, Forika G, Kiss E, Hamar P, Szekely T, Vancsik T
International journal of molecular sciences 2020 Aug 29;21(17)
International journal of molecular sciences 2020 Aug 29;21(17)
Inhibition of JAK-STAT Signaling with Baricitinib Reduces Inflammation and Improves Cellular Homeostasis in Progeria Cells.
Liu C, Arnold R, Henriques G, Djabali K
Cells 2019 Oct 18;8(10)
Cells 2019 Oct 18;8(10)
Altered modulation of lamin A/C-HDAC2 interaction and p21 expression during oxidative stress response in HGPS.
Mattioli E, Andrenacci D, Garofalo C, Prencipe S, Scotlandi K, Remondini D, Gentilini D, Di Blasio AM, Valente S, Scarano E, Cicchilitti L, Piaggio G, Mai A, Lattanzi G
Aging cell 2018 Oct;17(5):e12824
Aging cell 2018 Oct;17(5):e12824
Reduced levels of methyltransferase DNMT2 sensitize human fibroblasts to oxidative stress and DNA damage that is accompanied by changes in proliferation-related miRNA expression.
Lewinska A, Adamczyk-Grochala J, Kwasniewicz E, Deregowska A, Semik E, Zabek T, Wnuk M
Redox biology 2018 Apr;14:20-34
Redox biology 2018 Apr;14:20-34
Detection of mesenchymal stem cells senescence by prelamin A accumulation at the nuclear level.
Bellotti C, Capanni C, Lattanzi G, Donati D, Lucarelli E, Duchi S
SpringerPlus 2016;5(1):1427
SpringerPlus 2016;5(1):1427
Preclinical Efficacy of the MDM2 Inhibitor RG7112 in MDM2-Amplified and TP53 Wild-type Glioblastomas.
Verreault M, Schmitt C, Goldwirt L, Pelton K, Haidar S, Levasseur C, Guehennec J, Knoff D, Labussière M, Marie Y, Ligon AH, Mokhtari K, Hoang-Xuan K, Sanson M, Alexander BM, Wen PY, Delattre JY, Ligon KL, Idbaih A
Clinical cancer research : an official journal of the American Association for Cancer Research 2016 Mar 1;22(5):1185-96
Clinical cancer research : an official journal of the American Association for Cancer Research 2016 Mar 1;22(5):1185-96
Disentangling the aneuploidy and senescence paradoxes: a study of triploid breast cancers non-responsive to neoadjuvant therapy.
Gerashchenko BI, Salmina K, Eglitis J, Huna A, Grjunberga V, Erenpreisa J
Histochemistry and cell biology 2016 Apr;145(4):497-508
Histochemistry and cell biology 2016 Apr;145(4):497-508
Role of stress-activated OCT4A in the cell fate decisions of embryonal carcinoma cells treated with etoposide.
Huna A, Salmina K, Erenpreisa J, Vazquez-Martin A, Krigerts J, Inashkina I, Gerashchenko BI, Townsend PA, Cragg MS, Jackson TR
Cell cycle (Georgetown, Tex.) 2015;14(18):2969-84
Cell cycle (Georgetown, Tex.) 2015;14(18):2969-84
Sp1 acetylation is associated with loss of DNA binding at promoters associated with cell cycle arrest and cell death in a colon cell line.
Waby JS, Chirakkal H, Yu C, Griffiths GJ, Benson RS, Bingle CD, Corfe BM
Molecular cancer 2010 Oct 15;9:275
Molecular cancer 2010 Oct 15;9:275
No comments: Submit comment
Supportive validation
- Submitted by
- Invitrogen Antibodies (provider)
- Main image
- Experimental details
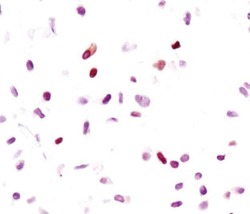
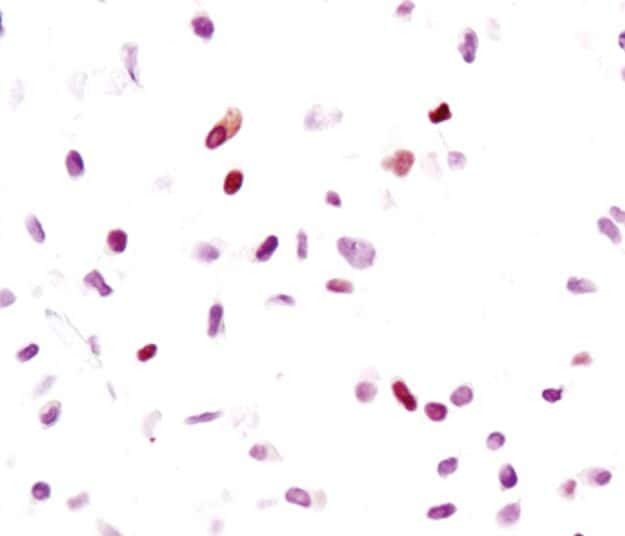
- Immunocytochemistry was performed on paraffin-embedded HeLa cells. To expose target proteins, heat induced antigen retrieval was performed using 10mM sodium citrate (pH 6.0) buffer for 10 minutes at 95C. Following antigen-retrieval, tissues were incubated in 3% hydrogen peroxide for 10 minutes, washed, and then blocked in 5% normal goat serum in TBST for 1 hour at room temperature. Tissues were stained with a p21 Waf1/Cip1 monoclonal antibody (Product # MA5-14949) at a dilution of 1:50 overnight at 4C. Tissues were washed extensively with TBS + 0.1% Tween-20 and detection was performed using a HRP-conjugated secondary reagent followed by DAB substrate.
- Submitted by
- Invitrogen Antibodies (provider)
- Main image
- Experimental details
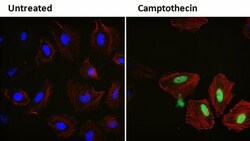
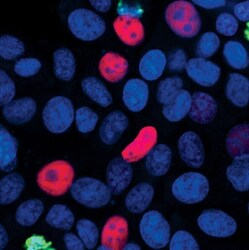
- Immunofluorescent analysis of p21 Waf1/Cip1 (green) in HeLa cells either left untreated (left panel) or treated with 5uM Camptothecin for 3 hours (right panel). Formalin fixed cells were permeabilized with 0.1% Triton X-100 in TBS for 10 minutes at room temperature and blocked with 1% Blocker BSA (Product # 37525) for 15 minutes at room temperature. Cells were probed with a p21 Waf1/Cip1 monoclonal antibody (Product # MA5-14949) at a dilution of 1:100 for at least 1 hour at room temperature, washed with PBS, and incubated with DyLight 488 goat anti-rabbit IgG secondary antibody (Product # 35552) at a dilution of 1:400 for 30 minutes at room temperature. F-Actin (red) was stained with DyLight 554 Phalloidin (Product # 21834) and nuclei (blue) were stained with Hoechst 33342 dye (Product # 62249). Images were taken on a Thermo Scientific ArrayScan or ToxInsight Instrument at 20X magnification.

- Submitted by
- Invitrogen Antibodies (provider)
- Main image
- Experimental details
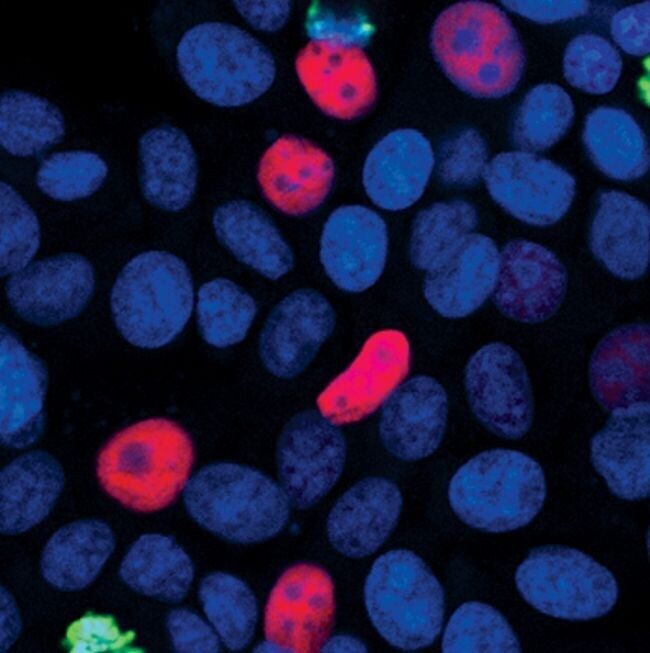
- Immunofluorescent analysis of p21 Waf1/Cip1 (red) in MCF7 cells. Formaldehyde fixed cells were blocked with 5% normal goat serum + 0.3% Triton X-100 in PBS for 1 hour at room temperature. Cells were probed with a p21 Waf1/Cip1 monoclonal antibody (Product # MA5-14949) at a dilution of 1:400 overnight at 4C, followed by a fluorescently-conjugated anti-rabbit IgG secondary antibody. Nuceli were counterstained (blue) and cells were visualized by confocal microscopy.
Supportive validation
- Submitted by
- Invitrogen Antibodies (provider)
- Main image
- Experimental details
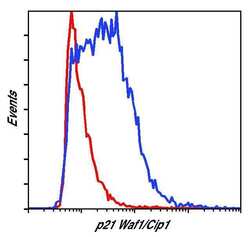
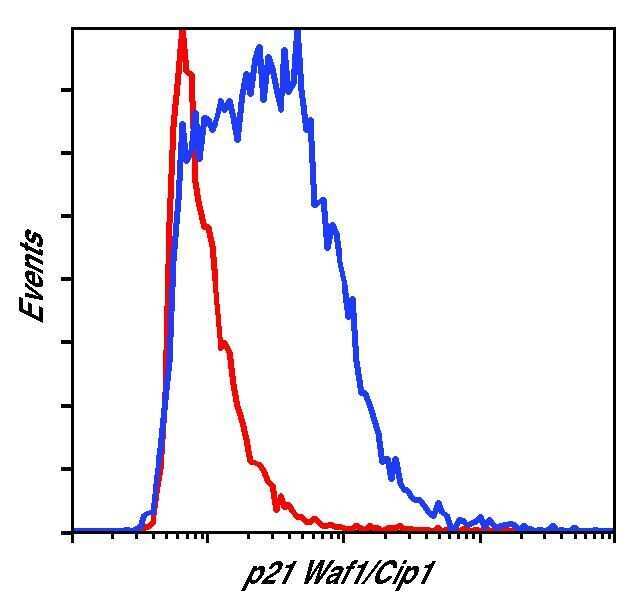
- Flow cytometric analysis of p21 Waf1/Cip1 on HeLa (red histogram) and MCF7 cells (blue histogram). Cells were harvested, fixed with formaldehyde, permeabilized with methanol, and incubated with a p21 Waf1/Cip1 monoclonal antibody (Product # MA5-14949) at a dilution of 1:200 for 1 hour at room temperature. Cells were stained with a fluorescently-conjugated anti-rabbit IgG secondary antibody and analyzed on a flow cytometer.
Supportive validation
- Submitted by
- Invitrogen Antibodies (provider)
- Main image
- Experimental details
- NULL
- Submitted by
- Invitrogen Antibodies (provider)
- Main image
- Experimental details
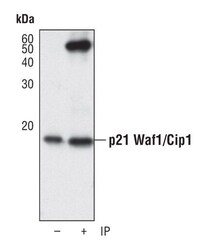
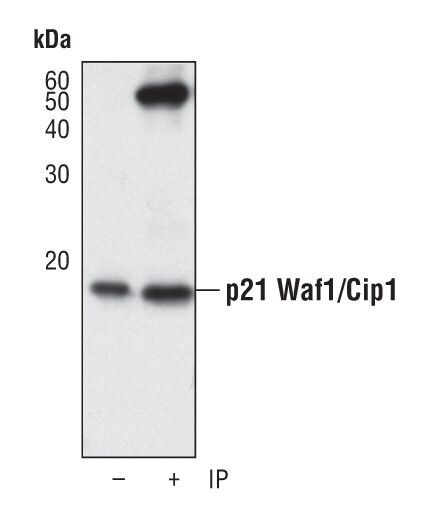
- Immunoprecipitation of p21 Waf1/Cip1 was performed on HUVEC cells. Antigen-antibody complexes were captured by incubating 200 µL of whole cell lysate with 20 µL of an immobilized p21 Waf1/Cip1 monoclonal antibody (Product # MA5-14949) overnight on a rocking platform at 4C. The immune complexes were washed extensively and eluted with SDS sample buffer. Samples were resolved on a SDS-PAGE gel, transferred to a membrane, and blocked with 5% nonfat dry milk in TBST for 1 hour at room temperature. The membrane was probed with a p21 Waf1/Cip1 monoclonal antibody (Product # MA5-14949) at a dilution of 1:1000, followed by an anti-rabbit IgG-HRP secondary antibody. Detection was performed using a chemiluminescent substrate.
- Submitted by
- Invitrogen Antibodies (provider)
- Main image

- Experimental details
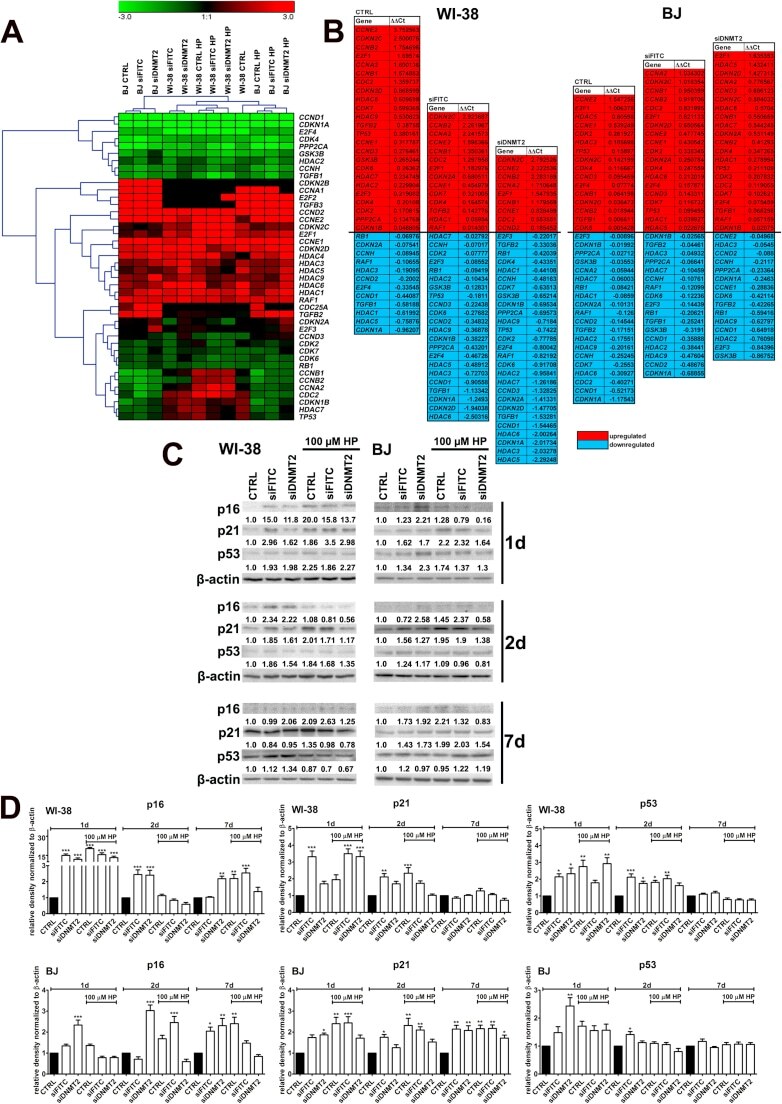
- Fig. 3 DNMT2 silencing-mediated effects on mRNA (A, B) and protein levels (C, D) of cell cycle regulators. HP treatment is also considered. (A, B) The expression of selected genes involved in the regulation of cell cycle. Cells were treated with 100 muM HP for 2 h and then cultured for 24 h. (A) A heat map generated from qRT-PCR data is shown. Hierarchical clustering was created using Genesis 1.7.7 software. (B) HP-mediated up- (red) and downregulation (blue) of cell cycle genes. DeltaDeltaCt values are shown. (C, D) Western blot analysis of the levels of p16, p21 and p53. Data were normalized to beta-actin. Bars indicate SD, n = 3, * p < 0.05, ** p < 0.01, *** p < 0.001 compared to CTRL (ANOVA and Dunnett's a posteriori test). Proliferatively active fibroblasts were used, namely WI-38 cells at PDLs from 34 to 43 and BJ cells at PDLs from 27 to 43. CTRL, non-transfected control fibroblasts; siFITC, fibroblasts transfected with control FITC-conjugated siRNA; siDNMT2, fibroblasts transfected with DNMT2 siRNA. (For interpretation of the references to color in this figure legend, the reader is referred to the web version of this article.) Fig. 3
- Submitted by
- Invitrogen Antibodies (provider)
- Main image
- Experimental details
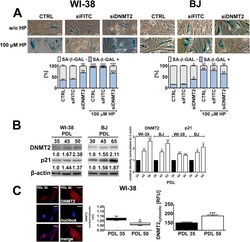
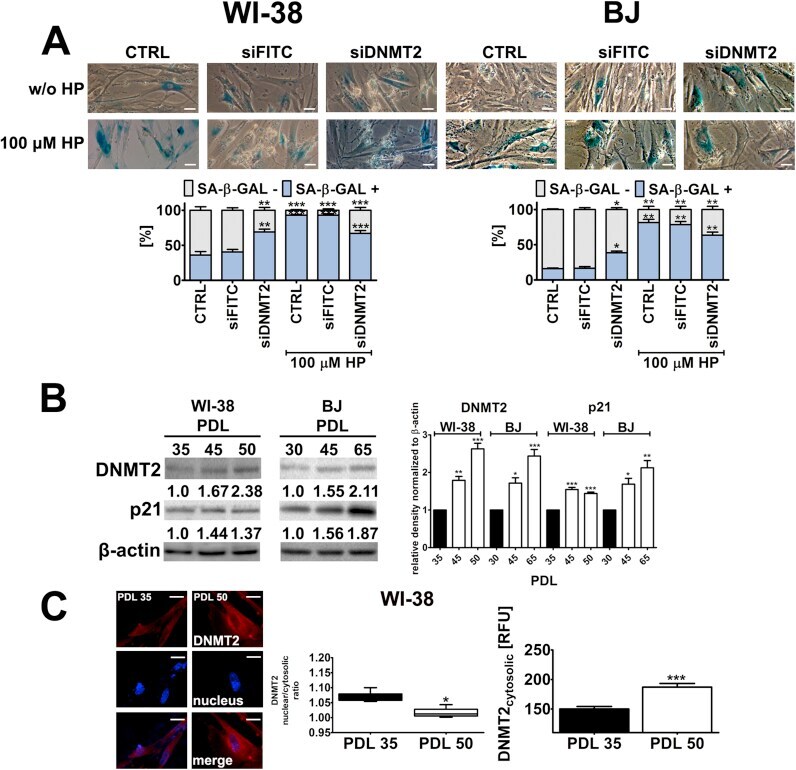
- Fig. 4 DNMT2 silencing- and HP-induced premature senescence (A), upregulation of DNMT2 levels during replicative senescence in WI-38 and BJ human fibroblasts (B) and decreased DNMT2 nuclear/cytosolic ratio and increased DNMT2 cytosolic fraction during replicative senescence in WI-38 cells (C). (A) Senescence-associated beta-galactosidase activity. Cells were treated with 100 muM HP for 2 h and then cultured for 7 days. Representative micrographs are shown. Scale bars 10 um, objective 10x. Bars indicate SD, n = 3, * p < 0.05, ** p < 0.01, *** p < 0.001 compared to CTRL (ANOVA and Dunnett's a posteriori test). Proliferatively active fibroblasts were used, namely WI-38 cells at PDLs from 34 to 43 and BJ cells at PDLs from 27 to 43. CTRL, non-transfected control fibroblasts; siFITC, fibroblasts transfected with control FITC-conjugated siRNA; siDNMT2, fibroblasts transfected with DNMT2 siRNA. (B) Western blot analysis of the levels of DNMT2. Data were normalized to beta-actin. Replicatively senescent cells (WI-38 cells at PDL 50 and BJ cells at PDL 65) were characterized by upregulation of p21. Bars indicate SD, n = 3, * p < 0.05, ** p < 0.01, *** p < 0.001 compared to PDL 35 (WI-38 cells) or PDL 30 (BJ cells) (ANOVA and Dunnett's a posteriori test). (C) DNMT2 immuno-signals (red) were analyzed using imaging cytometry (left). Nuclei were visualized using Hoechst 33342 staining (blue). Representative micrographs are shown. Scale bars 10 um, objective 10x. WI-38 cells at P
- Submitted by
- Invitrogen Antibodies (provider)
- Main image
- Experimental details
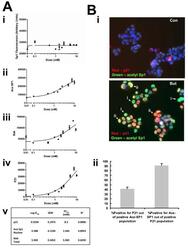
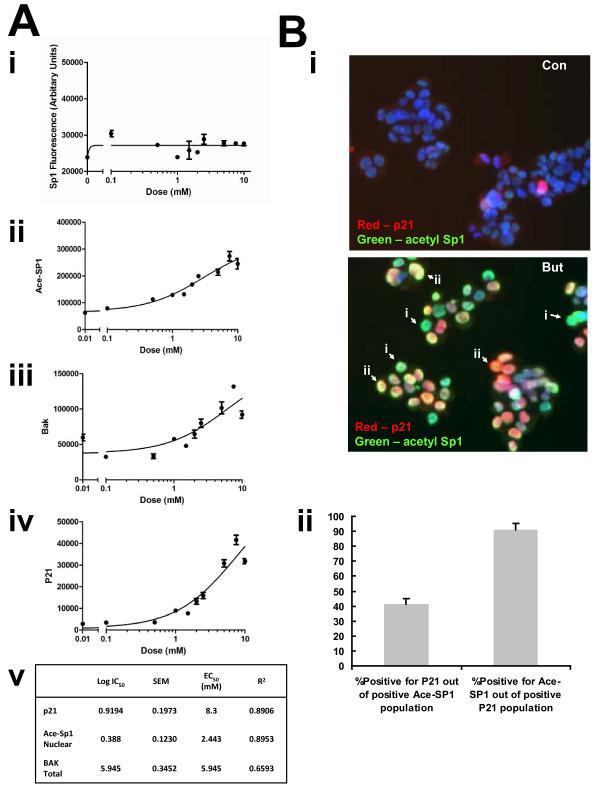
- Figure 1 Sp1 acetylation increases in a co-linear manner with bak and p21 expression following sodium butyrate treatment . HCT116 cells were treated with increasing concentrations of butyrate (0-20 mM) for 24 hr, fixed and fluorescence immunostained either for Sp1 and Bak or Ace-Sp1 and p21. Cellular fluorescence was quantified by High-Content Analysis. Panel A shows protein expression levels of Sp1 (Panel Ai); acetyl-Sp1 (Panel Aii); Bak, (Panel Aiii) and p21 (Panel Aiv). Data are from a single pass experiment with three replicates, with 50 fields per replicate scored. The EC 50 value for each event in response to butyrate is shown in Panel Av. Panel B shows representative images of HCT116 cells following 24 h of 0 or 10 mM sodium butyrate treatment and fluorescence immunostaining for acetyl-Sp1 and p21. Panel Bi shows representative fields from the control (untreated) cells (upper panel) and the treated culture (lower panel). Staining patterns in the treated cells broadly fell into two main types, cell positive for acetyl-Sp1 alone (examples marked by arrows i) and cells positive staining for both acetyl Sp1 and p21 (marked by arrows ii). These subpopulations were distinguished by plotting acetyl-Sp1 vs. p21 fluorescence (see supplementary online data Fig 2 for gating strategy). Panel Bii shows quantitation of data from three independent experiments, showing numbers of cells in gated fractions that were dual stained, as indicated.
- Submitted by
- Invitrogen Antibodies (provider)
- Main image
- Experimental details
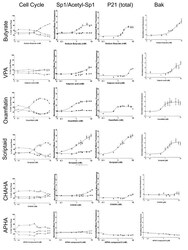
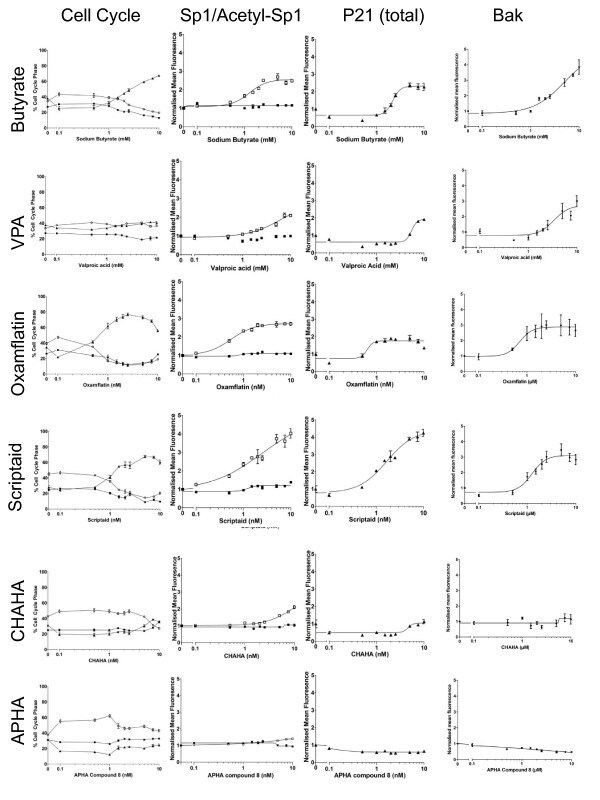
- Figure 3 Effect of HDACi on cell cycle, p21 expression, bak expression and Sp1 expression and acetylation . The extent of the concomitant response of Sp1 acetylation, cell cycle arrest and p21 up-regulation was determined using a high-content biology approach. HCT116 cells were treated with concentration ranges of 0-20 mM sodium butyrate, 0-20 mM valproic acid (VPA), 0-20 muM Oxamflatin, 0-20 muM Scriptaid, 0-20 muM APHA compound 8, 0-20 muM CHAHA. In all cases treatments were carried outfor 24 h. Cells were stained using immunocytochemistry for DNA content (Hoescht), p21, bak, Sp1 and acetyl-Sp1 as described in the methods section. Cells were analysed, on the basis of DNA content, for cell cycle phase and divided into G1 (filled circles), S (filled squares) or G2/M (filled triangles). Levels of protein were calculated from mean total fluorescence and are expressed in terms of fluorophore fluorescence relative to that observed in untreated cells. Sp1 (filled squares) and acetyl-Sp1 (open squares) are shown on the same graph.
- Submitted by
- Invitrogen Antibodies (provider)
- Main image
- Experimental details
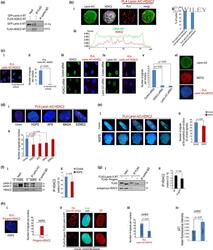
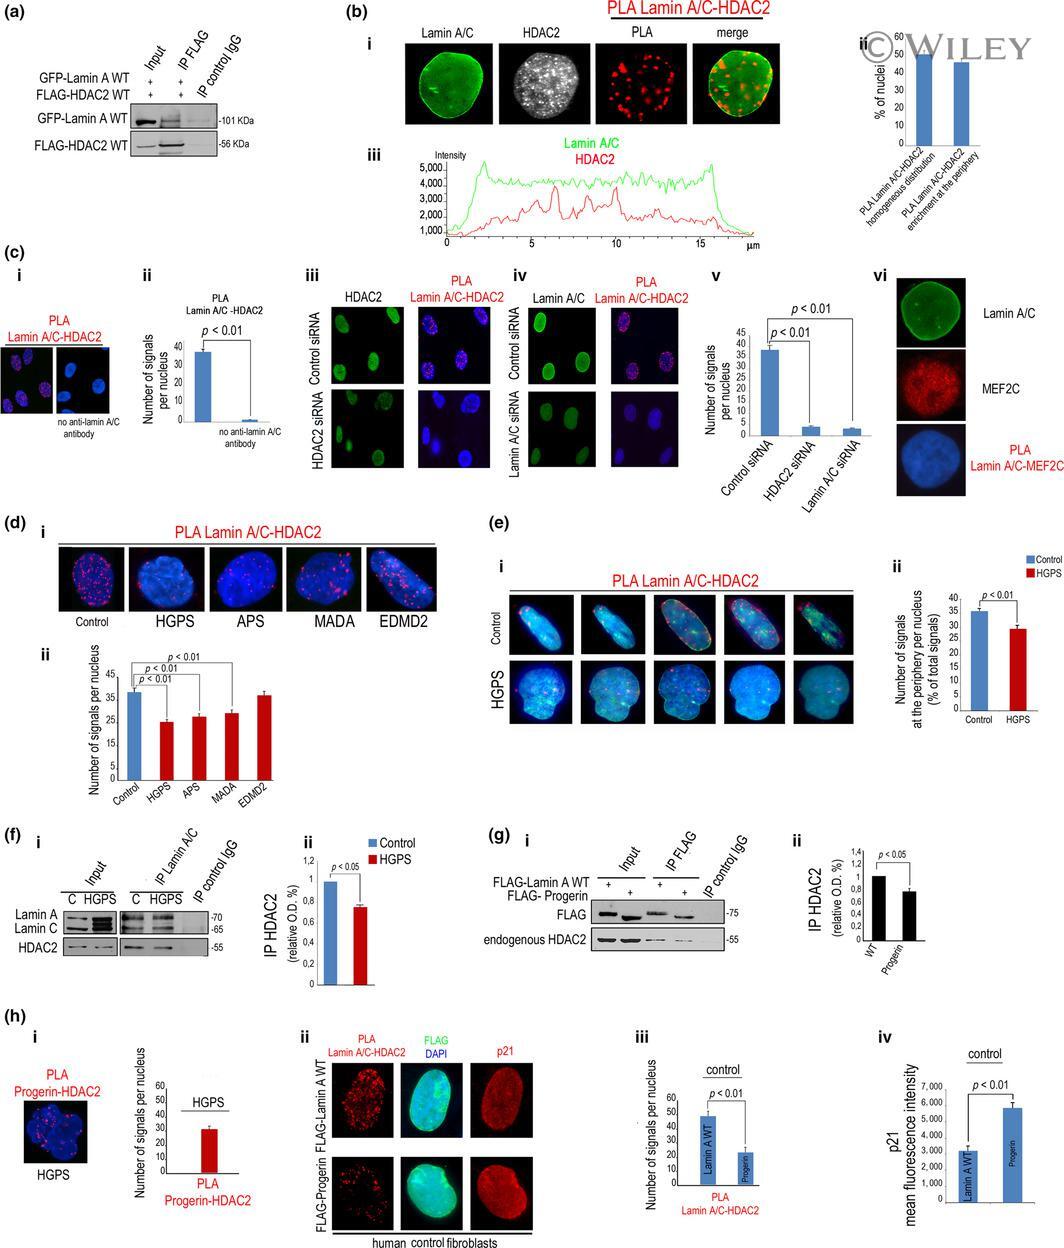
- Lamin A/C interacts with HDAC2 in human normal fibroblasts more strongly than progeroid mutants. (a) Co-IP of GFP-lamin A and FLAG-HDAC2 (IP FLAG) in HEK293 cells. IP control IgG, negative control. Molecular weight markers are indicated. (b) (i) Immunofluorescence staining of lamin A/C and HDAC2 and PLA of lamin A/C and HDAC2 (PLA) in human normal fibroblasts. PLA of lamin A/C and HDAC2 and lamin A/C staining are merged in the right picture (merge); (ii) percentage of nuclei showing less than 50% of signals at the periphery (PLA lamin A/C-HDAC2 homogenous distribution) or more than 50% of signals at the periphery (PLA lamin A/C-HDAC2 enrichment at the periphery); (iii) fluorescence intensity profile of lamin A/C and HDAC2 in a representative nucleus. (c) (i) PLA of lamin A/C and HDAC2 in the presence (left picture) or absence of lamin A/C antibody (no anti-lamin A/C antibody) and (ii) quantitative analysis; (iii) PLA of lamin A/C and HDAC2 after HDAC2 knockdown (HDAC2 siRNA); (iv) PLA of lamin A/C and HDAC2 after lamin A/C knockdown (lamin A/C siRNA) and (v) quantitative analysis of PLA signals in the indicated samples; (vi) lamin A/C and MEF2c staining and PLA of lamin A/C and MEF2c (no signals were detected). (d) (i) PLA of lamin A/C and HDAC2 in fibroblasts from healthy subjects, HGPS, APS, MADA, or EDMD2 patients (see Table for details) and (ii) quantitative analysis of PLA. (e) (i) Selected focal planes from the z-stack of nuclei from normal or HGPS cells subjected to
- Submitted by
- Invitrogen Antibodies (provider)
- Main image
- Experimental details
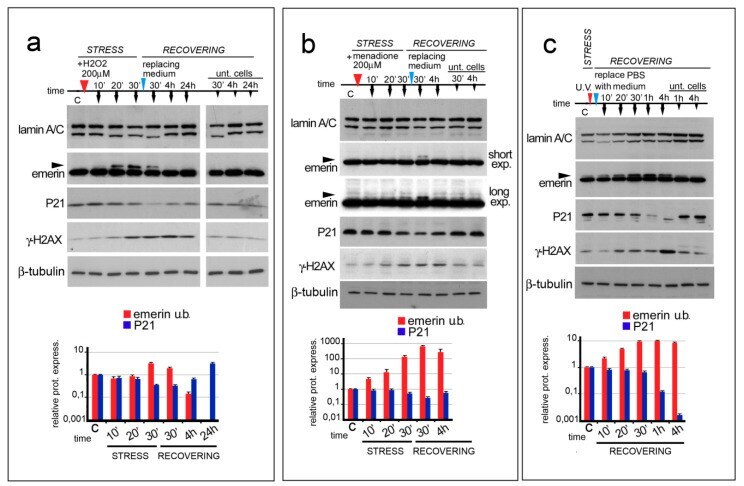
- Figure 1 ROS generating agents affect emerin migration in SDS-PAGE. In ( a - c ), the time course and sample treatment is indicated over the Western blot image. Stress (STRESS) indicates the time (30 min) during which cells underwent stressing stimulus. Red arrowheads indicate H 2 O 2 or menadione addition to the growth medium or cellular treatment with UV irradiation. Recovering (RECOVERING) indicates the time after replacement of growth medium (blue arrowheads) to remove H 2 O 2 or menadione or PBSX1 replacement with growth medium, in the case of UV irradiation. Sample collection at different time-points is indicated by black arrows. Time (time) is indicated in minutes during the stress (10', 20', and 30') and in minutes (30') and hours (4 and 24 h) during the recovery. ""C"" indicates untreated cells (T 0 ). ""Unt. Cells"" indicates untreated cells subjected only to growth medium replacement and harvested after 30 min, 4 h, and 24 h of recovering (30', 4 h, and 24 h). ( a ) Western blotting analysis of lamin A/C, emerin, P21, gamma-H2AX, and beta-tubulin performed on protein lysates isolated from HeLa cells treated with 200 muM H 2 O 2 . Arrowhead indicates emerin upper band. ( b ) Western blotting analysis of lamin A/C, emerin, P21, gamma-H2AX (gamma-H2AX), and beta tubulin performed on protein lysates isolated from HeLa cells treated with 200 muM menadione. Two different exposures (short exp. and long exp.) of emerin immunolabeled bands are shown. Emerin upper band is in
- Submitted by
- Invitrogen Antibodies (provider)
- Main image
- Experimental details
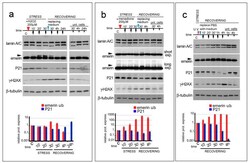
- Figure 2 Emerin phosphorylation increase during the oxidative stress response. ( a ) Staurosporine affects the molecular weight of emerin molecular weight during oxidative stress. The experimental workflow showing the initial treatments (black arrowhead for staurosporine, red arrowhead for H 2 O 2 ), and sample harvesting (black arrow) are indicated. Western blotting performed on protein lysates isolated from untreated HeLa cells (-), HeLa cells treated with H 2 O 2 (H 2 O 2 ) (+), and HeLa cells treated with staurosporine (Stau. ), alone or in combination with H 2 O 2 , are shown. Lamin A/C, emerin, P21, gamma-H2AX (gamma-H2AX) and actin immunological bands are shown. The upper (phosphorylated) emerin band is indicated (emerin u.b., red arrow). ( b ) Okadaic Acid favors the accumulation of the upper emerin band during the oxidative stress response. The experimental workflow showing start of treatment, (black arrowhead for Okadaic Acid, red arrowhead for H 2 O 2 ), and sample collection (black harrow) are indicated. Western blotting was performed on protein lysates isolated from untreated HeLa or HeLa cells treated with H 2 O 2 (H 2 O 2 ) and Okadaic Acid (O.A. ), either alone or in combination as shown. Lamin A/C, emerin, p21, gamma-H2AX (gamma-H2AX), and actin immunoblotted bands are shown. Emerin phosphorylated (upper) band is indicated (emerinu.b, red arrow). ( c ) OSMI-1, a specific inhibitor of the O-GlcNAc transferase, affects the molecular weight of emerin during the

- Submitted by
- Invitrogen Antibodies (provider)
- Main image
- Experimental details
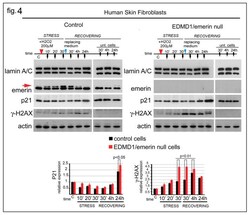
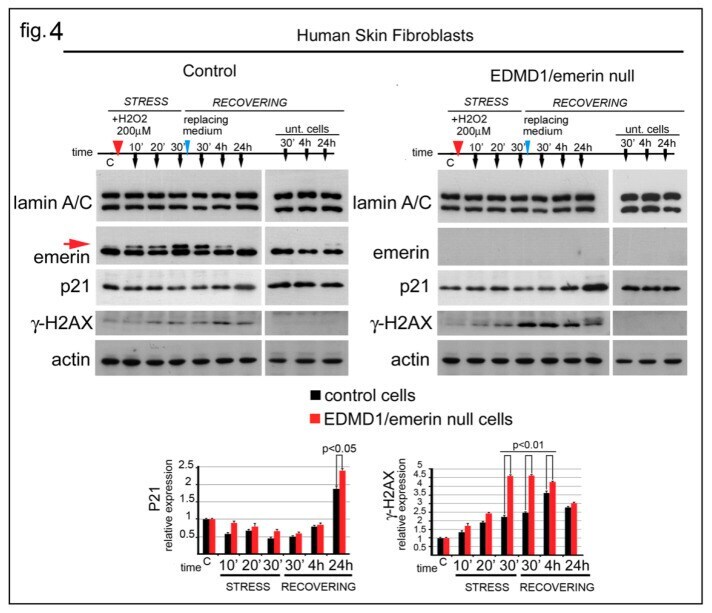
- Figure 4 Emerin depletion affects the DNA-damage response. Western blot analysis of human skin fibroblasts from a healthy donor (Control) and an EDMD1 patient (EDMD1/emerin-) subjected to H 2 O 2 treatment. Experimental procedure and sample collection are indicated over each Western blot panel. Stress (STRESS) indicates the time (30 min) during which cells underwent stressing stimulus. Red arrowhead indicates H 2 O 2 addition to the growth medium. ""Recovering"" indicates the time after replacement of growth medium (blue arrowheads). Sample collection at the different timepoint is indicated by black arrows. Time is indicated in minutes during the stress (10', 20', and 30') and in minutes (30') and hours (4 and 24 h) during the recovery. ""C"" indicates untreated cells before treatment. ""Unt. Cells"" indicates untreated cells subjected to growth medium replacement and harvested after 30 min, 4 h and 24 h of recovering. Lamin A/C, emerin, p21, gamma-H2AX (gamma-H2AX), emerin, and actin bands are shown. Densitometric analysis of p21 and gamma-H2AX (gamma-H2AX) bands normalized to control and EDMD1 untreated cells is reported. The red arrow indicates the phosphorylated emerin band. Statistical differences (Student's t-test) between control and treated EDMD1 cells are indicated.
- Submitted by
- Invitrogen Antibodies (provider)
- Main image
- Experimental details
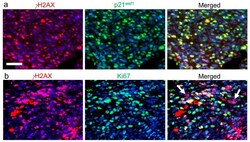
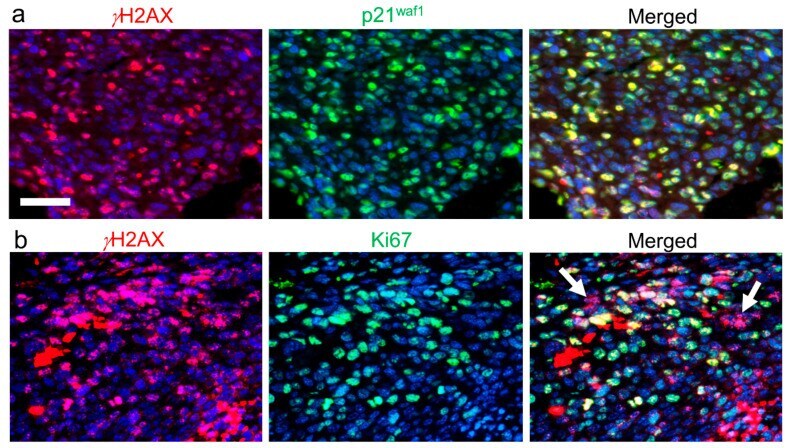
- Figure 2 mEHT treatment-related DNA double-strand breaks indicated by histone 2AX (H2ax) phosphorylation ( gamma H2ax, red) in a C26 colorectal cancer allograft (unpublished data from the experiments of Vancsik et al., 2018 []). High gamma H2ax levels: (1) inducing the upregulation of p21 waf1 cyclin-dependent kinase inhibitor (green) protein (( a ) see their complete overlap); (2) the non-proliferating, Ki67 (green)-negative tumor cells (arrows) are clearly related to mEHT treatment ( b ). In terms of immunofluorescence double labeling, cell nuclei are stained using 4'',6-diamidino-2-phenylindole (DAPI) (blue). Scale bar: 50 mum (for all).
- Submitted by
- Invitrogen Antibodies (provider)
- Main image
- Experimental details
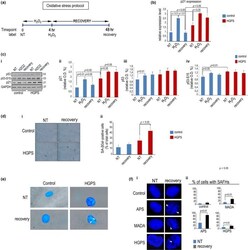
- Figure 1 Altered p21 modulation during stress response in HGPS cells. Control or HGPS fibroblasts were left untreated (NT), exposed to H 2 O 2 for 4 hr (H 2 O 2 ), or harvested after 48 hr of H 2 O 2 recovery (recovery). (a) Sketch of the oxidative stress experiment aligned along the time axis. (b) Quantitative RT-PCR of CDKN1A expression. (c) (i) Western blot of p53, phospho-p53 (p53-S15), and p21; (ii) densitometry of p21 bands, (iii) densitometry of p53 bands, and (iv) densitometry of p53-S15 bands; (d) (i) SA-betaGal staining of control and HGPS cells left untreated or after H2O2 recovery; (ii) quantitative analysis of SA-betaGal-positive cells. (e) SA-betaGal and DAPI co-staining in normal and HGPS cells showing SAHF (arrowheads). (f) (i) DAPI staining of nuclei of normal, APS, MADA, and HGPS fibroblasts; (ii) percentage of cells with SAHF

- Submitted by
- Invitrogen Antibodies (provider)
- Main image
- Experimental details
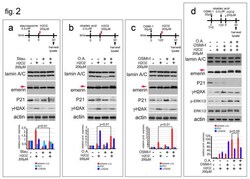
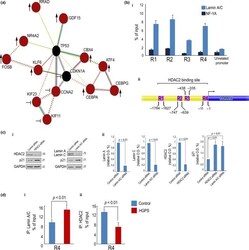
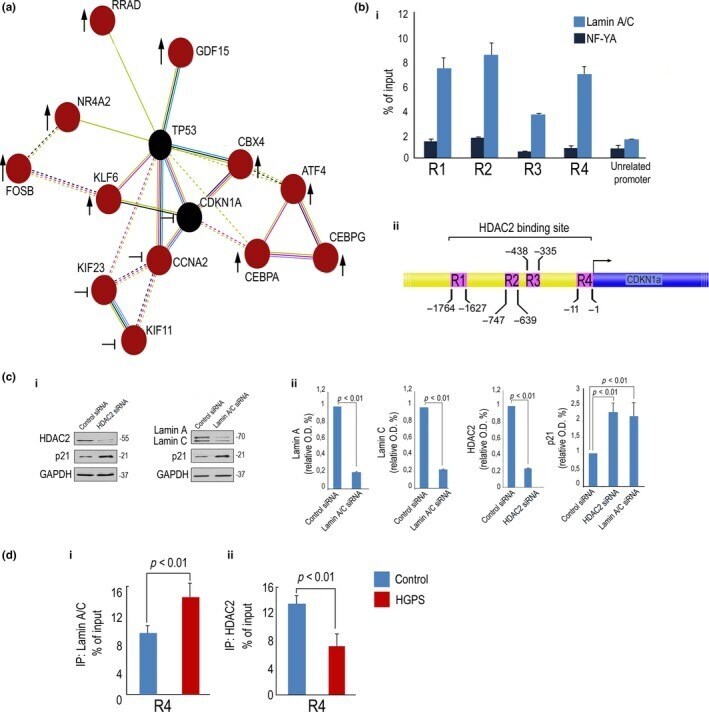
- Figure 2 Regulation of stress response and p21 by lamin A/C. (a) String map ( https://string-db.org/ ) indicating interconnections among genes analyzed in the microarray reported in Table 2 . Genes upregulated in HGPS after H 2 O 2 treatment with respect to H 2 O 2 -treated human normal fibroblasts are indicated by an arrow, and genes whose regulation after H 2 O 2 treatment is hampered in HGPS are indicated by the symbol +. (b) (i) Chromatin immunoprecipitation (ChIP) of lamin A/C on the CDKN1A promoter in normal fibroblasts. The promoter of CDKN1A and CXCR4 (unrelated promoter) was detected by qPCR with specific primers listed in Experimental procedures. Protein binding is expressed as the percentage of the total DNA input. CDKN1A promoter regions bound by lamin A/C (R1, R2, R3, R4) are indicated; (ii) Schematic representation of regions bound by lamin A/C (R1, R2, R3, R4), on CDKN1A gene promoter. (c) (i) Western blot of p21, lamin A/C and HDAC2 in fibroblasts left untreated or after siRNA silencing of HDAC2 or Lamin A/C and (ii) corresponding densitometry. (d) ChIP of (i) lamin A/C or (ii) HDAC2 on the CDKN1A promoter in normal or HGPS fibroblasts. CDKN1A promoter region (R4) bound by lamin A/C or HDAC2 is indicated
- Submitted by
- Invitrogen Antibodies (provider)
- Main image

- Experimental details
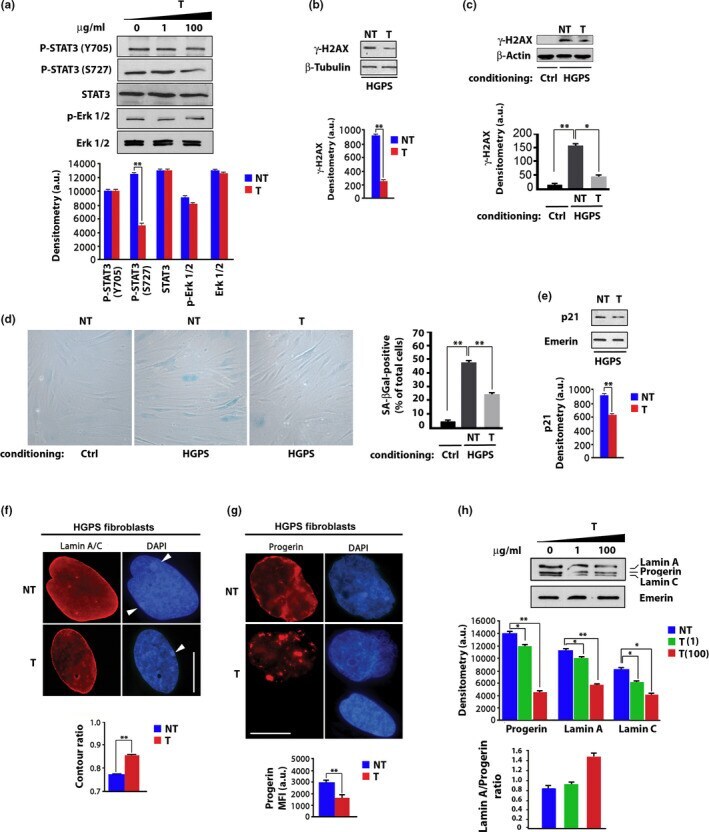
- FIGURE 2 Tocilizumab reduces IL-6 dependent STAT3 and gamma-H2AX activation and counteracts cellular senescence. (a) Western blot analysis of STAT3 phosphorylated on Tyrosine 705 (P-STAT3 Y705) or Serine 727 (P-STAT3 S727), STAT3, in untreated or tocilizumab-treated HGPS fibroblasts (T). Tocilizumab dosage (ug/ml culture medium) is indicated in the upper row. In the graphs and all the following panels: NT, 0 ug/ml tocilizumab; T, 100 ug/ml tocilizumab. (b)Western blot analysis of gamma-H2AX in HGPS fibroblasts and (c) in normal human dermal fibroblasts subjected to conditioning with control fibroblasts (ctrl) or HGPS fibroblast medium (HGPS). beta-tubulin and beta-actin bands are shown as protein-loading controls. (d) Senescence-associated beta-Galactosidase staining (SA-betaGal) of normal human dermal fibroblasts co-cultured with control (ctrl) or HGPS fibroblasts (HGPS)left untreated (NT) or treated with tocilizumab (T).The percentage of SA-betaGal-positive cells is reported in the graph. (e) Western blot analysis of p21 in HGPS fibroblasts. (f) Immunofluorescence analysis of Lamin A/C in HGPS fibroblasts untreated (NT) and treated (T) with tocilizumab. DAPI staining of DNA (blue) allows detection of facultative heterochromatin areas (arrowheads), which correspond to inactive X chromosome and appear duplicated in the untreated HGPS fibroblasts, but not in tocilizumab-treated cells. Scale bar, 10 um. Contour ratio of nuclei determined in HGPS fibroblasts left untreated (NT)
- Submitted by
- Invitrogen Antibodies (provider)
- Main image

- Experimental details
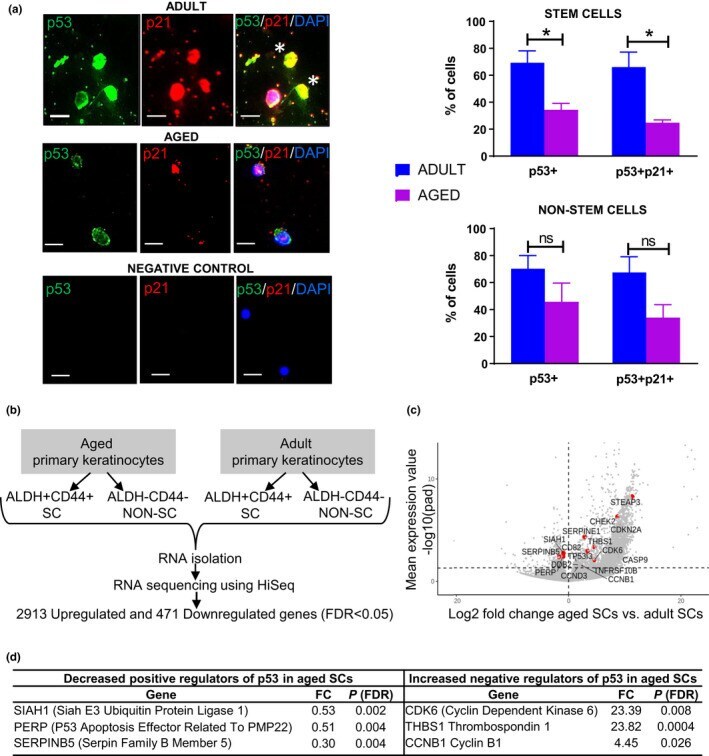
- FIGURE 3 Aged ALDH+CD44+ keratinocyte stem cells exhibit decreased p53 expression and activity compared with adult. (a) Immunofluorescence study showing p53 nuclear expression and p21 nuclear expression (evidence for p53 activity) in adult and aged keratinocyte SCs. Asterisks indicate keratinocyte SCs positive for p53 and p21 nuclear expression. Negative control without primary antibody. Scale bars 10 um. Upper histogram showing a significant decrease for ALDH+CD44+ SCs, in p53 and p53/p21 nuclear expression in aged versus adult ( n = 3, separate individuals, 100 ALDH+CD44+ SCs per sample). Also, lower histogram showing a trend toward a decrease for ALDH-CD44- non-SCs in p53 ( p = 0.19) and p53/p21 ( p = 0.06) nuclear expression in aged versus adult ( n = 3, separate individuals, 100 ALDH-CD44- non-SCs per sample). Values are expressed as mean +-SEM and analyzed using a Student's t test. * p < 0.05. (b) RNA sequencing of human aged versus adult SCs and non-SCs. (c) Volcano plot displaying differentially expressed genes between aged SCs and adult SCs. The red dots represent the transcripts belonging to the p53 signaling pathway family. Positive x-values represent up-regulation and negative x-values represent down-regulation. (d) Underlying the decreased p53 signaling pathway (KEGG analysis) in aged versus adult SCs were positive regulators of the p53 pathway that show decreased expression with age and negative regulators that show increased expression with age
- Submitted by
- Invitrogen Antibodies (provider)
- Main image
- Experimental details
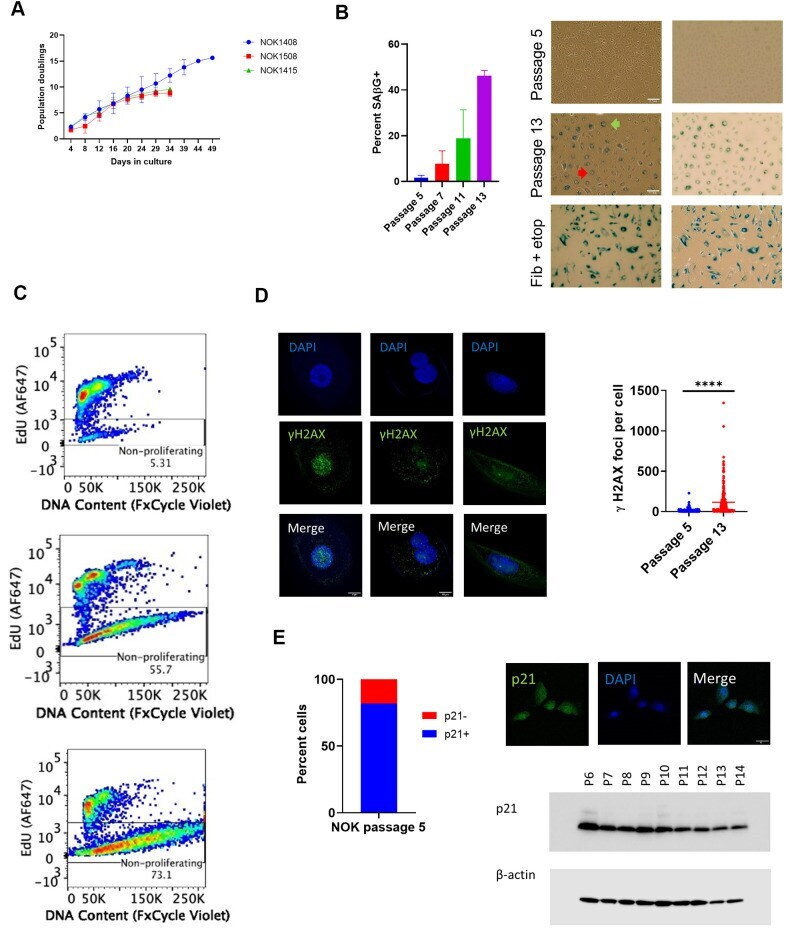
- Figure 1 Indicia of senescence. ( A ) Population doubling. Y-axis is cumulative population doubling (PD) and X-axis is days in culture starting with passage 5. (Mean of 2 replicates per donor +- SD.) Cumulative PD = 3.322 x [log N(t) - log N(0)] + X, where N(0) is number of cells plated (5 x 10 5 ), N(t) is number of cells at next passage, and X is PD for prior passages. ( B ) SAbetaG+ cells increased with passaging. (Top, passage 5; middle, passage 13, Donor 1415). (Mean +- SD.) Positive control (bottom) is etoposide-treated BJ fibroblasts. (Left, phase contrast; right, brightfield. 20x magnification.) Multinucleate cell, red arrow. Perinuclear vacuoles, green arrow. ( C ) Representative EdU flow cytometry results. (Donor 1415. Top, passage 5; middle, passage 10; bottom, last passage). ( D ) gammaH2AX IF. Staining shows significant increase (p < 0.0001, two-tailed t-test) in DSBs with passaging (Donors 1415 and 1408, combined), and binucleation and cytosolic foci in passage 13 cells (Donor 1415, left and center column images; Donor 1408, right column images). ( E ) Cells positive for p21WAF1/CIP1. Percent positive in nucleus at passage 5 (640 total cells from Donors 1408 and 1415). IF shows nuclear p21WAF1/CIP1 protein in passage 5 cells (Donor 1408). Immunoblot shows decline in p21WAF1/CIP1.
- Submitted by
- Invitrogen Antibodies (provider)
- Main image
- Experimental details
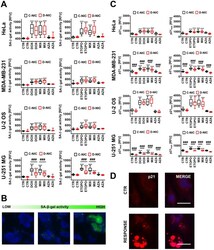
- Figure 2 DNMT2/TRDMT1 gene knockout-mediated changes in the levels of senescence-associated-beta-galactosidase (SA-beta-gal) positive cells ( A , B ) and nuclear p21 pools ( C , D ) in four cancer cell lines treated with DOX or ETOPO. ( A , B ) Cellular senescence was revealed using imaging cytometry. SA-beta-gal activity is presented as relative fluorescence units (RFU). ( B ) Representative microphotographs are shown, objective 20x, nucleus staining (blue), SA-beta-gal staining (green). ( C , D ) Nuclear p21 immuno-staining. ( C ) Nuclear p21 levels are presented as relative fluorescence units (RFU). ( D ) Representative microphotographs are shown, objective 20x, nucleus staining (blue), nuclear p21 immuno-staining (red), RESPONSE, representative DOX or ETOPO treatment. ( A , C ) Box and whisker plots are shown, n = 3, *** p < 0.001 compared to CTR (ANOVA and Dunnett's a posteriori test), ### p

- Submitted by
- Invitrogen Antibodies (provider)
- Main image
- Experimental details
- Fig. 5 Regulatory role of NaB in high cholesterol-induced downregulation of p21 and p21/NRF2 colocalization. a SK-N-MC cells were pretreated with NaB for 30 min prior to high cholesterol treatment for 24 h. NRF2, Lamin A/C, and beta-actin protein levels in cytosolic and nuclear-fractionized samples were analyzed by western blot. n = 3. b Cells were immunostained with NRF2 antibody. Scale bars are 8 um (magnification, x1,000). n = 3. c SK-N-MC cells were pretreated with NaB for 30 min prior to high cholesterol treatment for 24 h. Sp1, Lamin A/C, and beta-actin protein levels in cytosolic and nuclear-fractionized samples were analyzed by western blot. n = 3. d Cells were immunostained with sp1 antibody. Scale bars are 8 um (magnification, x1,000). n = 4. * p < 0.05 versus control, # p < 0.05 versus high cholesterol treatment. e Cells were pretreated with NaB and ibuprofen for 30 min prior to treatment of high cholesterol for 24 h. Sp1, Lamin A/C, and beta-actin protein levels in cytosolic and nuclear-fractionized samples were analyzed by western blot. n = 3. f Cells were pretreated with NaB and C646 for 30 min prior to treatment of high cholesterol for 24 h. Sp1, Lamin A/C, and beta-actin protein levels in cytosolic and nuclear-fractionized samples were analyzed by western blot. n = 3. * p < 0.05 versus control, # p < 0.05 versus high cholesterol treatment, $ p < 0.05 versus treatment of high cholesterol and NaB. g Cells were pretreated with NaB for 30 min prior to high cholest

- Submitted by
- Invitrogen Antibodies (provider)
- Main image
- Experimental details
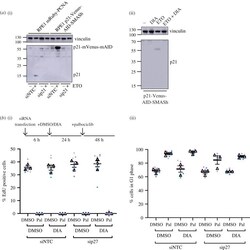
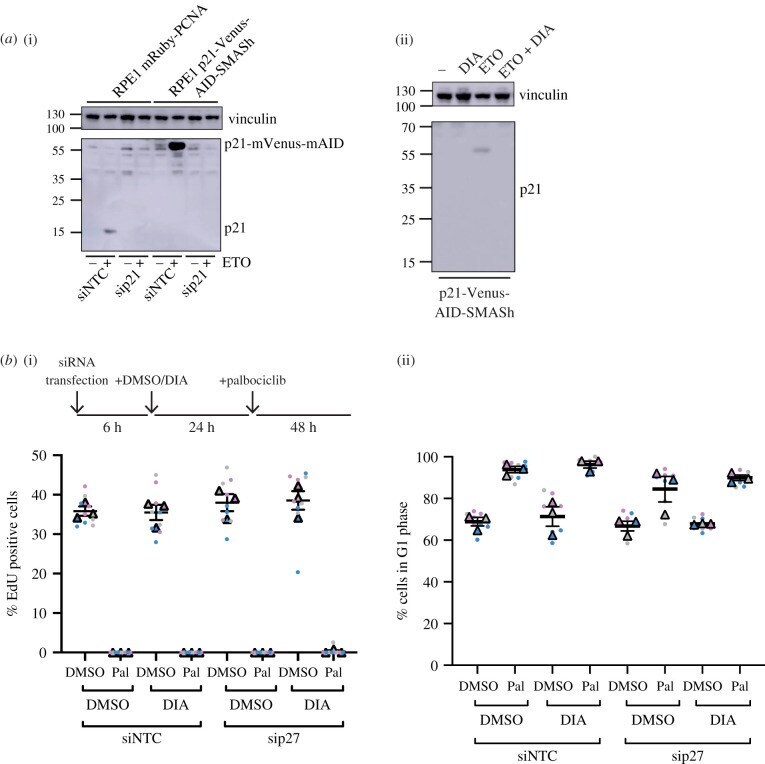
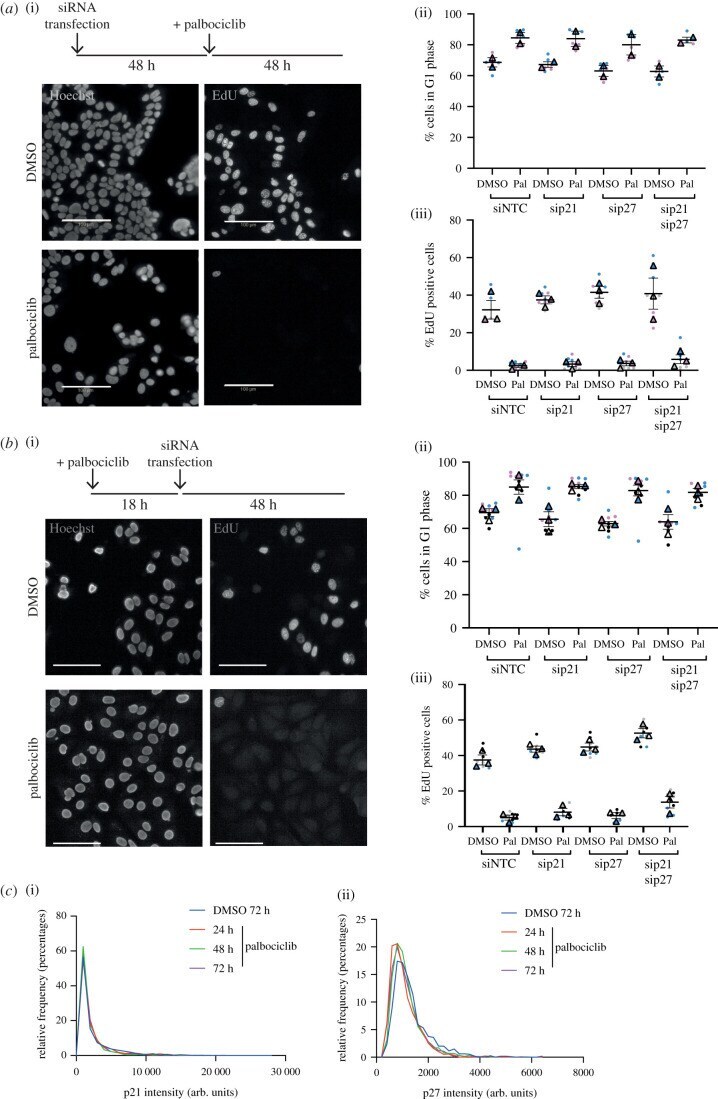
- Figure 3 . Generation of p21-degron lines. ( a ) Western blot of whole-cell extract from indicated cell lines probing for p21, indicating all p21 expressed in the hTert-RPE1 OsTIR1 mRuby-PCNA p21-mVenus-mAID-SMASh cell line is tagged with mVenus-mAID. (i) Cells were reverse transfected with the indicated siRNAs, NTC or p27 and collected after 48 h; 10 uM etoposide (ETO) was added 24 h prior to sample collection to induce DNA damage as p21 expression is low in untreated hTert-RPE1 cells. p21-mVenus-mAID has a predicted molecular weight of 55 kDa; no p21-mVenus-mAID-SMASh is detected as the SMASh tag self-cleaves from the protein. Vinculin was used as a loading control. (ii) Western blot of whole-cell extract indicating that p21-mVenus-AID-SMASh is degraded following DIA (doxycycline, IAA and ASV) addition after induction of p21 expression by ETO. ETO and DIA: doxycycline (1 ug ml -1 ), IAA (500 uM) and ASV (3 uM) were added 24 h before sample collection. ( b ) hTert-RPE1 mRuby-PCNA p21-Venus-AID-SMASh cells were reverse transfected with the indicated siRNAs, 6 h later DMSO or DIA were added as indicated and 24 h DMSO or palbociclib added for 48 h. Cells were pulse labelled with EdU before fixation and (i) EdU incorporation and (ii) G1 percentage were quantified. Data from n = 3 repeats plotted as SuperPlots. One-way ANOVA with Sidak's multiple comparisons test was used to compare palbociclib-treated samples with control (siNTC DMSO palbociclib), all differences were non-signif
- Submitted by
- Invitrogen Antibodies (provider)
- Main image
- Experimental details
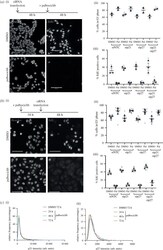
- Figure 5 . MCF7 cells do not require p21 or p27 for palbociclib-mediated cell cycle arrest. ( a ) MCF7 cells were transfected with the indicated siRNAs, NTC, sip21 and/or sip27 48 h before treatment with 1 uM palbociclib. Cells were pulse labelled for 30 min with 10 uM EdU and fixed 48 h following palbociclib addition. ( b ) MCF7 cells were treated with palbociclib for 18 h before transfection with the indicated siRNAs. Cells were fixed 48 h following palbociclib addition, after 30 min pulse labelling with 10 uM EdU. ( a , b ) Data plotted as SuperPlots; dots represent replicate wells; colour coded by experimental repeat. Triangles represent mean values for n = 3 ( n = 2 for ( a ), ii) repeats with mean and s.e.m. shown. Scale bar = 100 um. One-way ANOVA with Sidak's multiple comparisons test was performed between mean values of palbociclib-treated samples in comparison to WT siNTC palbociclib, all differences were non-significant. ( c ) MCF7 cells were treated with DMSO for 72 h or palbociclib for 24, 48 or 72 h and (i) p21 and (ii) p27 levels quantified by immunofluorescence. Representative frequency distributions of measured intensities from one experimental repeat (from n = 3) shown.
- Submitted by
- Invitrogen Antibodies (provider)
- Main image

- Experimental details
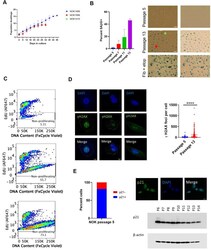
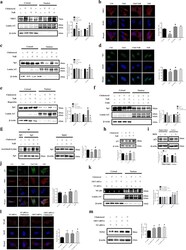
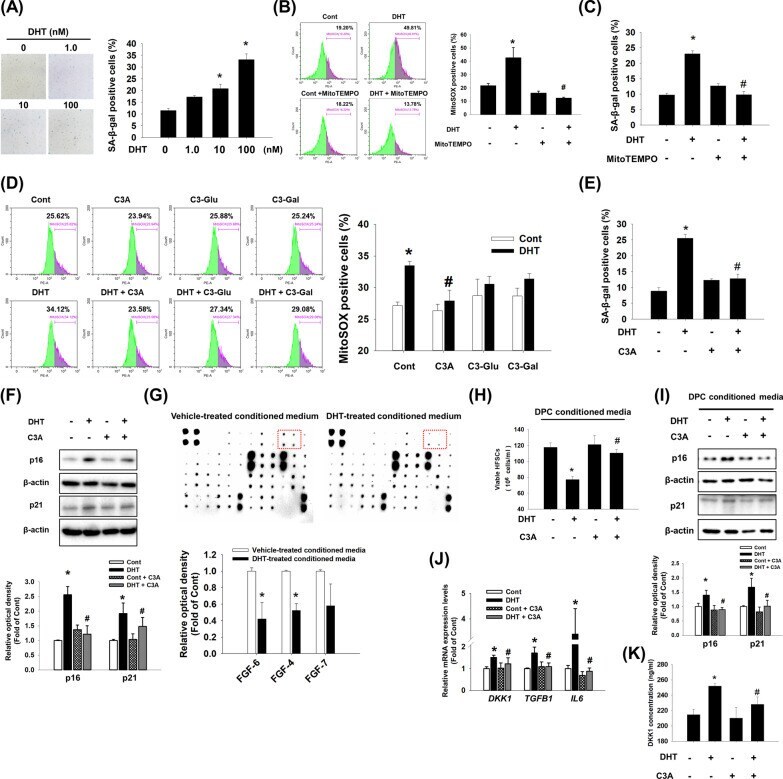
- Effect of C3A on DHT-induced DPC senescence. A Dermal papilla cells (DPC) were treated with dihydrotestosterone (DHT) (0 to 100 nM) for 72 h. Senescent cells were determined by senescence associated beta-galactosidase activity (SA-beta-gal) assay. The positive cells (blue) were counted in five random fields manually. Proportional number of positive cells was presented by the percentage of cells of each treat group. N = 5. B Cells were pretreated with MitoTEMPO (1 muM) for 30 min and treated with DHT (100 nM) for 48 h. Cells were stained with MitoSOX and analyzed by flow cytometer. N = 4. C Cells were pretreated with MitoTEMPO (1 muM) for 30 min and treated with DHT (100 nM) for 72 h. Senescent cells were detected with SA-beta-gal assay. N = 5. D Cells were pretreated with cyanidin 3- O -arabinoside (C3A) (1 muM), cyanidin-3- O -glucoside (C3-glu, 1 muM), and cyanidin-3- O -galactoside (C3-gal, 1 muM) for 30 min and treated with DHT for 48 h. Cells were stained with MitoSOX and analyzed by flow cytometer. N = 4. E Cells were pretreated with C3A for 30 min and exposed to DHT for 72 h. SA-beta-gal assay was performed. N = 5. F Cells were pretreated with C3A for 30 min and treated DHT for 72 h. The protein expression levels of p16 and p21 were analyzed by western blot analysis. beta-actin was used as a loading control. N = 4. G DPCs were treated with vehicle or DHT for 72 h. DPC conditioned media was used for growth factor antibody array. The results were captured by chemilumines
- Submitted by
- Invitrogen Antibodies (provider)
- Main image
- Experimental details
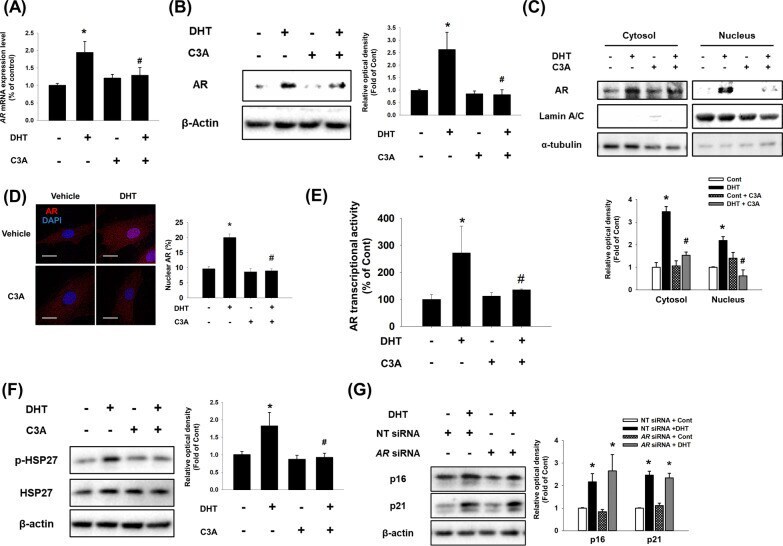
- Effect of C3A on DHT-induced nuclear translocation of AR. A - F DPCs were treated with C3A for 30 min prior to DHT for 24 h. A The relative mRNA expression level of AR was analyzed by real time PCR. Normalization was achieved by ACTB mRNA expression level ( B ) AR protein expression level was detected by western blot analysis. N = 3. C Nuclear and cytosolic proteins were separated by intracellular fractionation. Protein expression level of AR was detected. Lamin A/C was used as a nuclear marker, and alpha-tubulin was used as a cytosol marker. N = 3. D Cells were immunostained with anti-AR antibody (red). Nucleus is counterstained with DAPI (blue). N = 3. Magnification x1000. Scale bars are 8 mum. E AR transcriptional activity was analyzed by Cignal reporter assay. N = 5. F Phosphorylated HSP27 and HSP27 protein expression levels were analyzed by western blotting. N = 3. G Cells were transfected with non-targeting (NT) siRNA (25 nM) and AR siRNA (25 nM) and treated with DHT for 72 h. Western blotting analysis was performed for p16 and p21 proteins. beta-actin was used as a loading control. N = 3. Data are mean +- SEM. *p < 0.05 versus Control. # p < 0.05 versus DHT
- Submitted by
- Invitrogen Antibodies (provider)
- Main image

- Experimental details
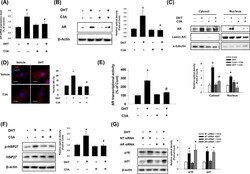
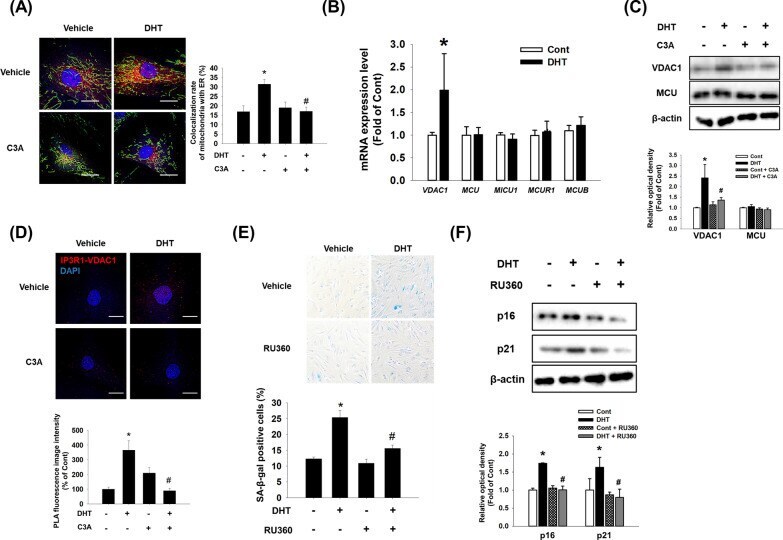
- Effect of C3A on DHT-induced ER-mitochondria contacts. A DPCs were treated with C3A and exposed to DHT for 24 h. Cells were visualized by staining with ER-Tracker (200 nM) and Mito-Tracker (200 nM). Colocalization of ER-Tracker and Mito-Tracker was analyzed by Image J software. N = 5. Magnification x1000. Scale bars are 8 mum. B Cells were treated with DHT for 24 h. The mRNA expression levels of VDAC1, MCU1, MICU1, MCUR1 , and MCUB were quantified by qPCR analysis. N = 5. C Cells were treated with C3A for 30 min and exposed to DHT for 24 h. Protein expression levels of MCU1 and VDAC1 were analyzed by western blotting. N = 4. D Interaction between VDAC1 and IP3R1 (VDAC1-IP3R1, red) in DPC cells was assessed by PLA assay. N = 4. Magnification x1000. Scale bars are 8 mum. E , F Cells were pretreated with RU360 (1 muM) for 30 min and exposed to DHT for 72 h. E SA-beta-gal activity assay was performed, and blue stained cells of total cells were counted. N = 5. F Protein expression levels of p16 and p21 were quantified by western blot analysis. N = 4. *p < 0.05 versus Control. # p < 0.05 versus DHT
- Submitted by
- Invitrogen Antibodies (provider)
- Main image
- Experimental details
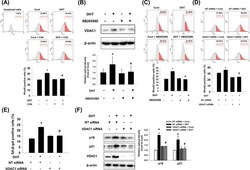
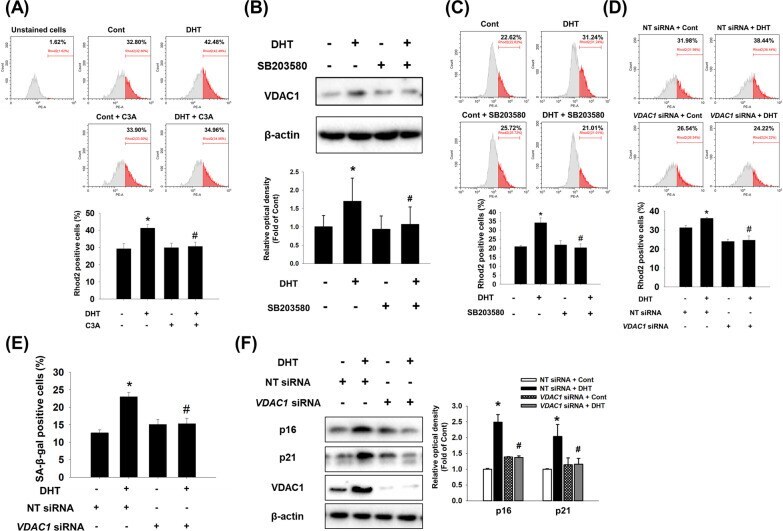
- Effect of C3A on DHT-induced mitochondrial calcium accumulation. A DPCs were treated with C3A for 30 min and exposed to DHT for 48 h. Cells were stained with Rhod-2 (2 muM) and positive cells were analyzed with flow cytometer. N = 6. B Cells were pretreated with SB203580 (1 muM) for 30 min and exposed to DHT for 24 h. VDAC1 expression level was analyzed by western blotting. C Cells were pretreated with SB203580 for 30 min and exposed to DHT for 48 h. Flow cytometric analysis was performed with Rhod-2 (2 muM) staining and phycoerythrin (PE)-positive cells were quantified. D Cells were transfected with NT siRNA (25 nM) and VDAC1 siRNA (25 nM) and exposed to DHT for 48 h. Flow cytometric analysis was achieved with Rhod-2 staining and PE-positive cells were quantified. N = 4. E , F Silencing with VDAC1 siRNA (25 nM) or NT siRNA (25 nM) was done and the cells were exposed to DHT for 72 h. E SA-beta-gal activity assay was performed, and blue stained cells of total cells were counted. N = 5. F Protein expression levels of p16, p21 and VDAC1 were quantified by western blot analysis. N = 4. *p < 0.05 versus Control. # p < 0.05 versus DHT or NT siRNA + DHT
- Submitted by
- Invitrogen Antibodies (provider)
- Main image
- Experimental details
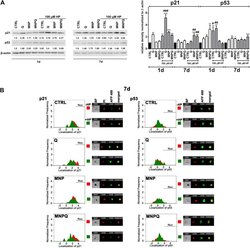
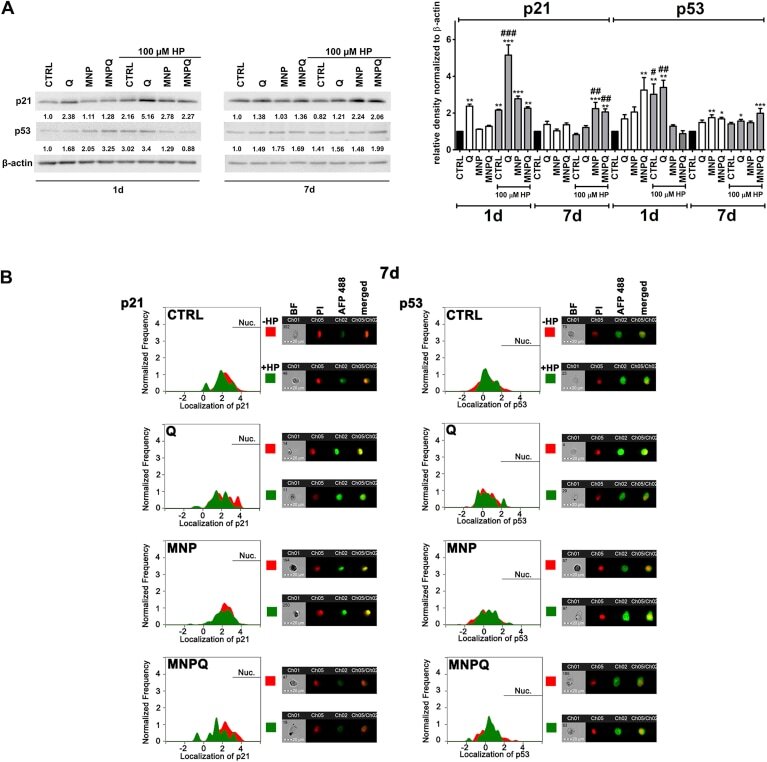
- Fig. 4 MNPQ-mediated changes in the levels (A) and localization (B) of cell cycle inhibitors, namely p21 and p53. (A) Western blot analysis of the levels of p21 and p53. Data were normalized to beta-actin. (B) Immunofluorescence analysis of cellular localization of p21 and p53. Representative histograms are presented (left). Samples without HP treatment are red and samples with HP treatment are green. Nuclear signals of p21 and p53 are denoted with horizontal lines (Nuc.). Representative images are also shown (right). Ch01, bright field (BF); Ch05, nucleus staining using propidium iodide staining (red, PI); Ch02, immunostaining of p21 and p53 using secondary antibodies conjugated to Alexa Fluor Plus 488 (green, AFP 488); Ch05/Ch02, a merged image of Ch05 and Ch02. Bars indicate SD, n = 3, *** p < 0.001, ** p < 0.01, * p < 0.05 compared to CTRL, ### p < 0.001, ## p < 0.01, # p < 0.05 compared to HP-treated control (ANOVA and Dunnett's a posteriori test). CTRL , control conditions; Q , quercetin; MNP , magnetite nanoparticles; MNPQ , quercetin surface functionalized magnetite nanoparticles. (For interpretation of the references to colour in this figure legend, the reader is referred to the Web version of this article.) Fig. 4
- Submitted by
- Invitrogen Antibodies (provider)
- Main image

- Experimental details
- Figure 6 Etoposide treatment activates the JAK-STAT signaling pathway in HGPS and normal cells. ( a ) Schematic representation of the etoposide treatment protocol. All treatments started with cultures exhibiting