Explore
 Validate
 Learn
Learn Western blot
 Immunohistochemistry
Antibody data
- Antibody Data
- Antigen structure
- References [1]
- Comments [0]
- Validations
- Immunohistochemistry [1]
- Other assay [2]
Submit
Validation data
Reference
Comment
Report error
- Product number
- PA5-40416 - Provider product page

- Provider
- Invitrogen Antibodies
- Product name
- FGD1 Polyclonal Antibody
- Antibody type
- Polyclonal
- Antigen
- Synthetic peptide
- Description
- Peptide sequence: WMAVLGRAGR GDTFCPGPTL SEDREMEEAP VAALGATAEP PESPQTRDKT Sequence homology: Cow: 86%; Dog: 86%; Horse: 79%; Human: 100%; Mouse: 86%; Pig: 86%; Rabbit: 79%; Rat: 86%
- Reactivity
- Human
- Host
- Rabbit
- Isotype
- IgG
- Vial size
- 100 μL
- Concentration
- 0.5 mg/mL
- Storage
- -20°C, Avoid Freeze/Thaw Cycles
Submitted references FGD1 promotes tumor progression and regulates tumor immune response in osteosarcoma via inhibiting PTEN activity.
Wu W, Jing D, Meng Z, Hu B, Zhong B, Deng X, Jin X, Shao Z
Theranostics 2020;10(6):2859-2871
Theranostics 2020;10(6):2859-2871
No comments: Submit comment
Supportive validation
- Submitted by
- Invitrogen Antibodies (provider)
- Main image
- Experimental details
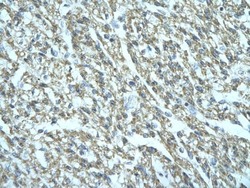
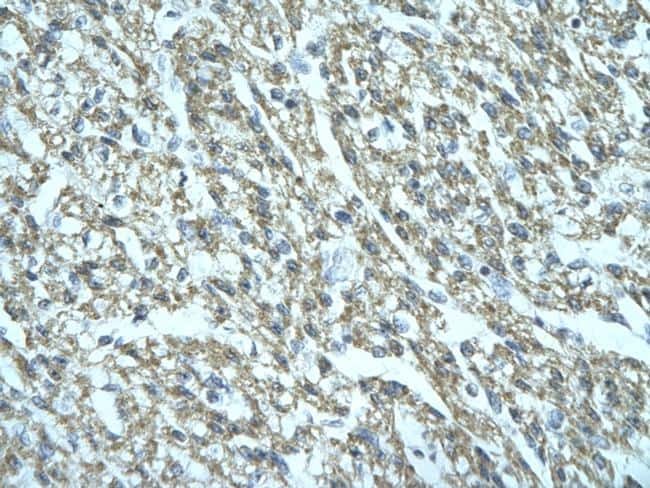
- Immunohistochemistry (paraffin-embedded) analysis of human cardiac tissue using an anti-FGD1 polyclonal antibody (Product # PA5-40416).
Supportive validation
- Submitted by
- Invitrogen Antibodies (provider)
- Main image
- Experimental details
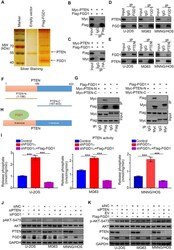
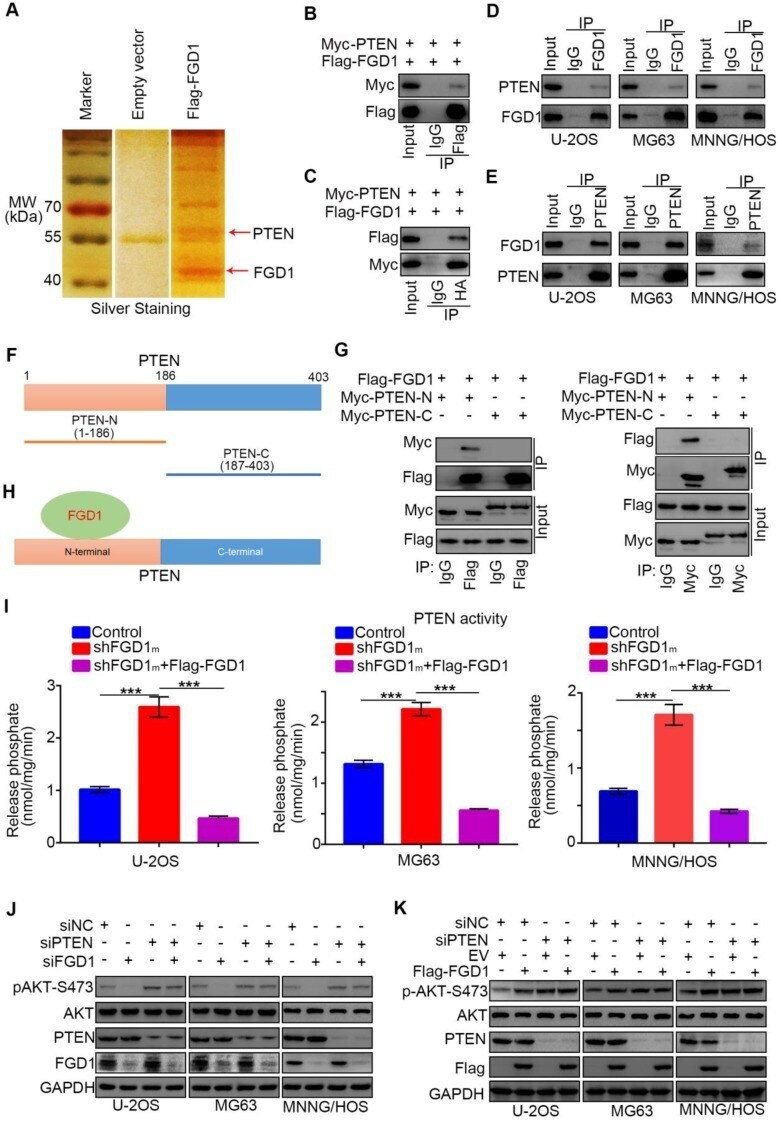
- Figure 4 FGD1 interacts with PTEN to inhibit PTEN phosphates activity in osteosarcoma cells. A, the WCL of 293T cells were subjected to silver staining and mass spectrometry after transfected indicated plasmids. B-C , 293T cells transfected with indicated plasmids was harvested for co-immunoprecipitation. D-E , Western blotting analysis of WCL of U-2OS, MG63 and MNNG/HOS cells. F , a schematic diagram depicting the domain of PTEN. G , Flag-FGD1, Myc-PTEN-C and Myc-PTEN-N were translated in vitro , and the co-immunoprecipitation was performed to evaluate the interaction between the PTEN recombination protein and FGD1. H , a schematic diagram depicting FGD1 interacted with the N-terminal region of PTEN. I , U-2OS, MG63 and MNNG/HOS cells were transfected with indicated constructs. After 72 h, the spend medium of each treatment group were collected for release phosphatase assay. ***, P < 0.001. J , Western blotting analysis of the WCL of osteosarcoma tumor cells (U-2OS, MG63 and MNNG/HOS) after transfected with indicated siRNAs. K , Western blotting analysis of the WCL of osteosarcoma tumor cells (U-2OS, MG63 and MNNG/HOS) after transfected with indicated plasmids.
- Submitted by
- Invitrogen Antibodies (provider)
- Main image
- Experimental details
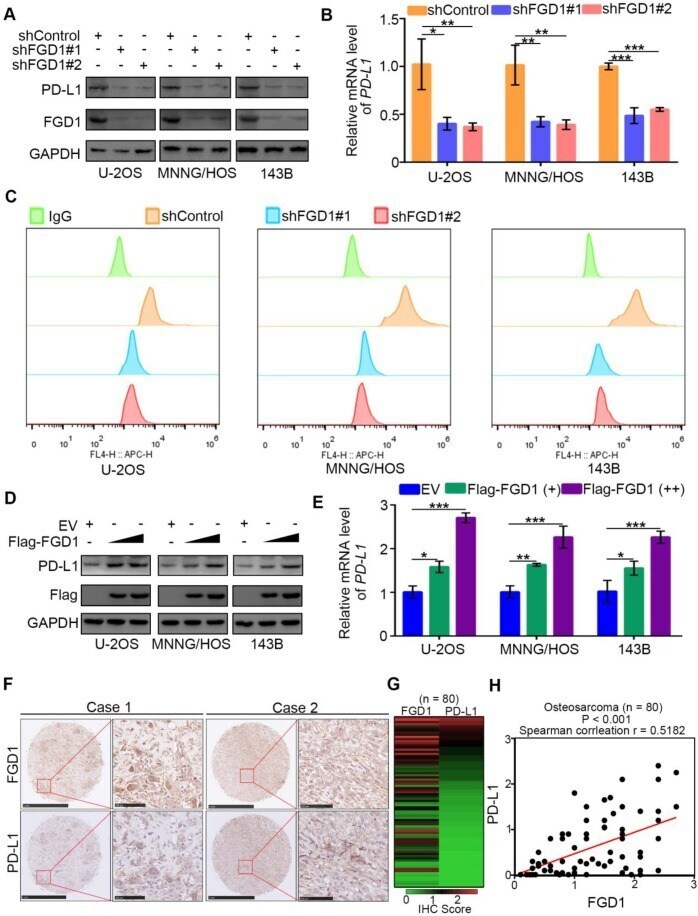
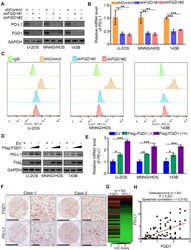
- Figure 5 FGD1 increases PD-L1 expression in OS cells. A-C, U-2OS, MNNG/HOS and 143b cells were infected with indicated shRNAs. After 72 h, cells were harvested for Western blotting analysis (A), RT-qPCR analysis (B) and flow cytometry assay (C). Date showed as Mean +- SD with three replicates. *, P < 0.05; **, P < 0.01; ***, P < 0.001. D-E , U-2OS, MNNG/HOS and 143b cells were infected with indicated plasmids. After 48 h, cells were harvested for Western blotting analysis (D), and RT-qPCR analysis (E). Date showed as Mean +- SD with three replicates. *, P < 0.05; **, P < 0.01; ***, P < 0.001. F-H , IHC analysis of FGD1 and PD-L1 in osteosarcoma tissue microarray. The typical image of IHC as presented in panel F, the IHC scores of FGD1 or PD-L1 in each osteosarcoma specimens as indicated in panel G, the correlation between FGD1 and PD-L1 as showed in panel H.