Explore
 Validate
 Learn
LearnPA1-860
antibody from Invitrogen Antibodies
Targeting: HDAC1
GON-10, HD1, KDAC1, RPD3L1
 Western blot
 Immunocytochemistry
 Immunoprecipitation Immunohistochemistry Chromatin Immunoprecipitation Other assay
Antibody data
- Antibody Data
- Antigen structure
- References [68]
- Comments [0]
- Validations
- Immunocytochemistry [10]
- Immunohistochemistry [3]
- Chromatin Immunoprecipitation [2]
- Other assay [39]
Submit
Validation data
Reference
Comment
Report error
- Product number
- PA1-860 - Provider product page

- Provider
- Invitrogen Antibodies
- Product name
- HDAC1 Polyclonal Antibody
- Antibody type
- Polyclonal
- Antigen
- Synthetic peptide
- Description
- PA1-860 detects histone deacetylase 1 (HDAC1) from human, mouse, rat, hamster and canine tissues and cells. PA1-860 has been successfully used in Western blot, immunoprecipitation, ChIP, immunofluoresence, immunocytochemistry and immunohistochemistry procedures. By Western blot, this antibody detects an ~62 kDa protein representing HDAC1 from HeLa cell lysate. Immunocytochemical staining of HDAC1 in HeLa cells with PA1-860 results in nuclear staining. The PA1-860 immunogen is a synthetic peptide corresponding to residues C E(467) E K P E A K G V K E E V K L A(482) of human HDAC1. This immunizing peptide (Cat. # PEP-069) is available for use in neutralization and control experiments.
- Reactivity
- Human, Mouse, Rat, Canine, Hamster
- Host
- Rabbit
- Isotype
- IgG
- Vial size
- 100 μg
- Concentration
- 1 mg/mL
- Storage
- -20°C, Avoid Freeze/Thaw Cycles
Submitted references MAD2L2 promotes replication fork protection and recovery in a shieldin-independent and REV3L-dependent manner.
Organic anion transporter 1 is an HDAC4-regulated mediator of nociceptive hypersensitivity in mice.
CREB inactivation by HDAC1/PP1γ contributes to dopaminergic neurodegeneration in Parkinson's disease.
Chronic Exposure to Alcohol Inhibits New Myelin Generation in Adult Mouse Brain.
LSD1 Facilitates Pro-Inflammatory Polarization of Macrophages by Repressing Catalase.
ATRX proximal protein associations boast roles beyond histone deposition.
Pooled CRISPR screening in pancreatic cancer cells implicates co-repressor complexes as a cause of multiple drug resistance via regulation of epithelial-to-mesenchymal transition.
Epstein-Barr virus nuclear antigen 3C (EBNA3C) interacts with the metabolism sensing C-terminal binding protein (CtBP) repressor to upregulate host genes.
Combined genomic and proteomic approaches reveal DNA binding sites and interaction partners of TBX2 in the developing lung.
HDAC1 modulates OGG1-initiated oxidative DNA damage repair in the aging brain and Alzheimer's disease.
HDAC1 dysregulation induces aberrant cell cycle and DNA damage in progress of TDP-43 proteinopathies.
HDAC2 Regulates Site-Specific Acetylation of MDM2 and Its Ubiquitination Signaling in Tumor Suppression.
Neuroepigenetic signatures of age and sex in the living human brain.
The class 3 PI3K coordinates autophagy and mitochondrial lipid catabolism by controlling nuclear receptor PPARα.
Downregulation of PARP1 transcription by CDK4/6 inhibitors sensitizes human lung cancer cells to anticancer drug-induced death by impairing OGG1-dependent base excision repair.
Effect of pioglitazone on the calcification of rat vascular smooth muscle cells through the downregulation of the Wnt/β‑catenin signaling pathway.
Class I lysine deacetylases promote glucocorticoid-induced transcriptional repression through functional interaction with LSD1.
Methylation of the phosphatase-transcription activator EYA1 by protein arginine methyltransferase 1: mechanistic, functional, and structural studies.
Loss of Asxl2 leads to myeloid malignancies in mice.
Downregulation of PARP1 transcription by promoter-associated E2F4-RBL2-HDAC1-BRM complex contributes to repression of pluripotency stem cell factors in human monocytes.
Subcellular Distribution of HDAC1 in Neurotoxic Conditions Is Dependent on Serine Phosphorylation.
The Selenocysteine-Specific Elongation Factor Contains Unique Sequences That Are Required for Both Nuclear Export and Selenocysteine Incorporation.
Lactate's effect on human neuroblastoma cell bioenergetic fluxes.
HDAC1 and HDAC2 collectively regulate intestinal stem cell homeostasis.
Combined HDAC1 and HDAC2 Depletion Promotes Retinal Ganglion Cell Survival After Injury Through Reduction of p53 Target Gene Expression.
Effect of high-intensity exercise on aged mouse brain mitochondria, neurogenesis, and inflammation.
Identification of myelin transcription factor 1 (MyT1) as a subunit of the neural cell type-specific lysine-specific demethylase 1 (LSD1) complex.
Overlapping chromatin-remodeling systems collaborate genome wide at dynamic chromatin transitions.
RNA-dependent dynamic histone acetylation regulates MCL1 alternative splicing.
Unfolded protein response signaling by transcription factor XBP-1 regulates ADAM10 and is affected in Alzheimer's disease.
Specificity in circadian clock feedback from targeted reconstitution of the NuRD corepressor.
HDAC1 and HDAC2 control the specification of neural crest cells into peripheral glia.
Lactate administration reproduces specific brain and liver exercise-related changes.
Proteomic and functional analyses reveal the role of chromatin reader SFMBT1 in regulating epigenetic silencing and the myogenic gene program.
Protein kinase CK2 regulates the dimerization of histone deacetylase 1 (HDAC1) and HDAC2 during mitosis.
SIRT1 collaborates with ATM and HDAC1 to maintain genomic stability in neurons.
Differential modulation of the oligodendrocyte transcriptome by sonic hedgehog and bone morphogenetic protein 4 via opposing effects on histone acetylation.
Chromatin modifications induced by the AML1-ETO fusion protein reversibly silence its genomic targets through AML1 and Sp1 binding motifs.
Differential response of cancer cells to HDAC inhibitors trichostatin A and depsipeptide.
Altered LKB1/CREB-regulated transcription co-activator (CRTC) signaling axis promotes esophageal cancer cell migration and invasion.
Stress-induced epigenetic transcriptional memory of acetylcholinesterase by HDAC4.
Identification of four potential epigenetic modulators from the NCI structural diversity library using a cell-based assay.
Histone Deacetylase Inhibitors and Mithramycin A Impact a Similar Neuroprotective Pathway at a Crossroad between Cancer and Neurodegeneration.
Identification of a gene regulatory network necessary for the initiation of oligodendrocyte differentiation.
Selective association of peroxiredoxin 1 with genomic DNA and COX-2 upstream promoter elements in estrogen receptor negative breast cancer cells.
EGF regulates survivin stability through the Raf-1/ERK pathway in insulin-secreting pancreatic β-cells.
Ageing-related chromatin defects through loss of the NURD complex.
Expression and regulation of vitamin D3 upregulated protein 1 (VDUP1) is conserved in mammalian and insect brain.
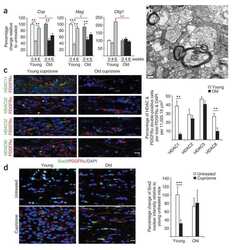
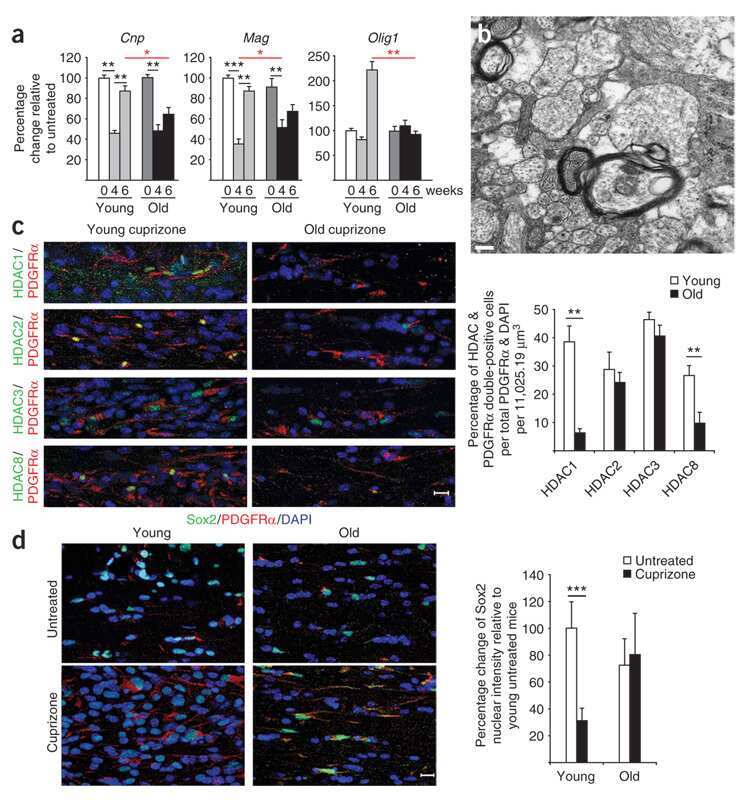
Age-dependent epigenetic control of differentiation inhibitors is critical for remyelination efficiency.
Retrograde GABA signaling adjusts sound localization by balancing excitation and inhibition in the brainstem.
Differential intranuclear organization of transcription factors Sp1 and Sp3.
Transcriptional repression of peroxisome proliferator-activated receptor beta/delta in murine keratinocytes by CCAAT/enhancer-binding proteins.
Histone modifications affect timing of oligodendrocyte progenitor differentiation in the developing rat brain.
Nucleolar localization of hepatic c-Myc: a potential mechanism for c-Myc regulation.
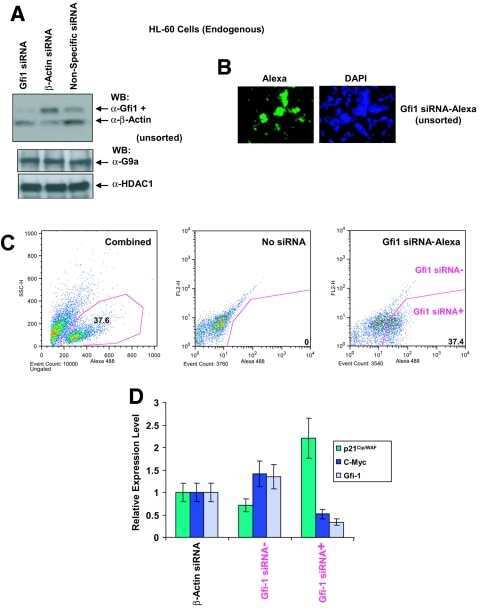
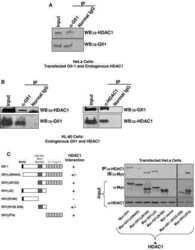
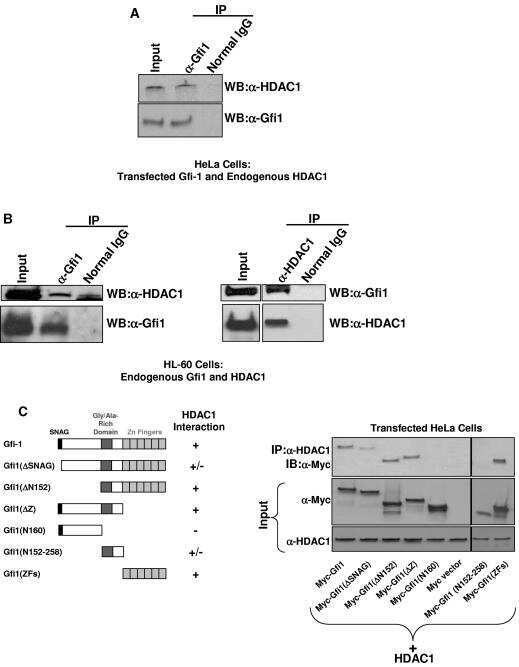
Gfi1 coordinates epigenetic repression of p21Cip/WAF1 by recruitment of histone lysine methyltransferase G9a and histone deacetylase 1.
Isolation and characterization of a novel DNA methyltransferase complex linking DNMT3B with components of the mitotic chromosome condensation machinery.
Modification of de novo DNA methyltransferase 3a (Dnmt3a) by SUMO-1 modulates its interaction with histone deacetylases (HDACs) and its capacity to repress transcription.
Tax relieves transcriptional repression by promoting histone deacetylase 1 release from the human T-cell leukemia virus type 1 long terminal repeat.
Atrophin 2 recruits histone deacetylase and is required for the function of multiple signaling centers during mouse embryogenesis.
Mitogen- and stress-activated protein kinase 1 activity and histone h3 phosphorylation in oncogene-transformed mouse fibroblasts.
Identification of a novel family of ankyrin repeats containing cofactors for p160 nuclear receptor coactivators.
The transcriptional repressor Sp3 is associated with CK2-phosphorylated histone deacetylase 2.
Retinoblastoma protein transcriptional repression through histone deacetylation of a single nucleosome.
Retinoblastoma protein transcriptional repression through histone deacetylation of a single nucleosome.
Pf1, a novel PHD zinc finger protein that links the TLE corepressor to the mSin3A-histone deacetylase complex.
Effect of estradiol on histone acetylation dynamics in human breast cancer cells.
A role for histone deacetylase activity in HDAC1-mediated transcriptional repression.
A mammalian histone deacetylase related to the yeast transcriptional regulator Rpd3p.
Paniagua I, Tayeh Z, Falcone M, Hernández Pérez S, Cerutti A, Jacobs JJL
Nature communications 2022 Sep 8;13(1):5167
Nature communications 2022 Sep 8;13(1):5167
Organic anion transporter 1 is an HDAC4-regulated mediator of nociceptive hypersensitivity in mice.
Litke C, Hagenston AM, Kenkel AK, Paldy E, Lu J, Kuner R, Mauceri D
Nature communications 2022 Feb 15;13(1):875
Nature communications 2022 Feb 15;13(1):875
CREB inactivation by HDAC1/PP1γ contributes to dopaminergic neurodegeneration in Parkinson's disease.
Xu 许潇依 X, He 何鑫 X, Zhang 张泽彦 Z, Chen 陈彦伊 Y, Li 黎俊宇 J, Ma 马珊珊 S, Huang 黄巧莹 Q, Li 黎明涛 M
The Journal of neuroscience : the official journal of the Society for Neuroscience 2022 Apr 29;42(22):4594-604
The Journal of neuroscience : the official journal of the Society for Neuroscience 2022 Apr 29;42(22):4594-604
Chronic Exposure to Alcohol Inhibits New Myelin Generation in Adult Mouse Brain.
Guo F, Zhang YF, Liu K, Huang X, Li RX, Wang SY, Wang F, Xiao L, Mei F, Li T
Frontiers in cellular neuroscience 2021;15:732602
Frontiers in cellular neuroscience 2021;15:732602
LSD1 Facilitates Pro-Inflammatory Polarization of Macrophages by Repressing Catalase.
Sobczak M, Strachowska M, Gronkowska K, Karwaciak I, Pułaski Ł, Robaszkiewicz A
Cells 2021 Sep 18;10(9)
Cells 2021 Sep 18;10(9)
ATRX proximal protein associations boast roles beyond histone deposition.
Scott WA, Dhanji EZ, Dyakov BJA, Dreseris ES, Asa JS, Grange LJ, Mirceta M, Pearson CE, Stewart GS, Gingras AC, Campos EI
PLoS genetics 2021 Nov;17(11):e1009909
PLoS genetics 2021 Nov;17(11):e1009909
Pooled CRISPR screening in pancreatic cancer cells implicates co-repressor complexes as a cause of multiple drug resistance via regulation of epithelial-to-mesenchymal transition.
Ramaker RC, Hardigan AA, Gordon ER, Wright CA, Myers RM, Cooper SJ
BMC cancer 2021 May 29;21(1):632
BMC cancer 2021 May 29;21(1):632
Epstein-Barr virus nuclear antigen 3C (EBNA3C) interacts with the metabolism sensing C-terminal binding protein (CtBP) repressor to upregulate host genes.
Ohashi M, Hayes M, McChesney K, Johannsen E
PLoS pathogens 2021 Mar;17(3):e1009419
PLoS pathogens 2021 Mar;17(3):e1009419
Combined genomic and proteomic approaches reveal DNA binding sites and interaction partners of TBX2 in the developing lung.
Lüdtke TH, Wojahn I, Kleppa MJ, Schierstaedt J, Christoffels VM, Künzler P, Kispert A
Respiratory research 2021 Mar 17;22(1):85
Respiratory research 2021 Mar 17;22(1):85
HDAC1 modulates OGG1-initiated oxidative DNA damage repair in the aging brain and Alzheimer's disease.
Pao PC, Patnaik D, Watson LA, Gao F, Pan L, Wang J, Adaikkan C, Penney J, Cam HP, Huang WC, Pantano L, Lee A, Nott A, Phan TX, Gjoneska E, Elmsaouri S, Haggarty SJ, Tsai LH
Nature communications 2020 May 18;11(1):2484
Nature communications 2020 May 18;11(1):2484
HDAC1 dysregulation induces aberrant cell cycle and DNA damage in progress of TDP-43 proteinopathies.
Wu CC, Jin LW, Wang IF, Wei WY, Ho PC, Liu YC, Tsai KJ
EMBO molecular medicine 2020 Jun 8;12(6):e10622
EMBO molecular medicine 2020 Jun 8;12(6):e10622
HDAC2 Regulates Site-Specific Acetylation of MDM2 and Its Ubiquitination Signaling in Tumor Suppression.
Patel N, Wang J, Shiozawa K, Jones KB, Zhang Y, Prokop JW, Davenport GG, Nihira NT, Hao Z, Wong D, Brandsmeier L, Meadows SK, Sampaio AV, Werff RV, Endo M, Capecchi MR, McNagny KM, Mak TW, Nielsen TO, Underhill TM, Myers RM, Kondo T, Su L
iScience 2019 Mar 29;13:43-54
iScience 2019 Mar 29;13:43-54
Neuroepigenetic signatures of age and sex in the living human brain.
Gilbert TM, Zürcher NR, Catanese MC, Tseng CJ, Di Biase MA, Lyall AE, Hightower BG, Parmar AJ, Bhanot A, Wu CJ, Hibert ML, Kim M, Mahmood U, Stufflebeam SM, Schroeder FA, Wang C, Roffman JL, Holt DJ, Greve DN, Pasternak O, Kubicki M, Wey HY, Hooker JM
Nature communications 2019 Jul 3;10(1):2945
Nature communications 2019 Jul 3;10(1):2945
The class 3 PI3K coordinates autophagy and mitochondrial lipid catabolism by controlling nuclear receptor PPARα.
Iershov A, Nemazanyy I, Alkhoury C, Girard M, Barth E, Cagnard N, Montagner A, Chretien D, Rugarli EI, Guillou H, Pende M, Panasyuk G
Nature communications 2019 Apr 5;10(1):1566
Nature communications 2019 Apr 5;10(1):1566
Downregulation of PARP1 transcription by CDK4/6 inhibitors sensitizes human lung cancer cells to anticancer drug-induced death by impairing OGG1-dependent base excision repair.
Tempka D, Tokarz P, Chmielewska K, Kluska M, Pietrzak J, Rygielska Ż, Virág L, Robaszkiewicz A
Redox biology 2018 May;15:316-326
Redox biology 2018 May;15:316-326
Effect of pioglitazone on the calcification of rat vascular smooth muscle cells through the downregulation of the Wnt/β‑catenin signaling pathway.
Gao M, Chen T, Wu L, Zhao X, Mao H, Xing C
Molecular medicine reports 2017 Nov;16(5):6208-6213
Molecular medicine reports 2017 Nov;16(5):6208-6213
Class I lysine deacetylases promote glucocorticoid-induced transcriptional repression through functional interaction with LSD1.
Patrick NM, Griggs CA, Icenogle AL, Gilpatrick MM, Kadiyala V, Jaime-Frias R, Smith CL
The Journal of steroid biochemistry and molecular biology 2017 Mar;167:1-13
The Journal of steroid biochemistry and molecular biology 2017 Mar;167:1-13
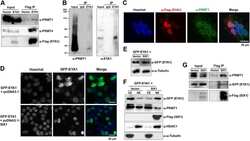
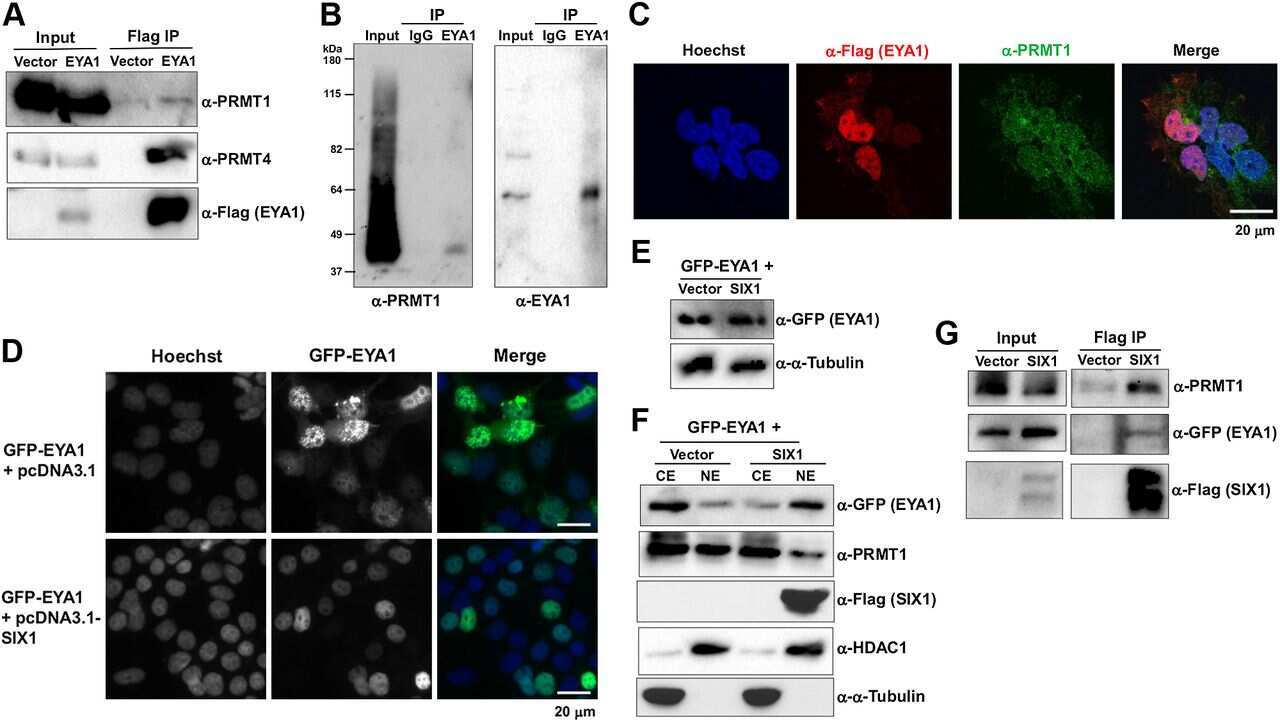
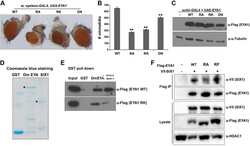
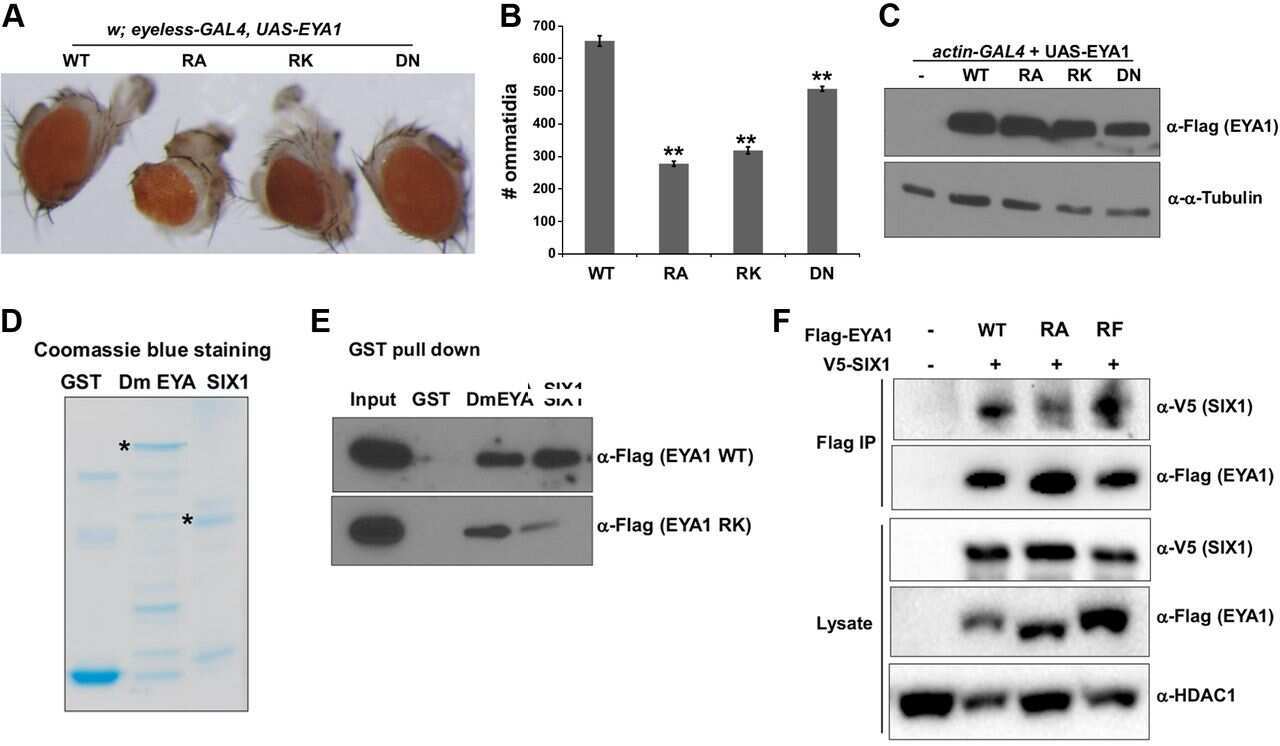
Methylation of the phosphatase-transcription activator EYA1 by protein arginine methyltransferase 1: mechanistic, functional, and structural studies.
Li X, Eberhardt A, Hansen JN, Bohmann D, Li H, Schor NF
FASEB journal : official publication of the Federation of American Societies for Experimental Biology 2017 Jun;31(6):2327-2339
FASEB journal : official publication of the Federation of American Societies for Experimental Biology 2017 Jun;31(6):2327-2339
Loss of Asxl2 leads to myeloid malignancies in mice.
Li J, He F, Zhang P, Chen S, Shi H, Sun Y, Guo Y, Yang H, Man N, Greenblatt S, Li Z, Guo Z, Zhou Y, Wang L, Morey L, Williams S, Chen X, Wang QT, Nimer SD, Yu P, Wang QF, Xu M, Yang FC
Nature communications 2017 Jun 8;8:15456
Nature communications 2017 Jun 8;8:15456
Downregulation of PARP1 transcription by promoter-associated E2F4-RBL2-HDAC1-BRM complex contributes to repression of pluripotency stem cell factors in human monocytes.
Wiśnik E, Płoszaj T, Robaszkiewicz A
Scientific reports 2017 Aug 25;7(1):9483
Scientific reports 2017 Aug 25;7(1):9483
Subcellular Distribution of HDAC1 in Neurotoxic Conditions Is Dependent on Serine Phosphorylation.
Zhu Y, Vidaurre OG, Adula KP, Kezunovic N, Wentling M, Huntley GW, Casaccia P
The Journal of neuroscience : the official journal of the Society for Neuroscience 2017 Aug 2;37(31):7547-7559
The Journal of neuroscience : the official journal of the Society for Neuroscience 2017 Aug 2;37(31):7547-7559
The Selenocysteine-Specific Elongation Factor Contains Unique Sequences That Are Required for Both Nuclear Export and Selenocysteine Incorporation.
Dubey A, Copeland PR
PloS one 2016;11(11):e0165642
PloS one 2016;11(11):e0165642
Lactate's effect on human neuroblastoma cell bioenergetic fluxes.
E L, Swerdlow RH
Biochemical pharmacology 2016 Jan 1;99:88-100
Biochemical pharmacology 2016 Jan 1;99:88-100
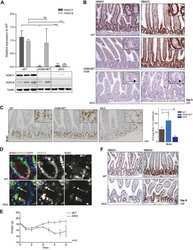
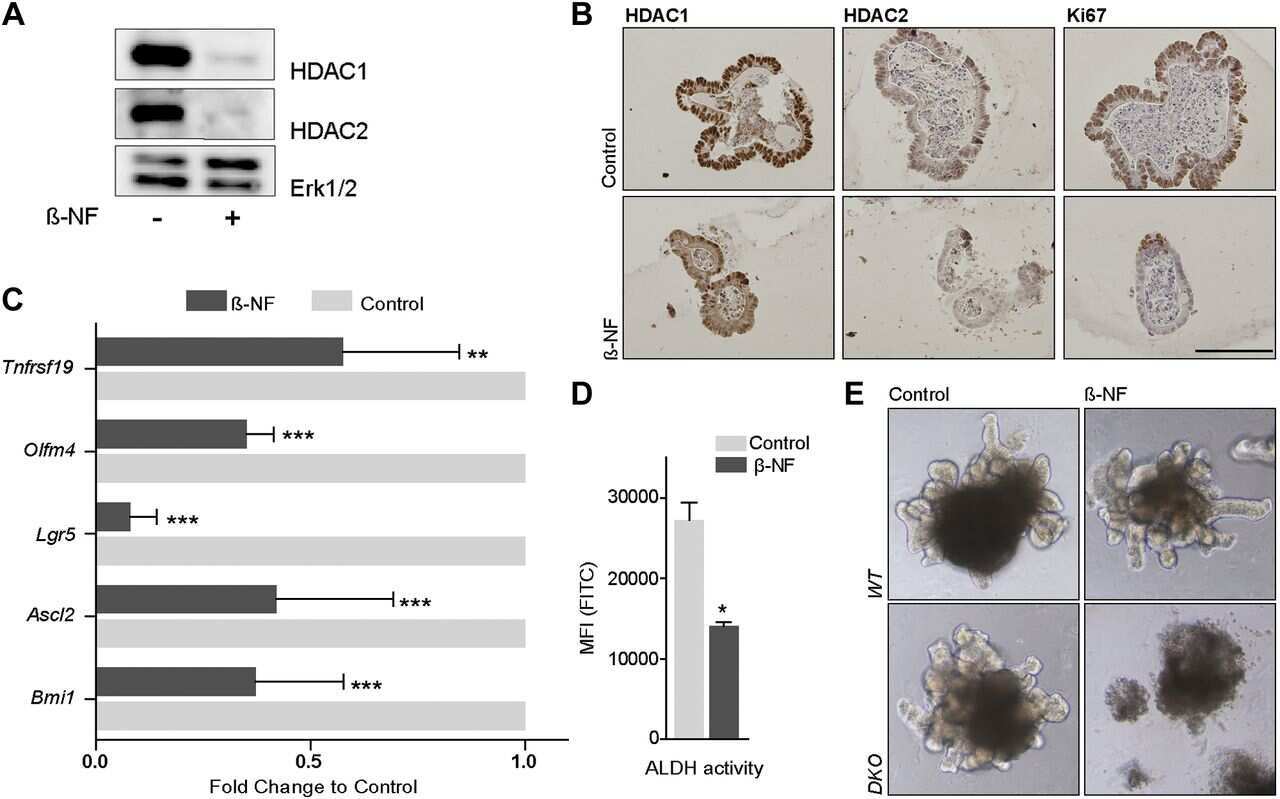
HDAC1 and HDAC2 collectively regulate intestinal stem cell homeostasis.
Zimberlin CD, Lancini C, Sno R, Rosekrans SL, McLean CM, Vlaming H, van den Brink GR, Bots M, Medema JP, Dannenberg JH
FASEB journal : official publication of the Federation of American Societies for Experimental Biology 2015 May;29(5):2070-80
FASEB journal : official publication of the Federation of American Societies for Experimental Biology 2015 May;29(5):2070-80
Combined HDAC1 and HDAC2 Depletion Promotes Retinal Ganglion Cell Survival After Injury Through Reduction of p53 Target Gene Expression.
Lebrun-Julien F, Suter U
ASN neuro 2015 May-Jun;7(3)
ASN neuro 2015 May-Jun;7(3)
Effect of high-intensity exercise on aged mouse brain mitochondria, neurogenesis, and inflammation.
E L, Burns JM, Swerdlow RH
Neurobiology of aging 2014 Nov;35(11):2574-2583
Neurobiology of aging 2014 Nov;35(11):2574-2583
Identification of myelin transcription factor 1 (MyT1) as a subunit of the neural cell type-specific lysine-specific demethylase 1 (LSD1) complex.
Yokoyama A, Igarashi K, Sato T, Takagi K, Otsuka I M, Shishido Y, Baba T, Ito R, Kanno J, Ohkawa Y, Morohashi K, Sugawara A
The Journal of biological chemistry 2014 Jun 27;289(26):18152-62
The Journal of biological chemistry 2014 Jun 27;289(26):18152-62
Overlapping chromatin-remodeling systems collaborate genome wide at dynamic chromatin transitions.
Morris SA, Baek S, Sung MH, John S, Wiench M, Johnson TA, Schiltz RL, Hager GL
Nature structural & molecular biology 2014 Jan;21(1):73-81
Nature structural & molecular biology 2014 Jan;21(1):73-81
RNA-dependent dynamic histone acetylation regulates MCL1 alternative splicing.
Khan DH, Gonzalez C, Cooper C, Sun JM, Chen HY, Healy S, Xu W, Smith KT, Workman JL, Leygue E, Davie JR
Nucleic acids research 2014 Feb;42(3):1656-70
Nucleic acids research 2014 Feb;42(3):1656-70
Unfolded protein response signaling by transcription factor XBP-1 regulates ADAM10 and is affected in Alzheimer's disease.
Reinhardt S, Schuck F, Grösgen S, Riemenschneider M, Hartmann T, Postina R, Grimm M, Endres K
FASEB journal : official publication of the Federation of American Societies for Experimental Biology 2014 Feb;28(2):978-97
FASEB journal : official publication of the Federation of American Societies for Experimental Biology 2014 Feb;28(2):978-97
Specificity in circadian clock feedback from targeted reconstitution of the NuRD corepressor.
Kim JY, Kwak PB, Weitz CJ
Molecular cell 2014 Dec 18;56(6):738-48
Molecular cell 2014 Dec 18;56(6):738-48
HDAC1 and HDAC2 control the specification of neural crest cells into peripheral glia.
Jacob C, Lötscher P, Engler S, Baggiolini A, Varum Tavares S, Brügger V, John N, Büchmann-Møller S, Snider PL, Conway SJ, Yamaguchi T, Matthias P, Sommer L, Mantei N, Suter U
The Journal of neuroscience : the official journal of the Society for Neuroscience 2014 Apr 23;34(17):6112-22
The Journal of neuroscience : the official journal of the Society for Neuroscience 2014 Apr 23;34(17):6112-22
Lactate administration reproduces specific brain and liver exercise-related changes.
E L, Lu J, Selfridge JE, Burns JM, Swerdlow RH
Journal of neurochemistry 2013 Oct;127(1):91-100
Journal of neurochemistry 2013 Oct;127(1):91-100
Proteomic and functional analyses reveal the role of chromatin reader SFMBT1 in regulating epigenetic silencing and the myogenic gene program.
Lin S, Shen H, Li JL, Tang S, Gu Y, Chen Z, Hu C, Rice JC, Lu J, Wu L
The Journal of biological chemistry 2013 Mar 1;288(9):6238-47
The Journal of biological chemistry 2013 Mar 1;288(9):6238-47
Protein kinase CK2 regulates the dimerization of histone deacetylase 1 (HDAC1) and HDAC2 during mitosis.
Khan DH, He S, Yu J, Winter S, Cao W, Seiser C, Davie JR
The Journal of biological chemistry 2013 Jun 7;288(23):16518-16528
The Journal of biological chemistry 2013 Jun 7;288(23):16518-16528
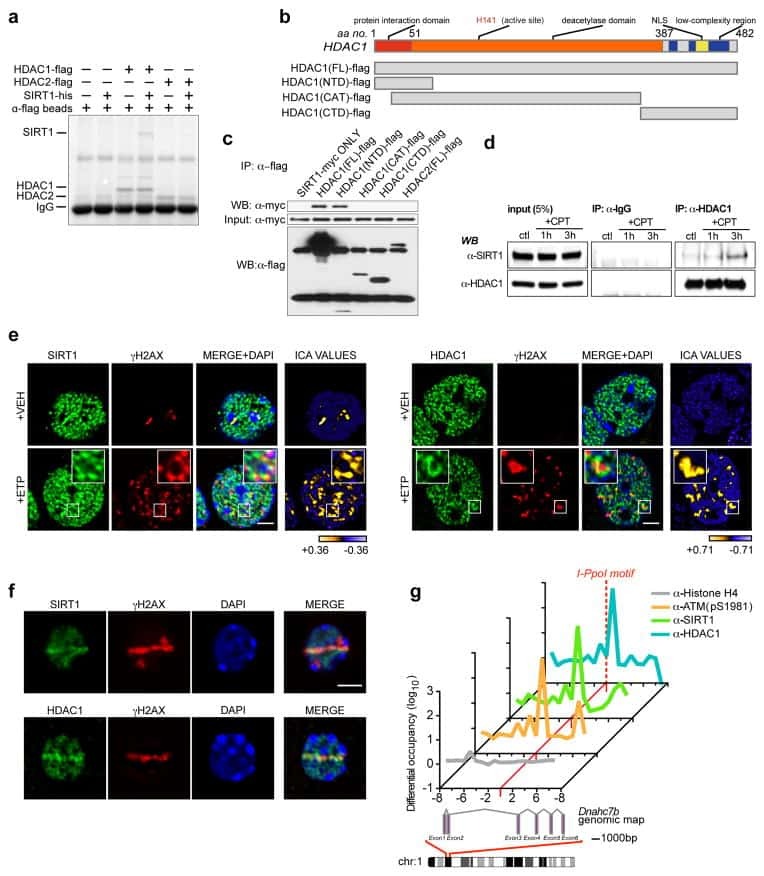
SIRT1 collaborates with ATM and HDAC1 to maintain genomic stability in neurons.
Dobbin MM, Madabhushi R, Pan L, Chen Y, Kim D, Gao J, Ahanonu B, Pao PC, Qiu Y, Zhao Y, Tsai LH
Nature neuroscience 2013 Aug;16(8):1008-15
Nature neuroscience 2013 Aug;16(8):1008-15
Differential modulation of the oligodendrocyte transcriptome by sonic hedgehog and bone morphogenetic protein 4 via opposing effects on histone acetylation.
Wu M, Hernandez M, Shen S, Sabo JK, Kelkar D, Wang J, O'Leary R, Phillips GR, Cate HS, Casaccia P
The Journal of neuroscience : the official journal of the Society for Neuroscience 2012 May 9;32(19):6651-64
The Journal of neuroscience : the official journal of the Society for Neuroscience 2012 May 9;32(19):6651-64
Chromatin modifications induced by the AML1-ETO fusion protein reversibly silence its genomic targets through AML1 and Sp1 binding motifs.
Maiques-Diaz A, Chou FS, Wunderlich M, Gómez-López G, Jacinto FV, Rodriguez-Perales S, Larrayoz MJ, Calasanz MJ, Mulloy JC, Cigudosa JC, Alvarez S
Leukemia 2012 Jun;26(6):1329-37
Leukemia 2012 Jun;26(6):1329-37
Differential response of cancer cells to HDAC inhibitors trichostatin A and depsipeptide.
Chang J, Varghese DS, Gillam MC, Peyton M, Modi B, Schiltz RL, Girard L, Martinez ED
British journal of cancer 2012 Jan 3;106(1):116-25
British journal of cancer 2012 Jan 3;106(1):116-25
Altered LKB1/CREB-regulated transcription co-activator (CRTC) signaling axis promotes esophageal cancer cell migration and invasion.
Gu Y, Lin S, Li JL, Nakagawa H, Chen Z, Jin B, Tian L, Ucar DA, Shen H, Lu J, Hochwald SN, Kaye FJ, Wu L
Oncogene 2012 Jan 26;31(4):469-79
Oncogene 2012 Jan 26;31(4):469-79
Stress-induced epigenetic transcriptional memory of acetylcholinesterase by HDAC4.
Sailaja BS, Cohen-Carmon D, Zimmerman G, Soreq H, Meshorer E
Proceedings of the National Academy of Sciences of the United States of America 2012 Dec 26;109(52):E3687-95
Proceedings of the National Academy of Sciences of the United States of America 2012 Dec 26;109(52):E3687-95
Identification of four potential epigenetic modulators from the NCI structural diversity library using a cell-based assay.
Best AM, Chang J, Dull AB, Beutler JA, Martinez ED
Journal of biomedicine & biotechnology 2011;2011:868095
Journal of biomedicine & biotechnology 2011;2011:868095
Histone Deacetylase Inhibitors and Mithramycin A Impact a Similar Neuroprotective Pathway at a Crossroad between Cancer and Neurodegeneration.
Sleiman SF, Berlin J, Basso M, Karuppagounder SS, Rohr J, Ratan RR
Pharmaceuticals (Basel, Switzerland) 2011 Aug 22;4(8):1183-1195
Pharmaceuticals (Basel, Switzerland) 2011 Aug 22;4(8):1183-1195
Identification of a gene regulatory network necessary for the initiation of oligodendrocyte differentiation.
Swiss VA, Nguyen T, Dugas J, Ibrahim A, Barres B, Androulakis IP, Casaccia P
PloS one 2011 Apr 7;6(4):e18088
PloS one 2011 Apr 7;6(4):e18088
Selective association of peroxiredoxin 1 with genomic DNA and COX-2 upstream promoter elements in estrogen receptor negative breast cancer cells.
Wang X, He S, Sun JM, Delcuve GP, Davie JR
Molecular biology of the cell 2010 Sep 1;21(17):2987-95
Molecular biology of the cell 2010 Sep 1;21(17):2987-95
EGF regulates survivin stability through the Raf-1/ERK pathway in insulin-secreting pancreatic β-cells.
Wang H, Gambosova K, Cooper ZA, Holloway MP, Kassai A, Izquierdo D, Cleveland K, Boney CM, Altura RA
BMC molecular biology 2010 Aug 31;11:66
BMC molecular biology 2010 Aug 31;11:66
Ageing-related chromatin defects through loss of the NURD complex.
Pegoraro G, Kubben N, Wickert U, Göhler H, Hoffmann K, Misteli T
Nature cell biology 2009 Oct;11(10):1261-7
Nature cell biology 2009 Oct;11(10):1261-7
Expression and regulation of vitamin D3 upregulated protein 1 (VDUP1) is conserved in mammalian and insect brain.
Levendusky MC, Basle J, Chang S, Mandalaywala NV, Voigt JM, Dearborn RE Jr
The Journal of comparative neurology 2009 Dec 10;517(5):581-600
The Journal of comparative neurology 2009 Dec 10;517(5):581-600
Age-dependent epigenetic control of differentiation inhibitors is critical for remyelination efficiency.
Shen S, Sandoval J, Swiss VA, Li J, Dupree J, Franklin RJ, Casaccia-Bonnefil P
Nature neuroscience 2008 Sep;11(9):1024-34
Nature neuroscience 2008 Sep;11(9):1024-34
Retrograde GABA signaling adjusts sound localization by balancing excitation and inhibition in the brainstem.
Magnusson AK, Park TJ, Pecka M, Grothe B, Koch U
Neuron 2008 Jul 10;59(1):125-37
Neuron 2008 Jul 10;59(1):125-37
Differential intranuclear organization of transcription factors Sp1 and Sp3.
He S, Sun JM, Li L, Davie JR
Molecular biology of the cell 2005 Sep;16(9):4073-83
Molecular biology of the cell 2005 Sep;16(9):4073-83
Transcriptional repression of peroxisome proliferator-activated receptor beta/delta in murine keratinocytes by CCAAT/enhancer-binding proteins.
Di-Poï N, Desvergne B, Michalik L, Wahli W
The Journal of biological chemistry 2005 Nov 18;280(46):38700-10
The Journal of biological chemistry 2005 Nov 18;280(46):38700-10
Histone modifications affect timing of oligodendrocyte progenitor differentiation in the developing rat brain.
Shen S, Li J, Casaccia-Bonnefil P
The Journal of cell biology 2005 May 23;169(4):577-89
The Journal of cell biology 2005 May 23;169(4):577-89
Nucleolar localization of hepatic c-Myc: a potential mechanism for c-Myc regulation.
Sanders JA, Gruppuso PA
Biochimica et biophysica acta 2005 Mar 22;1743(1-2):141-50
Biochimica et biophysica acta 2005 Mar 22;1743(1-2):141-50
Gfi1 coordinates epigenetic repression of p21Cip/WAF1 by recruitment of histone lysine methyltransferase G9a and histone deacetylase 1.
Duan Z, Zarebski A, Montoya-Durango D, Grimes HL, Horwitz M
Molecular and cellular biology 2005 Dec;25(23):10338-51
Molecular and cellular biology 2005 Dec;25(23):10338-51
Isolation and characterization of a novel DNA methyltransferase complex linking DNMT3B with components of the mitotic chromosome condensation machinery.
Geiman TM, Sankpal UT, Robertson AK, Chen Y, Mazumdar M, Heale JT, Schmiesing JA, Kim W, Yokomori K, Zhao Y, Robertson KD
Nucleic acids research 2004;32(9):2716-29
Nucleic acids research 2004;32(9):2716-29
Modification of de novo DNA methyltransferase 3a (Dnmt3a) by SUMO-1 modulates its interaction with histone deacetylases (HDACs) and its capacity to repress transcription.
Ling Y, Sankpal UT, Robertson AK, McNally JG, Karpova T, Robertson KD
Nucleic acids research 2004;32(2):598-610
Nucleic acids research 2004;32(2):598-610
Tax relieves transcriptional repression by promoting histone deacetylase 1 release from the human T-cell leukemia virus type 1 long terminal repeat.
Lu H, Pise-Masison CA, Linton R, Park HU, Schiltz RL, Sartorelli V, Brady JN
Journal of virology 2004 Jul;78(13):6735-43
Journal of virology 2004 Jul;78(13):6735-43
Atrophin 2 recruits histone deacetylase and is required for the function of multiple signaling centers during mouse embryogenesis.
Zoltewicz JS, Stewart NJ, Leung R, Peterson AS
Development (Cambridge, England) 2004 Jan;131(1):3-14
Development (Cambridge, England) 2004 Jan;131(1):3-14
Mitogen- and stress-activated protein kinase 1 activity and histone h3 phosphorylation in oncogene-transformed mouse fibroblasts.
Drobic B, Espino PS, Davie JR
Cancer research 2004 Dec 15;64(24):9076-9
Cancer research 2004 Dec 15;64(24):9076-9
Identification of a novel family of ankyrin repeats containing cofactors for p160 nuclear receptor coactivators.
Zhang A, Yeung PL, Li CW, Tsai SC, Dinh GK, Wu X, Li H, Chen JD
The Journal of biological chemistry 2004 Aug 6;279(32):33799-805
The Journal of biological chemistry 2004 Aug 6;279(32):33799-805
The transcriptional repressor Sp3 is associated with CK2-phosphorylated histone deacetylase 2.
Sun JM, Chen HY, Moniwa M, Litchfield DW, Seto E, Davie JR
The Journal of biological chemistry 2002 Sep 27;277(39):35783-6
The Journal of biological chemistry 2002 Sep 27;277(39):35783-6
Retinoblastoma protein transcriptional repression through histone deacetylation of a single nucleosome.
Morrison AJ, Sardet C, Herrera RE
Molecular and cellular biology 2002 Feb;22(3):856-65
Molecular and cellular biology 2002 Feb;22(3):856-65
Retinoblastoma protein transcriptional repression through histone deacetylation of a single nucleosome.
Morrison AJ, Sardet C, Herrera RE
Molecular and cellular biology 2002 Feb;22(3):856-65
Molecular and cellular biology 2002 Feb;22(3):856-65
Pf1, a novel PHD zinc finger protein that links the TLE corepressor to the mSin3A-histone deacetylase complex.
Yochum GS, Ayer DE
Molecular and cellular biology 2001 Jul;21(13):4110-8
Molecular and cellular biology 2001 Jul;21(13):4110-8
Effect of estradiol on histone acetylation dynamics in human breast cancer cells.
Sun JM, Chen HY, Davie JR
The Journal of biological chemistry 2001 Dec 28;276(52):49435-42
The Journal of biological chemistry 2001 Dec 28;276(52):49435-42
A role for histone deacetylase activity in HDAC1-mediated transcriptional repression.
Hassig CA, Tong JK, Fleischer TC, Owa T, Grable PG, Ayer DE, Schreiber SL
Proceedings of the National Academy of Sciences of the United States of America 1998 Mar 31;95(7):3519-24
Proceedings of the National Academy of Sciences of the United States of America 1998 Mar 31;95(7):3519-24
A mammalian histone deacetylase related to the yeast transcriptional regulator Rpd3p.
Taunton J, Hassig CA, Schreiber SL
Science (New York, N.Y.) 1996 Apr 19;272(5260):408-11
Science (New York, N.Y.) 1996 Apr 19;272(5260):408-11
No comments: Submit comment
Supportive validation
- Submitted by
- Invitrogen Antibodies (provider)
- Main image
- Experimental details
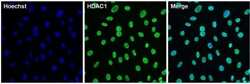
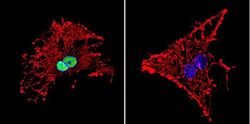
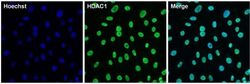
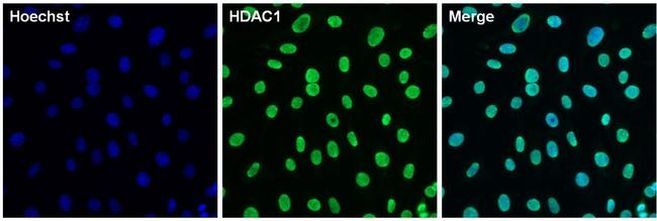
- Immunofluorescent analysis of HDAC1 (green) in 3T3 cells. The cells were permeabilized with 0.1% Triton X-100 in TBS for 15 minutes, and blocked with 3% BSA in PBS (Product # 37525) for 15 minutes at room temperature. Cells were stained with a HDAC1 rabbit polyclonal antibody (Product # PA1-860), at a concentration of 10 µg/mL in blocking buffer for at least 1 hour at room temperature, and then incubated with a Goat anti-rabbit IgG Superclonal secondary antibody, Alexa Fluor 488 conjugate (Product # A27034) at a dilution of 1:1000 for 30 minutes at room temperature (green). Nuclei (blue) were stained with Hoechst 33342 dye (Product # 62249). Images were taken on a Thermo Scientific ToxInsight Instrument at 20X magnification.
- Submitted by
- Invitrogen Antibodies (provider)
- Main image

- Experimental details
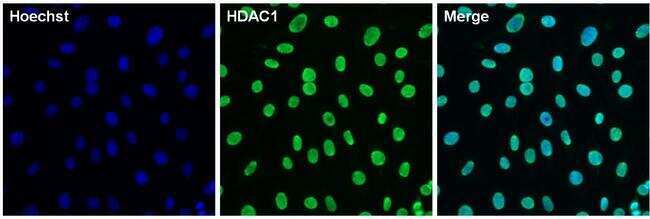
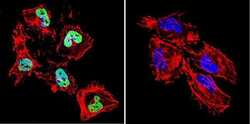
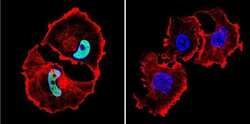
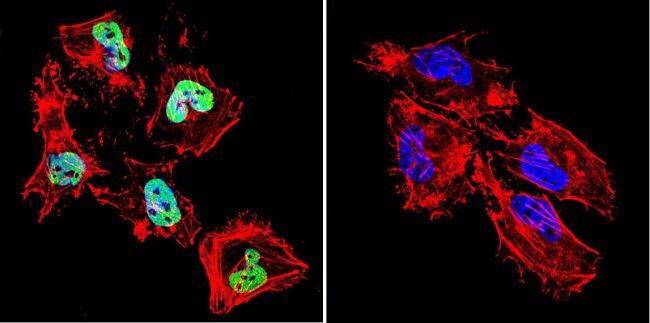
- Immunofluorescent analysis of HDAC1 in C6 Cells. Cells were grown on chamber slides and fixed with formaldehyde prior to staining. Cells were probed without (control) or with a HDAC1 polyclonal antibody (Product # PA1-860) at a dilution of 1:20 overnight at 4 C, washed with PBS and incubated with a DyLight-488 conjugated secondary antibody (Product # 35552). HDAC1 staining (green), F-Actin staining with Phalloidin (red) and nuclei with DAPI (blue) is shown. Images were taken at 60X magnification.

- Submitted by
- Invitrogen Antibodies (provider)
- Main image
- Experimental details
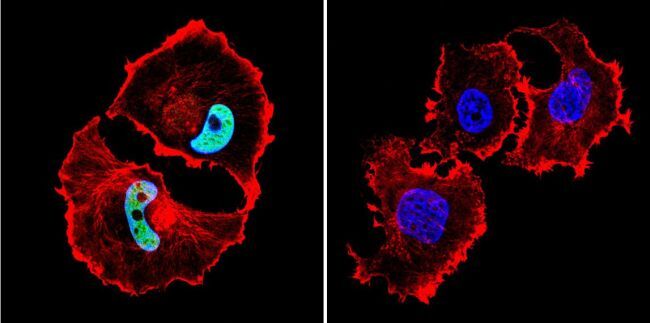
- Immunofluorescent analysis of HDAC1 in HeLa Cells. Cells were grown on chamber slides and fixed with formaldehyde prior to staining. Cells were probed without (control) or with a HDAC1 polyclonal antibody (Product # PA1-860) at a dilution of 1:20 overnight at 4 C, washed with PBS and incubated with a DyLight-488 conjugated secondary antibody (Product # 35552). HDAC1 staining (green), F-Actin staining with Phalloidin (red) and nuclei with DAPI (blue) is shown. Images were taken at 60X magnification.

- Submitted by
- Invitrogen Antibodies (provider)
- Main image
- Experimental details
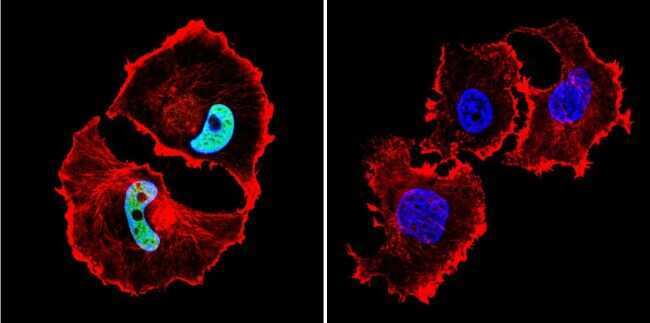
- Immunofluorescent analysis of HDAC1 in MCF-7 Cells. Cells were grown on chamber slides and fixed with formaldehyde prior to staining. Cells were probed without (control) or with a HDAC1 polyclonal antibody (Product # PA1-860) at a dilution of 1:100 overnight at 4 C, washed with PBS and incubated with a DyLight-488 conjugated secondary antibody (Product # 35552). HDAC1 staining (green), F-Actin staining with Phalloidin (red) and nuclei with DAPI (blue) is shown. Images were taken at 60X magnification.
- Submitted by
- Invitrogen Antibodies (provider)
- Main image

- Experimental details
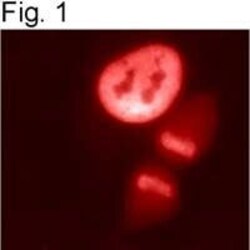
- Immunolocalization of HDAC1 in HeLa cells using Product # PA1-860.

- Submitted by
- Invitrogen Antibodies (provider)
- Main image
- Experimental details
- Immunolocalization of HDAC1 in HeLa cells using Product # PA1-860.

- Submitted by
- Invitrogen Antibodies (provider)
- Main image
- Experimental details
- Immunofluorescent analysis of HDAC1 in C6 Cells. Cells were grown on chamber slides and fixed with formaldehyde prior to staining. Cells were probed without (control) or with a HDAC1 polyclonal antibody (Product # PA1-860) at a dilution of 1:20 overnight at 4 C, washed with PBS and incubated with a DyLight-488 conjugated secondary antibody (Product # 35552). HDAC1 staining (green), F-Actin staining with Phalloidin (red) and nuclei with DAPI (blue) is shown. Images were taken at 60X magnification.

- Submitted by
- Invitrogen Antibodies (provider)
- Main image

- Experimental details
- Immunofluorescent analysis of HDAC1 in HeLa Cells. Cells were grown on chamber slides and fixed with formaldehyde prior to staining. Cells were probed without (control) or with a HDAC1 polyclonal antibody (Product # PA1-860) at a dilution of 1:20 overnight at 4 C, washed with PBS and incubated with a DyLight-488 conjugated secondary antibody (Product # 35552). HDAC1 staining (green), F-Actin staining with Phalloidin (red) and nuclei with DAPI (blue) is shown. Images were taken at 60X magnification.
- Submitted by
- Invitrogen Antibodies (provider)
- Main image

- Experimental details
- Immunofluorescent analysis of HDAC1 in MCF-7 Cells. Cells were grown on chamber slides and fixed with formaldehyde prior to staining. Cells were probed without (control) or with a HDAC1 polyclonal antibody (Product # PA1-860) at a dilution of 1:100 overnight at 4 C, washed with PBS and incubated with a DyLight-488 conjugated secondary antibody (Product # 35552). HDAC1 staining (green), F-Actin staining with Phalloidin (red) and nuclei with DAPI (blue) is shown. Images were taken at 60X magnification.
- Submitted by
- Invitrogen Antibodies (provider)
- Main image
- Experimental details
- Immunofluorescent analysis of HDAC1 (green) in 3T3 cells. The cells were permeabilized with 0.1% Triton X-100 in TBS for 15 minutes, and blocked with 3% BSA in PBS (Product # 37525) for 15 minutes at room temperature. Cells were stained with a HDAC1 rabbit polyclonal antibody (Product # PA1-860), at a concentration of 10 µg/mL in blocking buffer for at least 1 hour at room temperature, and then incubated with a Goat anti-rabbit IgG Superclonal secondary antibody, Alexa Fluor 488 conjugate (Product # A27034) at a dilution of 1:1000 for 30 minutes at room temperature (green). Nuclei (blue) were stained with Hoechst 33342 dye (Product # 62249). Images were taken on a Thermo Scientific ToxInsight Instrument at 20X magnification.
Supportive validation
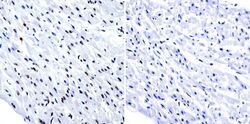
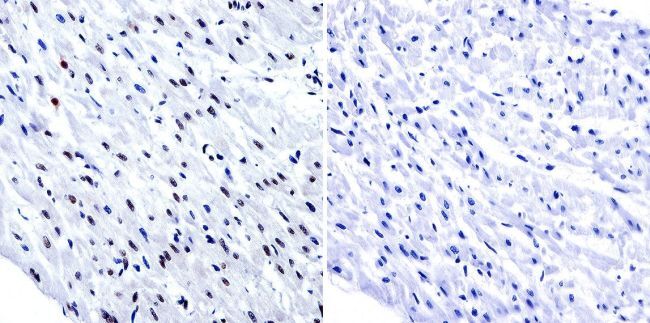
- Submitted by
- Invitrogen Antibodies (provider)
- Main image
- Experimental details
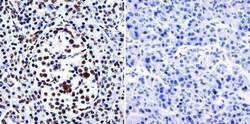
- Immunohistochemistry was performed on normal biopsies of deparaffinized human heart tissue. To expose target proteins, heat induced antigen retrieval was performed using 10mM sodium citrate (pH6.0) buffer, microwaved for 8-15 minutes. Following antigen retrieval tissues were blocked in 3% BSA-PBS for 30 minutes at room temperature. Tissues were then probed at a dilution of 1:200 with a Rabbit Polyclonal Antibody recognizing HDAC1 (Product # PA1-860) or without primary antibody (negative control) overnight at 4°C in a humidified chamber. Tissues were washed extensively with PBST and endogenous peroxidase activity was quenched with a peroxidase suppressor. Detection was performed using a biotin-conjugated secondary antibody and SA-HRP, followed by colorimetric detection using DAB. Tissues were counterstained with hematoxylin and prepped for mounting.
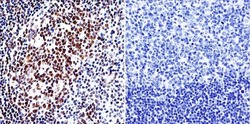
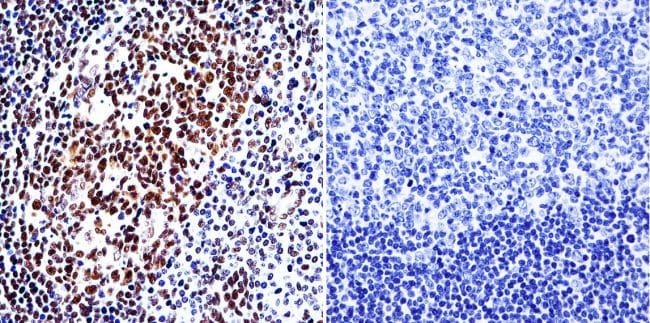
- Submitted by
- Invitrogen Antibodies (provider)
- Main image
- Experimental details
- Immunohistochemistry was performed on normal biopsies of deparaffinized human tonsil tissue. To expose target proteins, heat induced antigen retrieval was performed using 10mM sodium citrate (pH6.0) buffer, microwaved for 8-15 minutes. Following antigen retrieval tissues were blocked in 3% BSA-PBS for 30 minutes at room temperature. Tissues were then probed at a dilution of 1:200 with a Rabbit Polyclonal Antibody recognizing HDAC1 (Product # PA1-860) or without primary antibody (negative control) overnight at 4°C in a humidified chamber. Tissues were washed extensively with PBST and endogenous peroxidase activity was quenched with a peroxidase suppressor. Detection was performed using a biotin-conjugated secondary antibody and SA-HRP, followed by colorimetric detection using DAB. Tissues were counterstained with hematoxylin and prepped for mounting.
- Submitted by
- Invitrogen Antibodies (provider)
- Main image
- Experimental details
- Immunohistochemistry was performed on normal biopsies of deparaffinized human pancreas tissue. To expose target proteins, heat induced antigen retrieval was performed using 10mM sodium citrate (pH6.0) buffer, microwaved for 8-15 minutes. Following antigen retrieval tissues were blocked in 3% BSA-PBS for 30 minutes at room temperature. Tissues were then probed at a dilution of 1:200 with a Rabbit Polyclonal Antibody recognizing HDAC1 (Product # PA1-860) or without primary antibody (negative control) overnight at 4°C in a humidified chamber. Tissues were washed extensively with PBST and endogenous peroxidase activity was quenched with a peroxidase suppressor. Detection was performed using a biotin-conjugated secondary antibody and SA-HRP, followed by colorimetric detection using DAB. Tissues were counterstained with hematoxylin and prepped for mounting.

Supportive validation
- Submitted by
- Invitrogen Antibodies (provider)
- Main image
- Experimental details
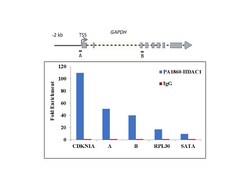
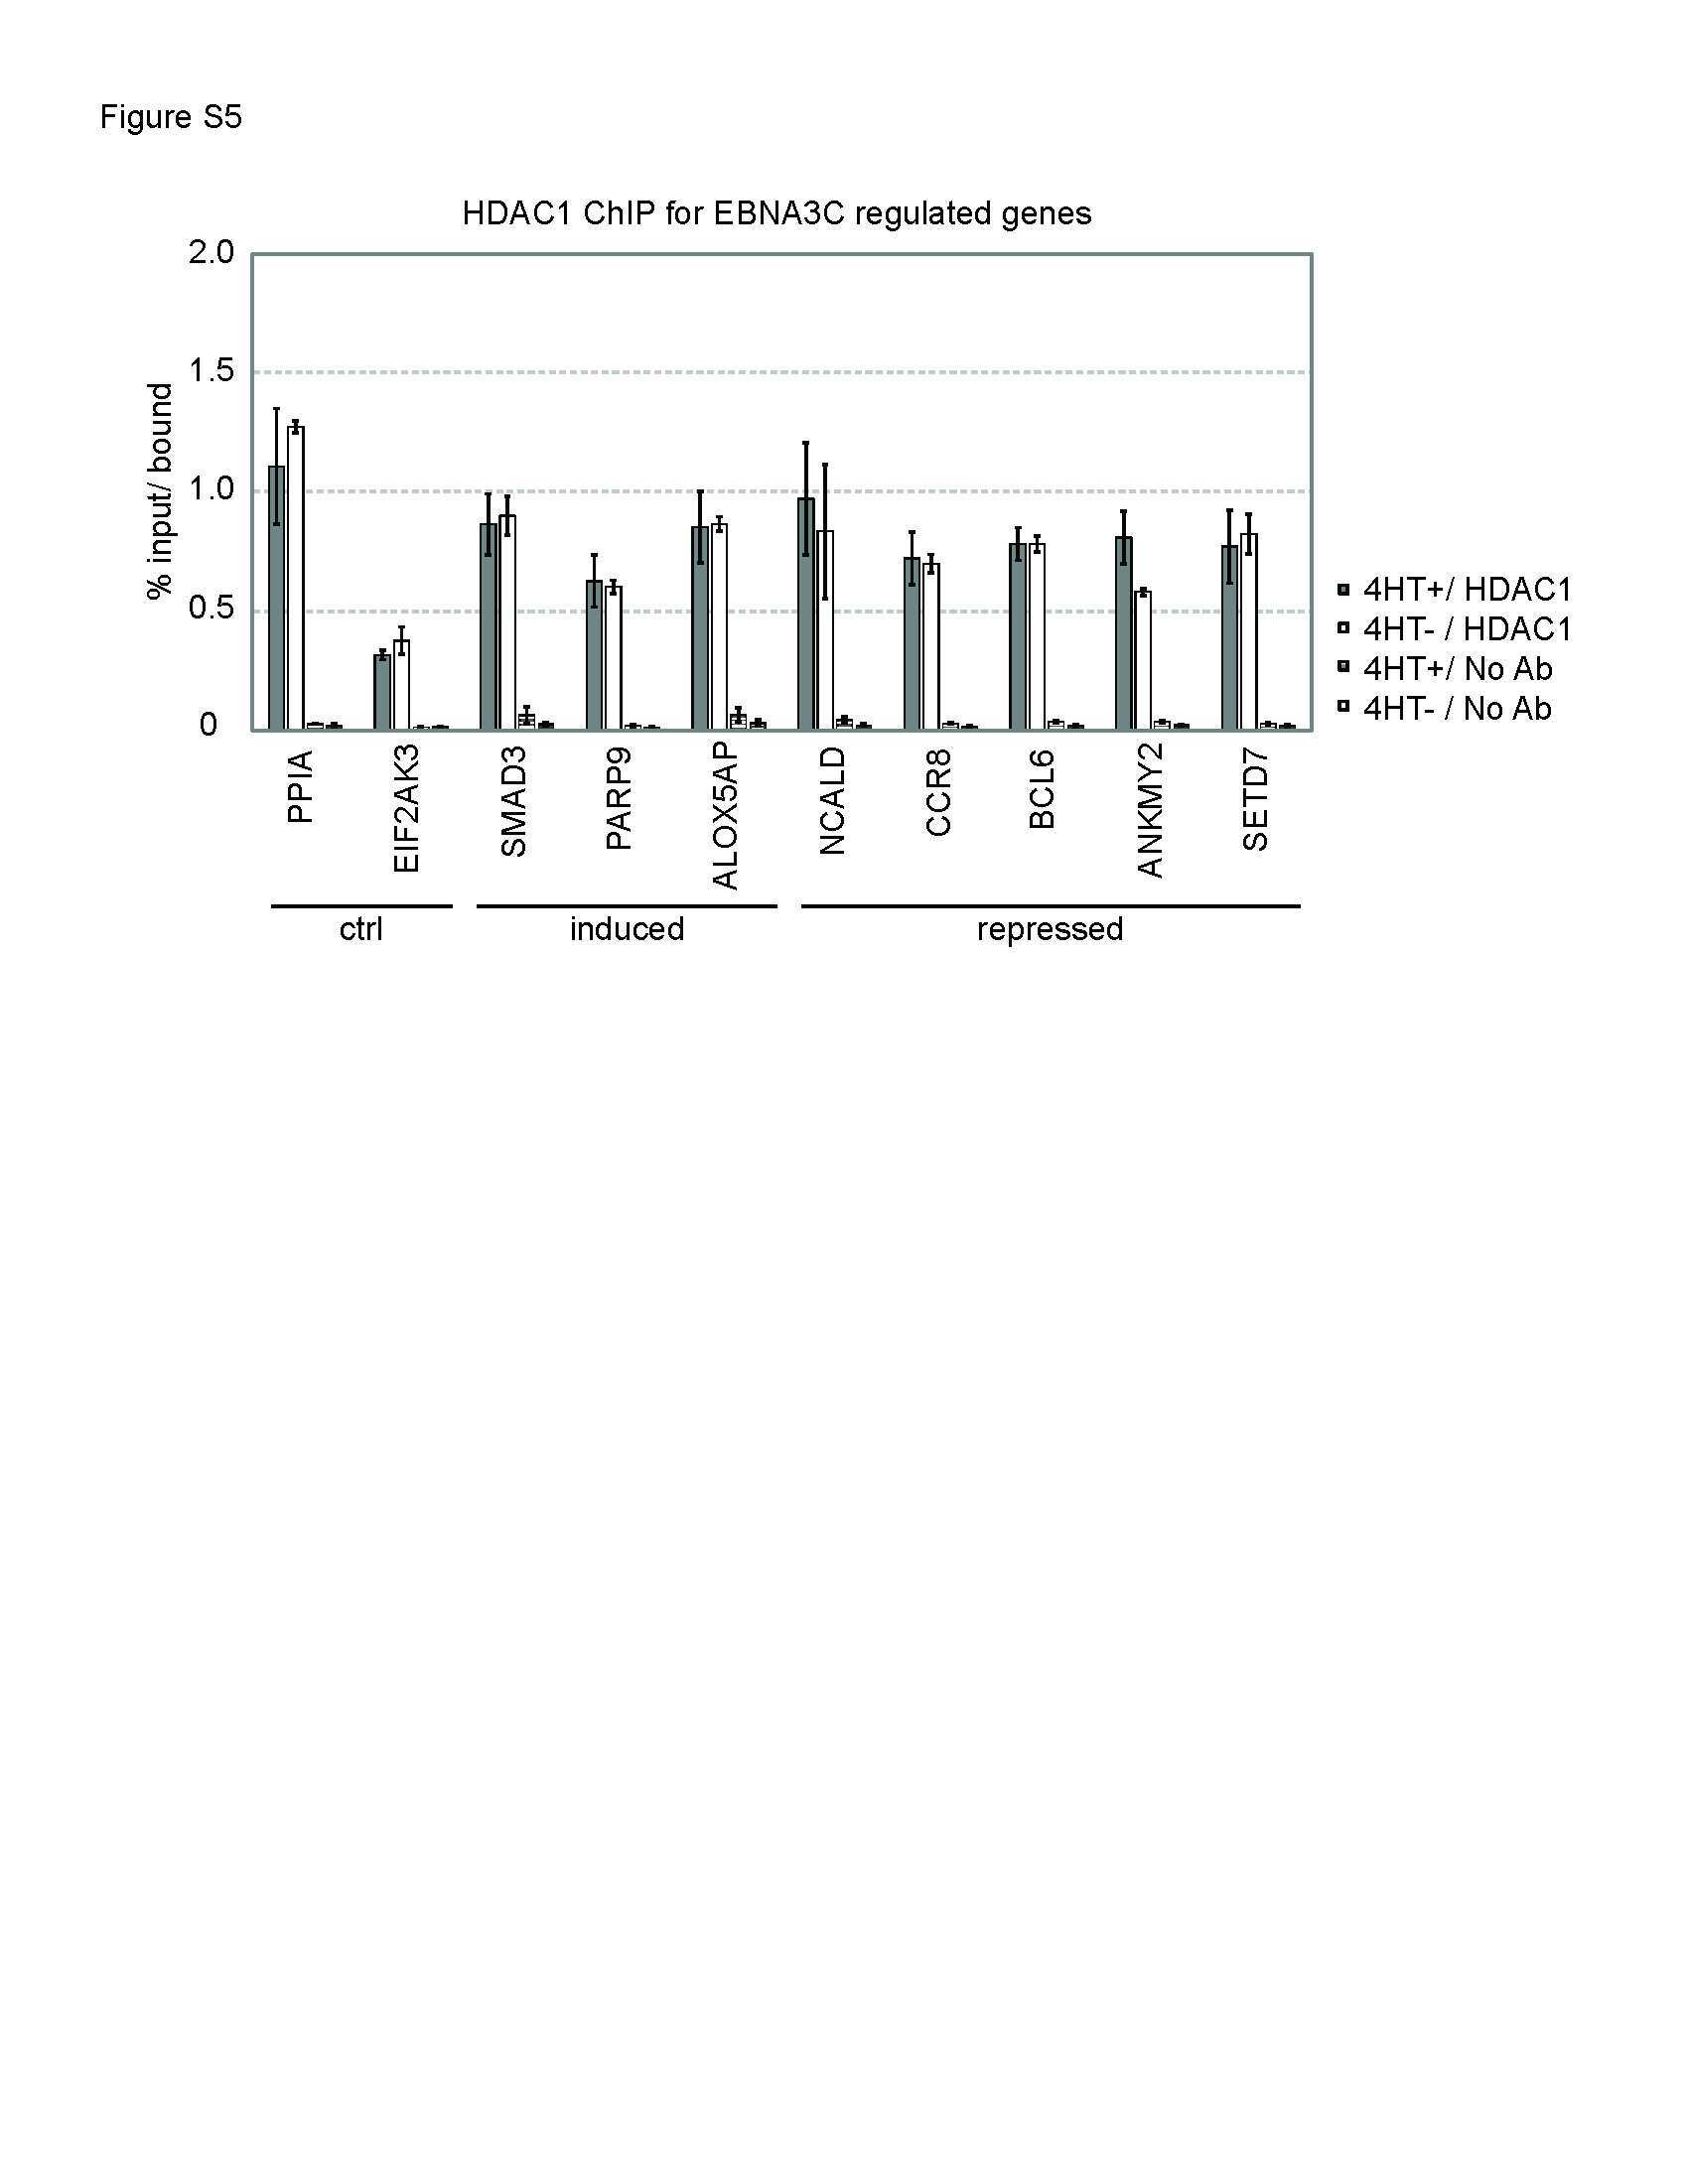
- Chromatin Immunoprecipitation (ChIP) assay of endogenous HDAC1 protein using Anti-HDAC1 Antibody: ChIP was performed using Anti-HDAC1 Rabbit Polyclonal Antibody (Product # PA1-860, 5 µg) on sheared chromatin from HeLa cells using the MAGnify ChIP System kit (Product # 49-2024). Normal Rabbit IgG was used as a negative IP control. The purified DNA was analyzed by qPCR using primers binding to CDKN1A Intron 1, transcriptional start site and gene body (+2kb) of GAPDH, RPL30 exon 5 and SATA satellite repeats. Data is presented as fold enrichment of the antibody signal versus the negative control IgG using the comparative CT method.

- Submitted by
- Invitrogen Antibodies (provider)
- Main image

- Experimental details
- Chromatin Immunoprecipitation (ChIP) assay of endogenous HDAC1 protein using Anti-HDAC1 Antibody: ChIP was performed using Anti-HDAC1 Rabbit Polyclonal Antibody (Product # PA1-860, 5 µg) on sheared chromatin from HeLa cells using the MAGnify ChIP System kit (Product # 49-2024). Normal Rabbit IgG was used as a negative IP control. The purified DNA was analyzed by qPCR using primers binding to CDKN1A Intron 1, transcriptional start site and gene body (+2kb) of GAPDH, RPL30 exon 5 and SATA satellite repeats. Data is presented as fold enrichment of the antibody signal versus the negative control IgG using the comparative CT method.

Supportive validation
- Submitted by
- Invitrogen Antibodies (provider)
- Main image
- Experimental details
- NULL
- Submitted by
- Invitrogen Antibodies (provider)
- Main image
- Experimental details
- NULL
- Submitted by
- Invitrogen Antibodies (provider)
- Main image

- Experimental details
- NULL
- Submitted by
- Invitrogen Antibodies (provider)
- Main image
- Experimental details
- NULL
- Submitted by
- Invitrogen Antibodies (provider)
- Main image
- Experimental details
- NULL
- Submitted by
- Invitrogen Antibodies (provider)
- Main image

- Experimental details
- NULL
- Submitted by
- Invitrogen Antibodies (provider)
- Main image
- Experimental details
- NULL
- Submitted by
- Invitrogen Antibodies (provider)
- Main image
- Experimental details
- NULL
- Submitted by
- Invitrogen Antibodies (provider)
- Main image
- Experimental details
- NULL
- Submitted by
- Invitrogen Antibodies (provider)
- Main image
- Experimental details
- NULL
- Submitted by
- Invitrogen Antibodies (provider)
- Main image
- Experimental details
- NULL
- Submitted by
- Invitrogen Antibodies (provider)
- Main image
- Experimental details
- NULL
- Submitted by
- Invitrogen Antibodies (provider)
- Main image

- Experimental details
- NULL
- Submitted by
- Invitrogen Antibodies (provider)
- Main image
- Experimental details
- NULL
- Submitted by
- Invitrogen Antibodies (provider)
- Main image
- Experimental details
- NULL

- Submitted by
- Invitrogen Antibodies (provider)
- Main image
- Experimental details
- NULL
- Submitted by
- Invitrogen Antibodies (provider)
- Main image

- Experimental details
- NULL
- Submitted by
- Invitrogen Antibodies (provider)
- Main image
- Experimental details
- NULL
- Submitted by
- Invitrogen Antibodies (provider)
- Main image

- Experimental details
- NULL
- Submitted by
- Invitrogen Antibodies (provider)
- Main image
- Experimental details
- NULL
- Submitted by
- Invitrogen Antibodies (provider)
- Main image
- Experimental details
- NULL
- Submitted by
- Invitrogen Antibodies (provider)
- Main image
- Experimental details
- NULL
- Submitted by
- Invitrogen Antibodies (provider)
- Main image
- Experimental details
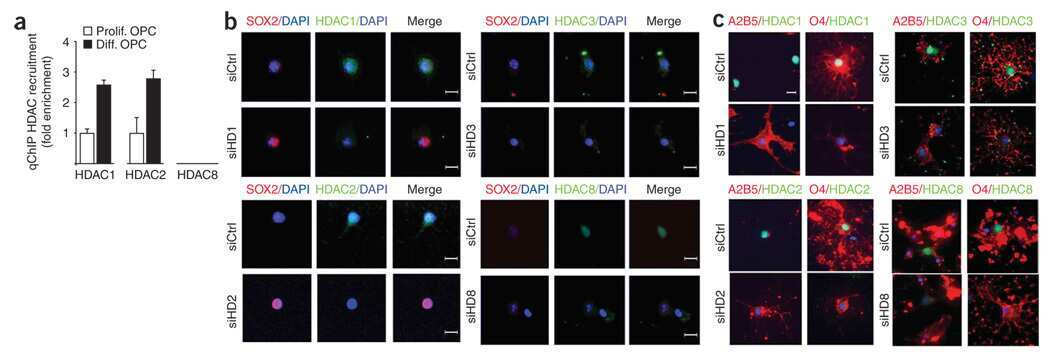
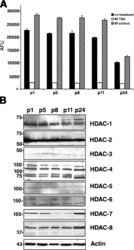
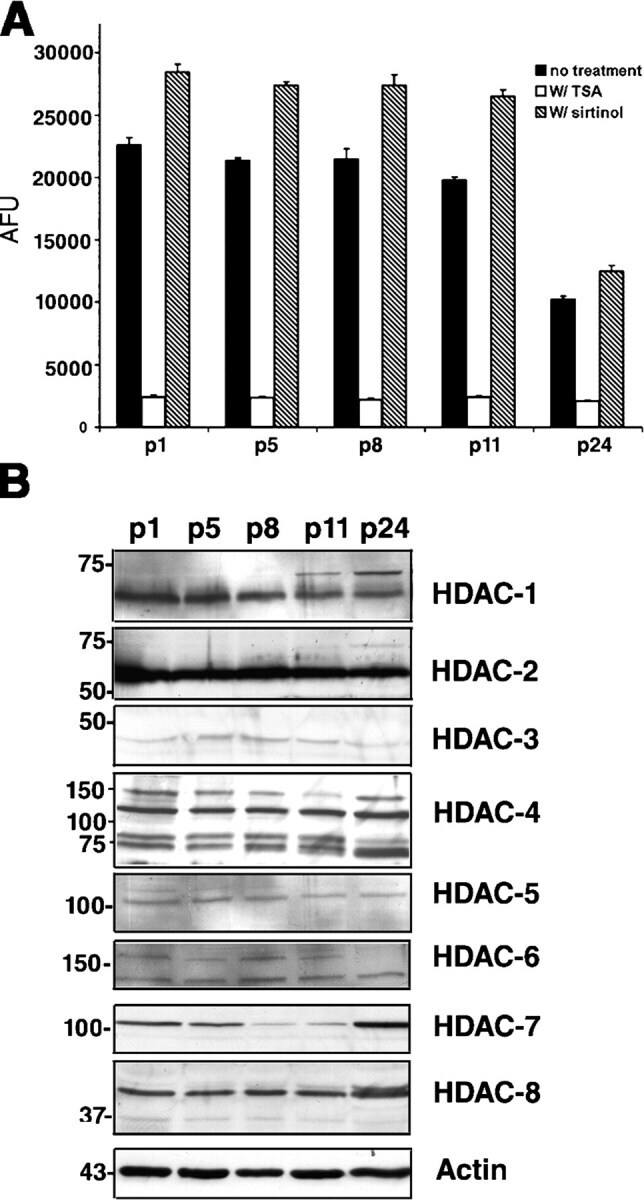
- Figure 3. Total HDAC activity in extracts of the developing rostral corpus callosum. (A) Total HDAC activity was measured in protein extracts from anterior corpus callosum at p1, p5, p8, p11, and p24 using an acetylated fluorimetric substrate (black bars). The experiments were then repeated by incubating the same samples with TSA (white bars), or with sirtinol (hatched bars). (B) The protein levels of distinct HDAC isoforms were assessed by Western blot analysis on the same tissue extracts. Blots were probed with antibodies against class I (HDAC-1, -2, -3, and -8) and class II (HDAC-4, -5, -6, and -7), and actin as loading control.
- Submitted by
- Invitrogen Antibodies (provider)
- Main image
- Experimental details
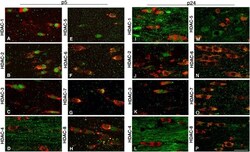
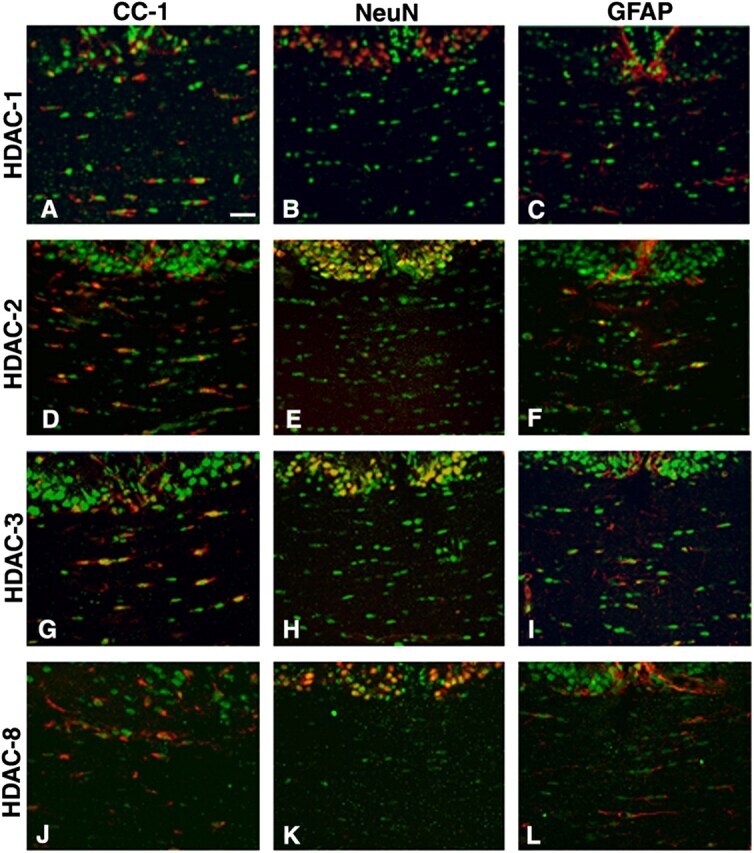
- Figure 4. Cellular and temporal profile of expression of class I and II HDACs in maturing OLs. Confocal images of the medial part of the body of the corpus callosum at rostral levels, identified in coronal brain sections from p5 (A-H) and p24 (I-P) neonatal rats, after staining with antibodies for HDAC-1 to -8 (A-P, green) and for CC1 (A-P, red). Bar, 20 mum. 63x objective, LSM510 confocal microscope (Carl Zeiss MicroImaging, Inc.).
- Submitted by
- Invitrogen Antibodies (provider)
- Main image
- Experimental details
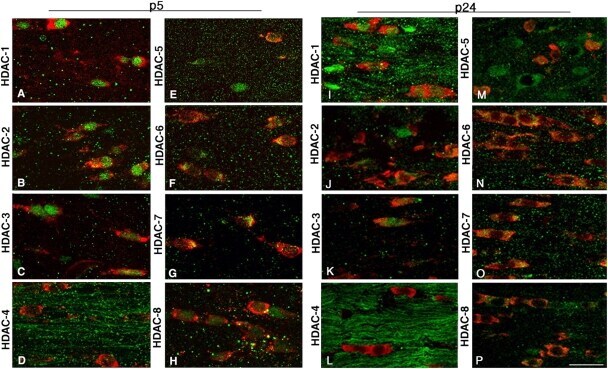
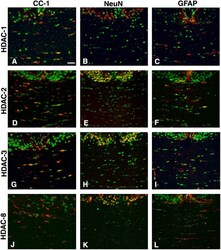
- Figure 5. Cell specificity of class I HDAC expression during the first postnatal week of development. Immunohistochemistry of coronal brain sections from p5 rat pups stained with antibodies against HDAC-1, -2, -3, and -8 (A-L, green), CC1 (A, D, G, and J, red), NeuN (B, E, H, and K, red), and GFAP (C, F, I, and L, red). Bar, 20 mum. 25x objective, DM RA (Leica). Each immunostaining was performed at least three times from three distinct p5 rat brains.
- Submitted by
- Invitrogen Antibodies (provider)
- Main image
- Experimental details
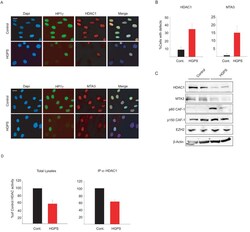
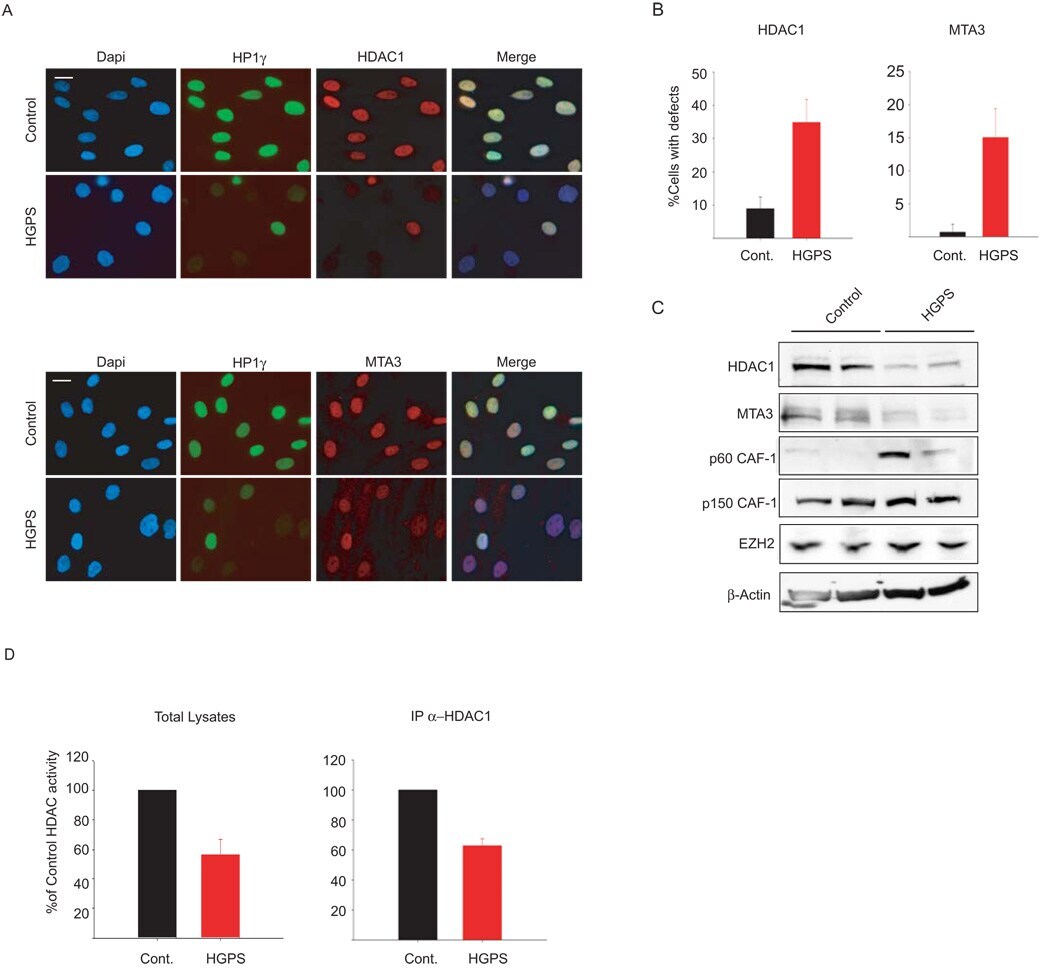
- Fig. 3 Loss of NURD subunits in HGPS cells (A) Immunofluorescence staining of control and HGPS primary dermal fibroblasts with the indicated antibodies. (B) Quantitative analysis of the fluorescence intensity signal in control and HGPS cells. N>200; Values represent averages +- S.D. from three experiments. (C) Western blot with the indicated antibodies on total cell lysates prepared from dermal fibroblast from two unaffected individuals and two HGPS patients. (D) HDAC activity measured in total lysates or in HDAC1 immunoprecipitates prepared from primary fibroblasts. Values represent averages +- S.D. from three experiments. Scale bar: 10 um.
- Submitted by
- Invitrogen Antibodies (provider)
- Main image

- Experimental details
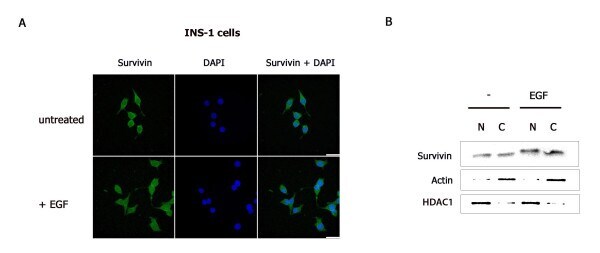
- Figure 2 EGF enhances nuclear and cytoplasmic survivin protein levels . INS-1 cells were serum-deprived overnight then treated with or without EGF for 4 hours. (A) Cells were fixed and immunostained with a survivin antibody, stained with DAPI (DNA detection) then analyzed by Z-stack confocal microscopy. (B) Nuclear and cytoplasmic protein fractions were prepared, resolved by SDS-PAGE then transferred to PVDF membranes and immunoblotted with anti-survivin, anti-actin, and anti-HDAC1.
- Submitted by
- Invitrogen Antibodies (provider)
- Main image

- Experimental details
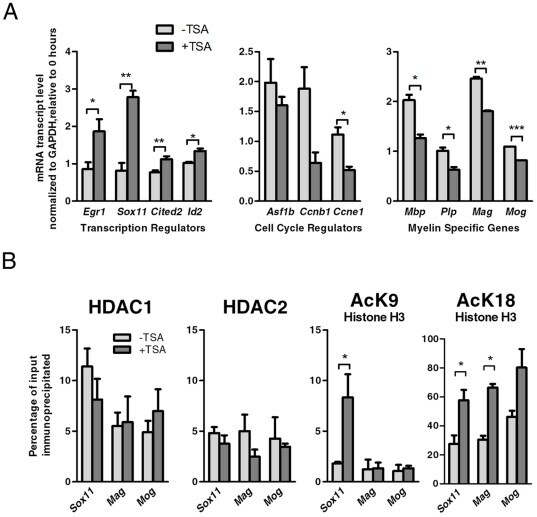
- Figure 4 HDAC activity directly regulates the expression of Sox11. A. Quantitative RT-PCR was performed to validate changes of transcript levels for transcriptional regulators, cell cycle regulators and myelin specific genes in OPCs either untreated or treated with TSA for one day. The data reflect the results of qPCR results performed in duplicate from 2-4 independent biological replicates (* p
- Submitted by
- Invitrogen Antibodies (provider)
- Main image
- Experimental details
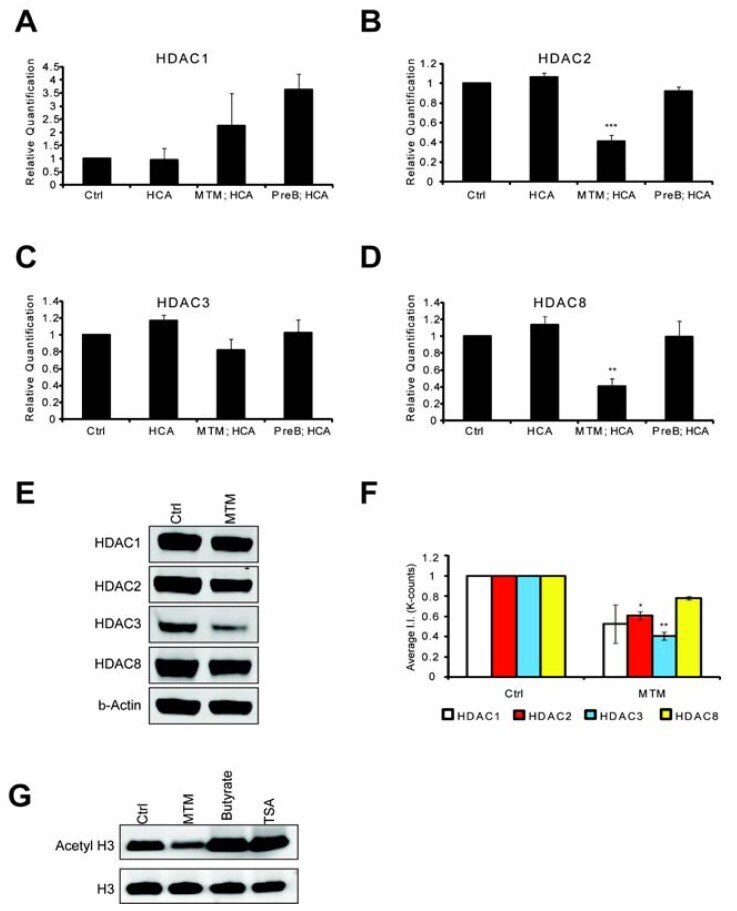
- Figure 3 MTM affects class 1 HDAC expression levels. Real time RTPCR shows that MTM (300 nM) does not significantly affect HDAC1 ( A ) and HDAC3 ( C ) expression levels; whereas it significantly reduces HDAC2 ( B ) and HDAC8 ( D ) expression levels. These changes covary with neuroprotection by MTM as the non-protective analog PreB (300 nM) has no effect on the expression of these genes. Cells were treated for five hours and the experiments were repeated three times. ( E ): Western Blots show that MTM treatment reduces the protein levels of class 1 HDACs. ( F ): Quantification of three different western blots reveals that only HDAC2 and HDAC3 protein levels are significantly affected by MTM treatment. ( G ): Unlike sodium butyrate (5 mM) and TSA (0.66 muM), MTM does not induce acetylation of histone H3. For the western blot experiments, cells were treated with the compounds for 48 hours and experiments were repeated three times. Statistical analysis was conducted by 1way ANOVA followed by the Dunnett post test. Significant levels compared to control treatment alone. *: p < 0.05 and **: p < 0.01 and ***: p < 0.0001.
- Submitted by
- Invitrogen Antibodies (provider)
- Main image
- Experimental details
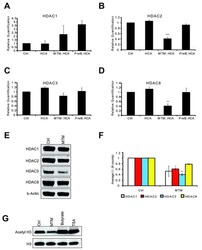
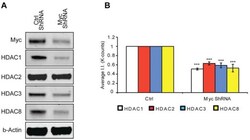
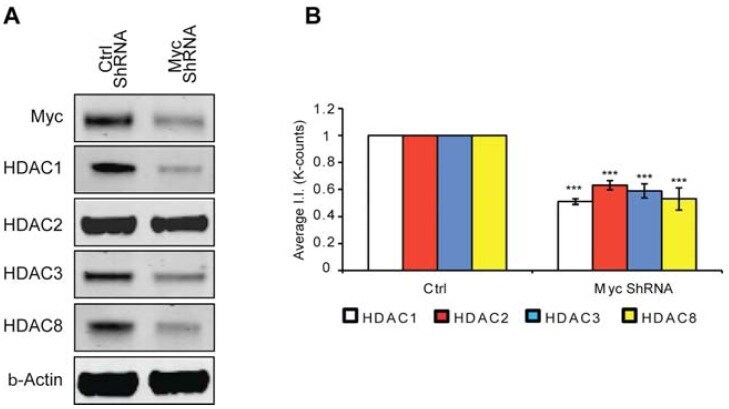
- Figure 4 MTM affects class 1 HDAC expression levels. ( A ) Western blot analysis reveals that Myc knockdown using ShRNA significantly affects class I HDAC protein levels. ( B ) Quantification of Western blots. Statistical analysis was conducted by 1way ANOVA followed by the Dunnett post test. Significant levels compared to control shRNA alone. * p < 0.05; and ** p < 0.01; and *** p < 0.0001.
- Submitted by
- Invitrogen Antibodies (provider)
- Main image
- Experimental details
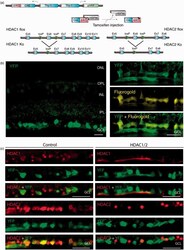
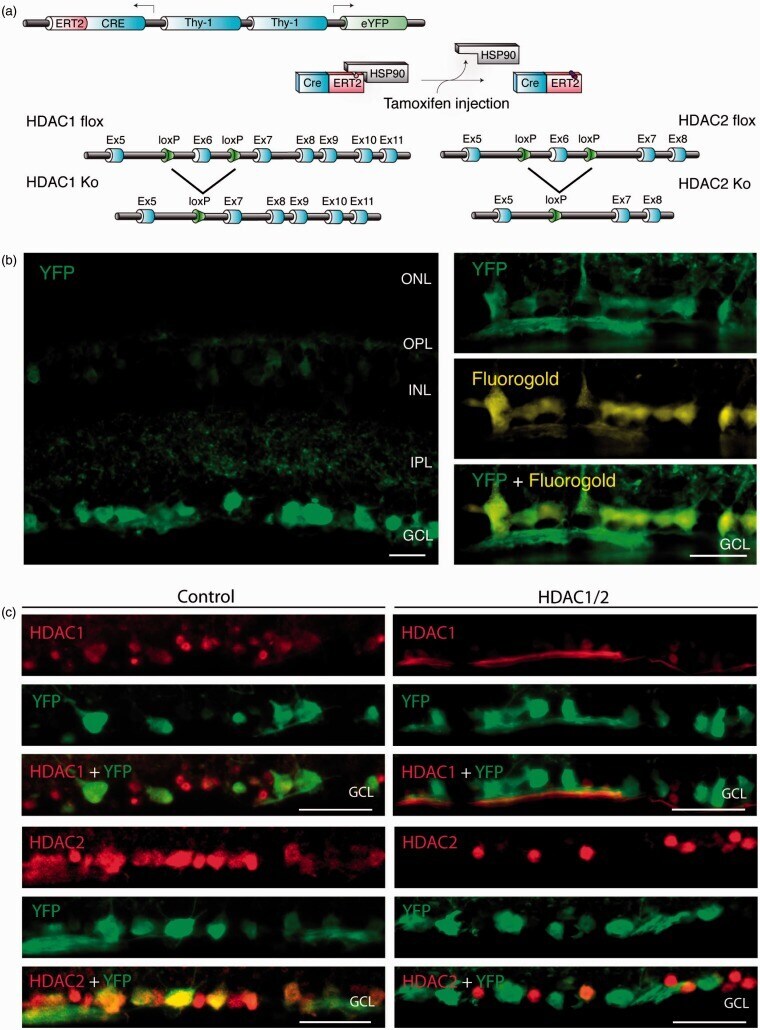
- Figure 1. Conditional ablation of HDAC1 and HDAC2 in retinal ganglion cells. (a) The SLICK-H transgenic mouse line uses the Thy-1 gene regulatory elements to drive coexpression of YFP and a tamoxifen-activatable Cre fusion protein. Schematic map of Hdac1 and Hdac2 alleles depicts the location of loxP sequences. Upon Cre-mediated recombination after tamoxifen injection, the genomic region located between the loxP sites is excised, thereby inactivating the conditional Hdac1 and Hdac2 alleles. (b) Transverse section of the retina of transgenic mice without tamoxifen injections shows expression of YFP (green) in different retinal layers. ONL = outer nuclear layer; OPL = outer plexiform layer; INL = inner nuclear layer; IPL = inner plexiform layer; GCL = ganglion cell layer. All retrogradely Fluorogold-labeled retinal ganglion cells (yellow) colocalize with YFP (green; right panel). Scale bar: 20 um (c) Retinal immunofluororescence analysis demonstrates loss of HDAC1/2 in the YFP-expressing cells of the retinal ganglion cell layer after tamoxifen injection in conditional knockout mice. Scale bar: 20 um.
- Submitted by
- Invitrogen Antibodies (provider)
- Main image
- Experimental details
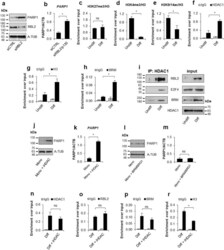
- Figure 3 Quiescent state of differentiated cells entails the assembly of RBL2-E2F4-HDAC1-BRM repressor complex at PARP1 promoter and the HDAC1-BRM induced chromatin compaction. The effect of RBL2 silencing on PARP1 expression was determined with western blot ( a ) and real-time PCR ( b ) in human blood-derived monocytes 72 h after cell transient transfection with siRNA. Transcription regulating epigenetic marks ( c , d , e ) as well as HDAC1 ( f ), histone H3 density ( g ) and BRM ( h ) at PARP1 promoter were analyzed with ChIP. The interaction among repressive complex components was confirmed with immunoprecypitation ( i ) by pulling down HDAC1 and detection of co-immunoprecipitated proteins with western blot. In order to verify the contribution of HDACs ( j , k ) and BRM ( l , m ) in PARP1 repression blood-derived monocytes were incubated with the corresponding inhibitors (iHDAC - sodium butyrate - 0.5 mM and iBRM/iBRG1 - PFI-3 - 1 uM) for 24 h. PARP1 expression was monitored at the protein level with western blot ( j , l )), while PARP1 mRNA was determined with real-time PCR ( k , m ). The effect of iHDAC on HDAC1, RBL2 and BRM association with chromatin ( n , o , p ) and the chromatin compaction (H3 density) in differentiated cells was assayed with ChIP ( r ).

- Submitted by
- Invitrogen Antibodies (provider)
- Main image

- Experimental details
- Figure 4 PRC2 facilitates PARP1 silencing by associating with RB1-E2F1-HDAC1-BRM/BRG1 repressor complex in G1 arrested cells. Epigenetic modifications ( a , b and d ), recruitment of HDAC1 ( c ), EZH2 ( e ), BRM ( g ), BRG1 ( h ) to PARP1 promoter and the density of histone H3 ( f ) were compared by ChIP between proliferating cells and cells arrested in G1 phase by their treatment with mimosine (Mim, 200 muM) for 48 h. Composition of PARP1 repressive complex in G1-arrested cells was determined by pulling down HDAC1 and followed by WB detection of RB1, E2F1, EZH2, BRM and BRG1 ( j ). The expression of PARP1 in HSPC supplemented with mimosine (50 u) and additionally with 5 mM iHDAC, 125 nM iEZH2 and the mixture of 5 mM iHDAC and 125 nM and iEZH2 for 24 h was analyzed with western blot ( k ) and real-time PCR ( l ). Expression of PARP1 in G1-arrested cells treated with BRM/BRG1 inhibitor (iBRM/iBRG1 - PFI-3 - 1 muM) was determined with real-time PCR ( n ). Changes in epigenetic marks and in protein composition in PARP1 promoter upon THP-1 cells treatment with iHDAC/iEZH2/Mim versus Mim alone were monitored with ChIP ( n - t ).
- Submitted by
- Invitrogen Antibodies (provider)
- Main image
- Experimental details
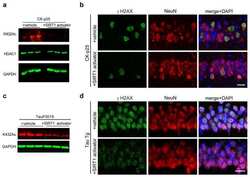
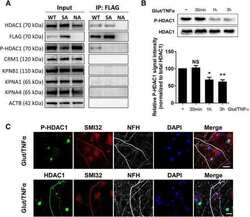
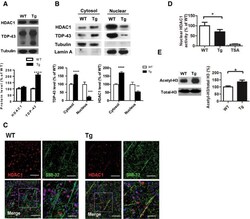
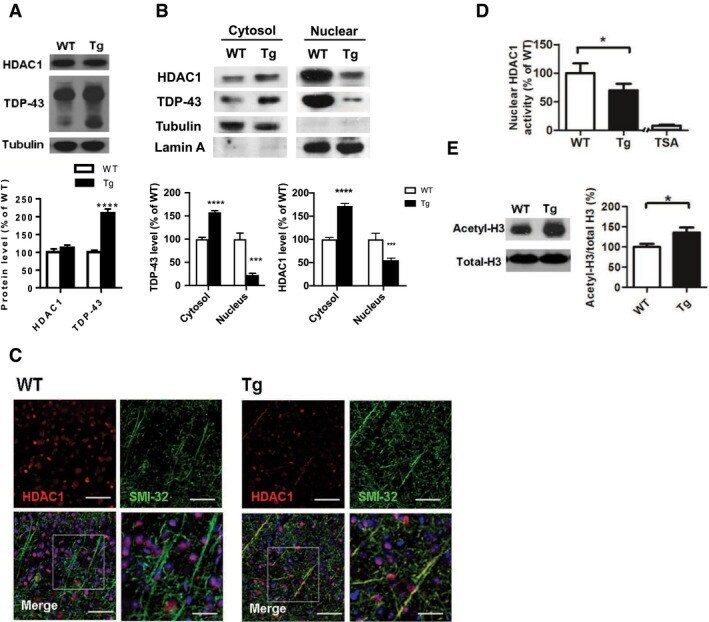
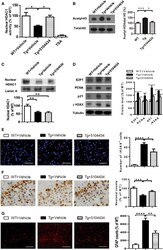
- Figure 3 HDAC1 dysregulation in FTLD-TDP Tg mice A Top, representative Western blot data of HDAC1 and TDP-43 in extracts obtained following RIPA fractional extraction in the frontal cortices and hippocampus from 6 months old of FTLD-TDP or WT mice. Bottom, semi-quantification of HDAC1 and TDP-43 expression levels. N = 5 mice per group, data are presented as mean +- SEM (%), **** P < 0.0001 by multiple t -tests. B Top, representative Western blot data of HDAC1 and TDP-43 in the cytosolic and nuclear extracts. Bottom, quantification of HDAC1 and TDP-43 levels. N = 5 mice per group, data are presented as mean +- SEM (%), *** P = 0.0005 (TDP-43) or 0.0004 (HDAC1); **** P < 0.0001 by multiple t -tests. C IF staining of HDAC1 and SMI-32 in the regions of frontal cortices from WT and FTLD-TDP Tg mice. Scale bar: 150 mum. Blocked area in left bottom picture is showed in a magnified view in the right bottom picture. Scale bar: 50 mum. D Nuclear HDAC1 activity assay from frontal cortices and hippocampus in 6 months old of FTLD-TDP and WT mice. TSA: nuclear extracts that were treated with Trichostatin A (TSA, an HDAC inhibitor) as a negative control for HDAC1-transferred fluorescent activity during the HDAC1 activity assay. N = 5 mice per group, data are presented as mean +- SEM (%), * P = 0.0415 by t -test. E Left, representative Western blot data of nuclear acetylated-histone H3 (Lys 9/14) and total histone H3 in 6 months old of WT and FTLD-TDP Tg mice. Right, quantification of nuclea
- Submitted by
- Invitrogen Antibodies (provider)
- Main image

- Experimental details
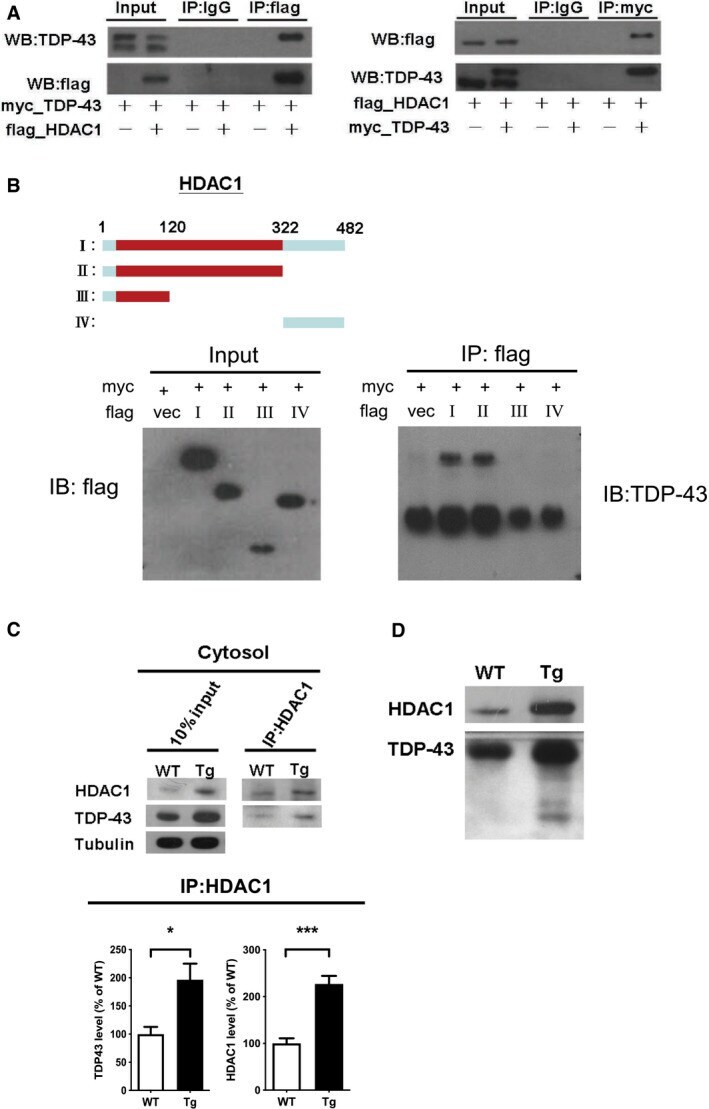
- Figure 5 TDP-43 interacts with HDAC1 and traps HDAC1 in inclusion bodies A Left panel: Flag-tagged full-length HDAC1 was overexpressed with myc-tagged TDP-43 in HEK-293T cells; the cell lysates were immunoprecipitated for flag and immunoblotted for TDP-43 and flag. Right panel: myc-tagged TDP-43 was overexpressed with flag-tagged full-length HDAC1 in HEK-293T cells; the cell lysates were immunoprecipitated for myc and immunoblotted for flag and TDP-43. B Upper left: Flag-tagged full-length HDAC1 (b.I) or various truncation mutations (b.II-IV) were overexpressed with myc-tagged TDP-43; the catalytic domain is indicated in red. Lower panel: the Western blotting of cell lysates immunoprecipitated for flag and immunoblotted for TDP-43. C Upper panel: Immunoprecipitation of cytosolic HDAC1 and immunoblotting of HDAC1 and TDP-43 in WT and FTLD-TDP Tg mice. Lower histogram: Quantification of immunoprecipitation results of HDAC1 and TDP-43 in WT and Tg mice. N = 5 mice per group, data are presented as mean +- SEM (%), * P = 0.0149, *** P = 0.0003 by t -test. D Western blot of HDAC1 and TDP-43 in urea-soluble fractions. N = 5 mice per group. Source data are available online for this figure.
- Submitted by
- Invitrogen Antibodies (provider)
- Main image
- Experimental details
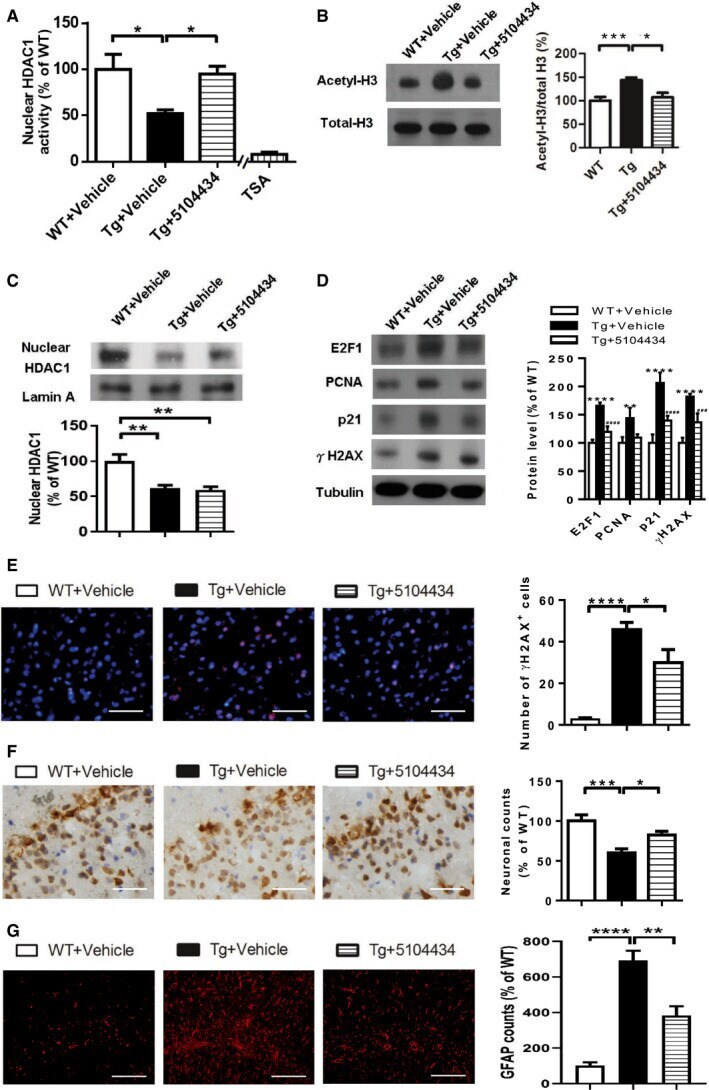
- Figure 7 Pharmaceutical gain of HDAC1 activity repairs aberrant cell cycle activity, DNA damage, and neuronal loss A Nuclear HDAC1 activity in mice after 2 months of compound 5104434 treatment. The nuclear extracts of the frontal cortices and hippocampus from 8 months old of mice were separated from total tissue lysates, were immunoprecipitated for HDAC1, and were then conducted to HDAC1 activity assay. N = 6 mice per group. TSA: nuclear extracts that were treated with Trichostatin A (TSA, an HDAC inhibitor) as a negative control for HDAC1-transferred fluorescent activity during the HDAC1 activity assay. * P = 0.0203 (WT versus Tg-Veh) or 0.0408 (Tg-Veh versus Tg+5104434) by multiple comparison. B Representative data of Western blot for nuclear acetylated-histone 3 (Lys 9/14), total histone H3, and quantification of protein levels. N = 6 mice per group. * P = 0.0105 or *** P = 0.0008 by multiple comparison. C Representative data of Western blot for nuclear HDAC1 levels and semi-quantification of the expression levels. N = 6 mice per group. ** P = 0.0022 (Tg)/0.0012 (Tg+5104434) by multiple comparison. D Left panel: representative data of Western blot for cell cycle-related and DNA damage-related proteins. Right histogram: semi-quantification of protein levels. N = 6 per group. *WT+Vehicle mice versus Tg+Vehicle mice, # Tg+5104434 mice versus Tg+Vehicle mice. Statistical analysis by multiple t -test with FDR correction, Q = 1%. ** P
- Submitted by
- Invitrogen Antibodies (provider)
- Main image
- Experimental details
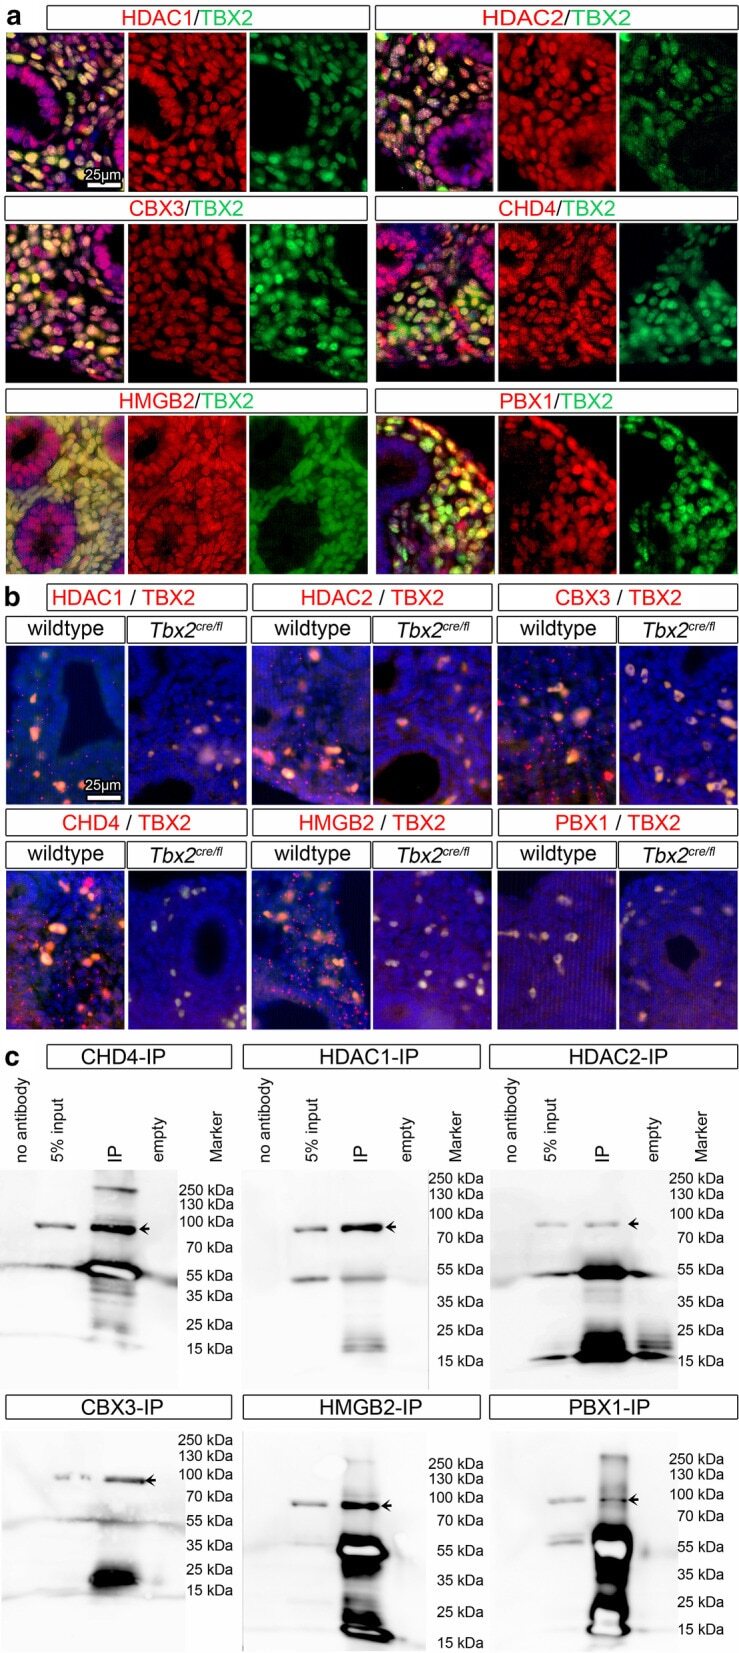
- Fig. 4 Interaction candidates are coexpressed with TBX2 in the pulmonary mesenchyme and interact in HEK293 cells. a Co-immunofluorescence analysis of candidate interaction partners (red) and TBX2 (green) on frontal sections of the right lung of E14.5 Tbx2 cre/ + embryos. Antigens are color-coded and nuclei were counterstained with DAPI (blue). Insets or selected regions in overview images are magnified in rows 2,4 and 6. b In situ proximity ligation assay of TBX2 and candidate interaction partners on 10 um frontal sections of E14.5 wildtype and Tbx2 cre/fl mutant lungs. Direct interaction is visualized by small red fluorescent dots. Larger more diffuse orange stains are due to auto-fluorescence of blood cells. Nuclei are counterstained with DAPI (blue). c Western blot analysis of co-immunoprecipitation experiments for verification of TBX2 interaction with candidate proteins on 10% SDS polyacrylamide gels. Detection was performed with an anti-TBX2 primary antibody and developed with chemoluminescence-IHC. Arrows indicate TBX2 bands. Lanes were loaded as follows: No antibody: IP without specific antibody resembling negative IP-control; 5% input: 5% of crude cell extract before precipitation; empty: no protein loaded; IP: co-immunoprecipitate with antibody for specific candidate. Expected molecular weight for TBX2.HA approx. 76.2 kDa
- Submitted by
- Invitrogen Antibodies (provider)
- Main image
- Experimental details
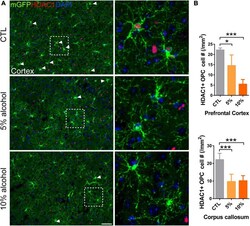
- FIGURE 7 HDAC1 expression is reduced in adult OPCs by alcohol exposure. (A) Immunostaining of HDAC1 showing HDAC1 + GFP + OPCs (arrowheads) was remarkably reduced in the cortex of alcohol-treated mice. The dotted white box was magnified in the right panel. Scale bar 50 mum. (B) Quantification of HDAC1 + GFP + OPCs in the corpus callosum and prefrontal cortex (* p < 0.05, *** p < 0.001, n = 6).

- Submitted by
- Invitrogen Antibodies (provider)
- Main image
- Experimental details
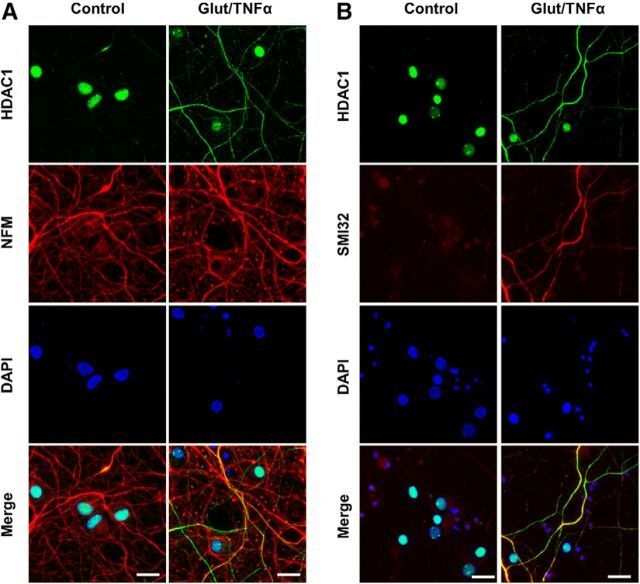
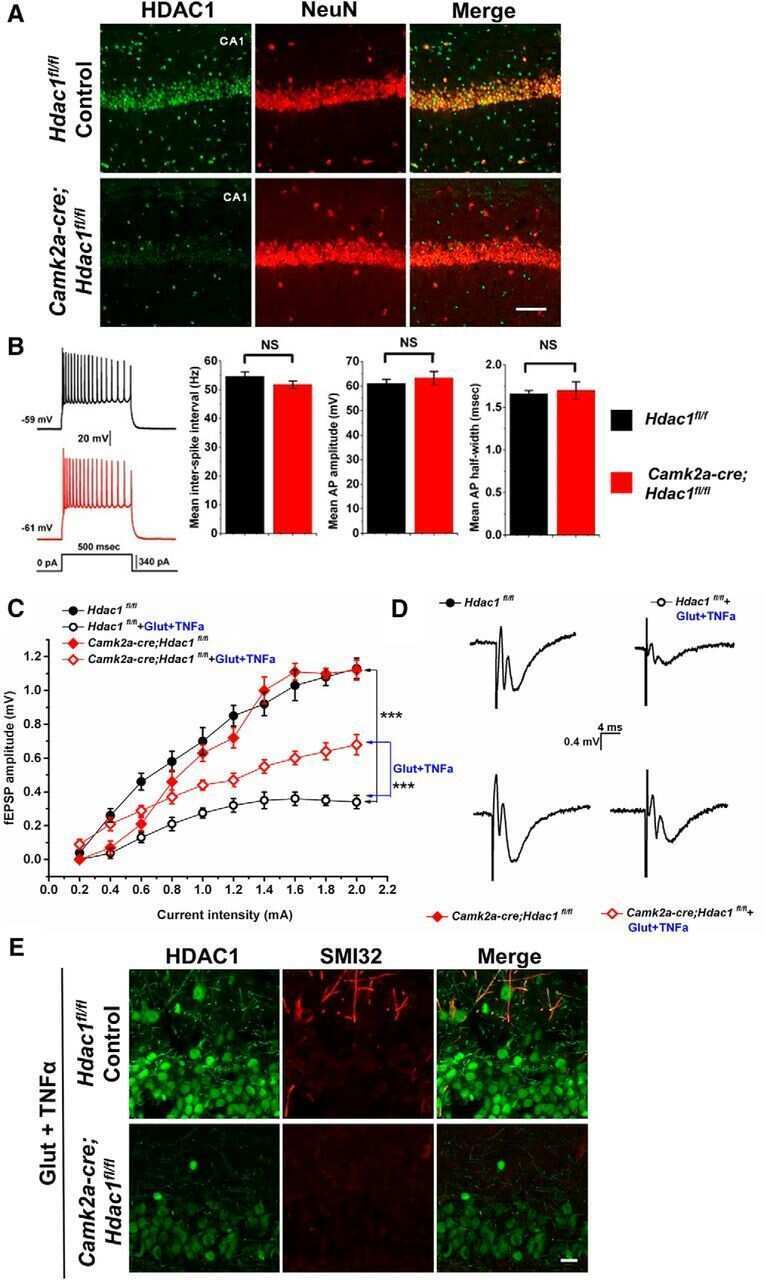
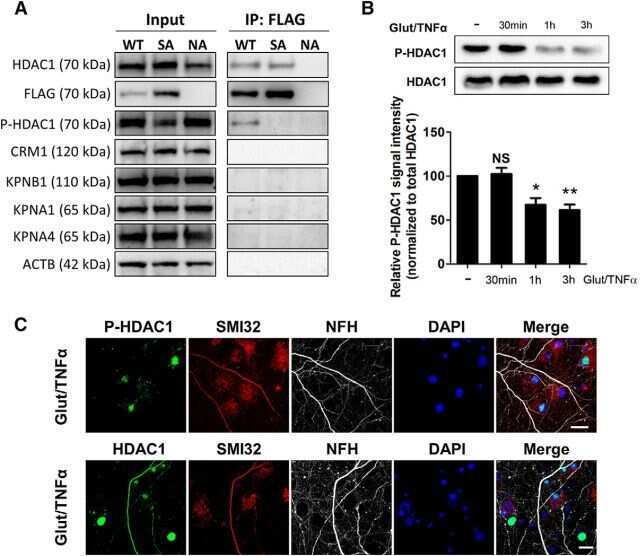
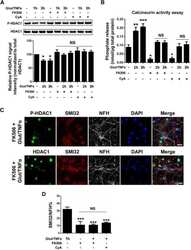
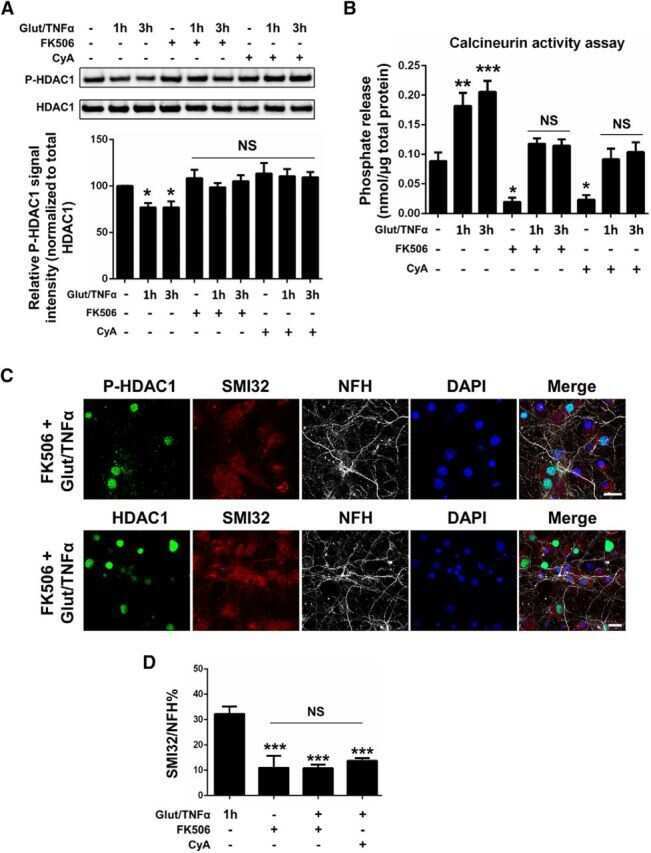
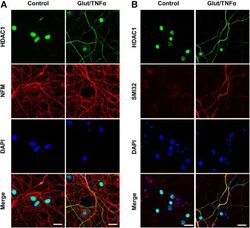
- Figure 1. Glutamate and TNFalpha induce cytoplasmic localization of HDAC1 in hippocampal neurons in culture. A , Primary cultures of rat hippocampal neurons (12 DIV) either untreated (control) or treated with 50 mu m glutamate and 200 ng/ml TNFalpha (Glut/TNFalpha) for 1 h and stained with DAPI and antibodies against HDAC1 (green) or NFM (red). B , Primary cultures of rat hippocampal neurons treated the same way as described in A and stained with DAPI and antibodies against HDAC1 (green) or nonphosphorylated NFH (SMI32, red), a marker of axonal damage. Scale bars, 25 mum.