Explore
 Validate
 Learn
Learn Western blot
 Immunocytochemistry
Antibody data
- Antibody Data
- Antigen structure
- References [0]
- Comments [0]
- Validations
- Immunocytochemistry [2]
- Chromatin Immunoprecipitation [2]
Submit
Validation data
Reference
Comment
Report error
- Product number
- PA5-17359 - Provider product page

- Provider
- Invitrogen Antibodies
- Product name
- AP2 alpha Polyclonal Antibody
- Antibody type
- Polyclonal
- Antigen
- Synthetic peptide
- Description
- It is not recommended to aliquot this antibody.
- Reactivity
- Human, Mouse, Rat
- Host
- Rabbit
- Isotype
- IgG
- Vial size
- 100 µL
- Concentration
- 147 µg/mL
- Storage
- -20°C
No comments: Submit comment
Supportive validation
- Submitted by
- Invitrogen Antibodies (provider)
- Main image

- Experimental details
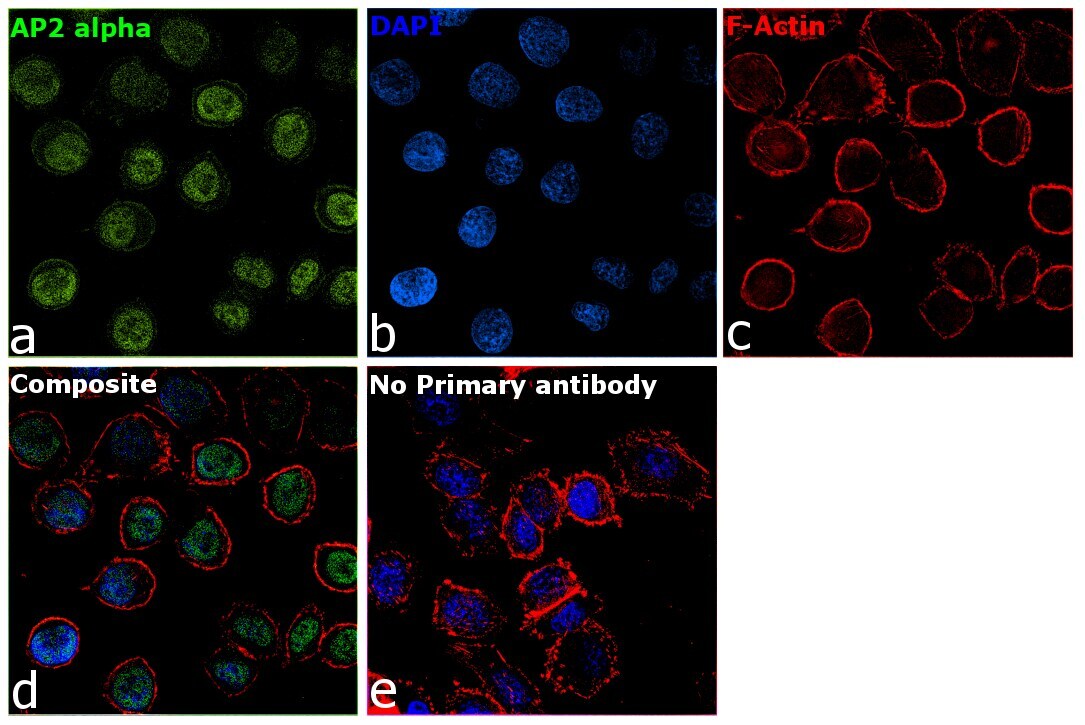
- Immunofluorescence analysis AP2 alpha was performed using 70% confluent log phase SK-BR-3 cells. The cells were fixed with 4% paraformaldehyde for 10 minutes, permeabilized with 0.1% Triton™ X-100 for 15 minutes, and blocked with 2% BSA for 1 hour at room temperature. The cells were labeled with AP2 alpha Polyclonal Antibody (Product PA5-17359) at 1:100 dilution in 0.1% BSA, incubated at 4 degree Celsius overnight and then with Goat anti-Rabbit IgG (H+L), Superclonal™ Recombinant Secondary Antibody, Alexa Fluor 488 (Product # A28175) at a dilution of 1:2000 for 45 minutes at room temperature (Panel a: Green). Nuclei (Panel b: Blue) were stained with SlowFade® Gold Antifade Mountant with DAPI (Product # S36938). F-actin (Panel c: Red) was stained with Rhodamine Phalloidin (Product # R415, 1:300). Panel d represents the merged image showing nuclear localization. Panel e represents control cells with no primary antibody to assess background. The images were captured at 60X magnification.
- Submitted by
- Invitrogen Antibodies (provider)
- Main image
- Experimental details
- Immunofluorescence analysis AP2 alpha was performed using 70% confluent log phase SK-BR-3 cells. The cells were fixed with 4% paraformaldehyde for 10 minutes, permeabilized with 0.1% Triton™ X-100 for 15 minutes, and blocked with 2% BSA for 1 hour at room temperature. The cells were labeled with AP2 alpha Polyclonal Antibody (Product PA5-17359) at 1:100 dilution in 0.1% BSA, incubated at 4 degree Celsius overnight and then with Goat anti-Rabbit IgG (H+L), Superclonal™ Recombinant Secondary Antibody, Alexa Fluor 488 (Product # A28175) at a dilution of 1:2000 for 45 minutes at room temperature (Panel a: Green). Nuclei (Panel b: Blue) were stained with SlowFade® Gold Antifade Mountant with DAPI (Product # S36938). F-actin (Panel c: Red) was stained with Rhodamine Phalloidin (Product # R415, 1:300). Panel d represents the merged image showing nuclear localization. Panel e represents control cells with no primary antibody to assess background. The images were captured at 60X magnification.

Supportive validation
- Submitted by
- Invitrogen Antibodies (provider)
- Main image

- Experimental details
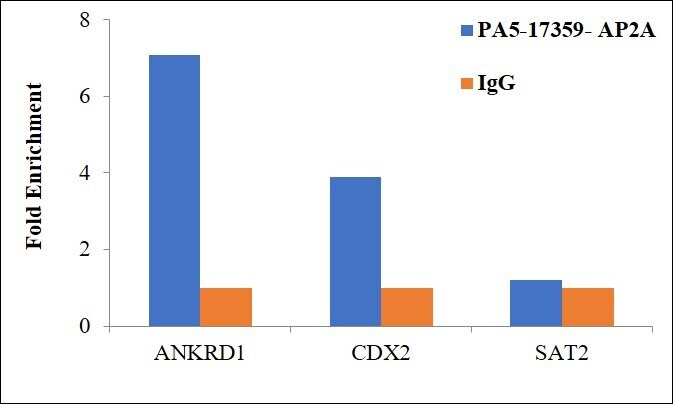
- Chromatin Immunoprecipitation (ChIP) assay of endogenous AP2 alpha protein using Anti-AP2 alpha Antibody: ChIP was performed using Anti-AP2 alpha Polyclonal Antibody (Product # PA5-17359) 5 µg, on sheared chromatin from MCF-7 cells using the MAGnify ChIP System kit (Product # 49-2024). Normal Rabbit IgG was used as a negative IP control. The purified DNA was analyzed by qPCR using primers binding to transcriptional start site of ANKRD1, CDX2 promoter and SAT2 satellite repeats. Data is presented as fold enrichment of the antibody signal versus the negative control IgG using the comparative CT method.

- Submitted by
- Invitrogen Antibodies (provider)
- Main image
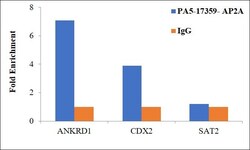
- Experimental details
- Chromatin Immunoprecipitation (ChIP) assay of endogenous AP2 alpha protein using Anti-AP2 alpha Antibody: ChIP was performed using Anti-AP2 alpha Polyclonal Antibody (Product # PA5-17359) 5 µg, on sheared chromatin from MCF-7 cells using the MAGnify ChIP System kit (Product # 49-2024). Normal Rabbit IgG was used as a negative IP control. The purified DNA was analyzed by qPCR using primers binding to transcriptional start site of ANKRD1, CDX2 promoter and SAT2 satellite repeats. Data is presented as fold enrichment of the antibody signal versus the negative control IgG using the comparative CT method.