Explore
 Validate
 Learn
Learn Western blot
 Immunocytochemistry
Antibody data
- Antibody Data
- Antigen structure
- References [2]
- Comments [0]
- Validations
- Immunocytochemistry [2]
- Immunohistochemistry [3]
- Chromatin Immunoprecipitation [2]
- Other assay [3]
Submit
Validation data
Reference
Comment
Report error
- Product number
- PA5-40697 - Provider product page

- Provider
- Invitrogen Antibodies
- Product name
- SOX10 Polyclonal Antibody
- Antibody type
- Polyclonal
- Antigen
- Synthetic peptide
- Description
- Peptide sequence: PGGEAEQGGT AAIQAHYKSA HLDHRHPGEG SPMSDGNPEH PSGQSHGPPT Sequence homology: Cow: 93%; Dog: 93%; Guinea Pig: 93%; Horse: 93%; Human: 100%; Mouse: 93%; Rabbit: 93%; Rat: 86%
- Reactivity
- Human
- Host
- Rabbit
- Isotype
- IgG
- Vial size
- 100 μL
- Concentration
- 0.5 mg/mL
- Storage
- -20°C, Avoid Freeze/Thaw Cycles
Submitted references DEPDC1B Promotes Melanoma Angiogenesis and Metastasis through Sequestration of Ubiquitin Ligase CDC16 to Stabilize Secreted SCUBE3.
EWSR1-ATF1 dependent 3D connectivity regulates oncogenic and differentiation programs in Clear Cell Sarcoma.
Hu F, Fong KO, Cheung MPL, Liu JA, Liang R, Li TW, Sharma R, Ip PP, Yang X, Cheung M
Advanced science (Weinheim, Baden-Wurttemberg, Germany) 2022 Apr;9(10):e2105226
Advanced science (Weinheim, Baden-Wurttemberg, Germany) 2022 Apr;9(10):e2105226
EWSR1-ATF1 dependent 3D connectivity regulates oncogenic and differentiation programs in Clear Cell Sarcoma.
Möller E, Praz V, Rajendran S, Dong R, Cauderay A, Xing YH, Lee L, Fusco C, Broye LC, Cironi L, Iyer S, Rengarajan S, Awad ME, Naigles B, Letovanec I, Ormas N, Finzi G, La Rosa S, Sessa F, Chebib I, Petur Nielsen G, Digklia A, Spentzos D, Cote GM, Choy E, Aryee M, Stamenkovic I, Boulay G, Rivera MN, Riggi N
Nature communications 2022 Apr 27;13(1):2267
Nature communications 2022 Apr 27;13(1):2267
No comments: Submit comment
Supportive validation
- Submitted by
- Invitrogen Antibodies (provider)
- Main image

- Experimental details
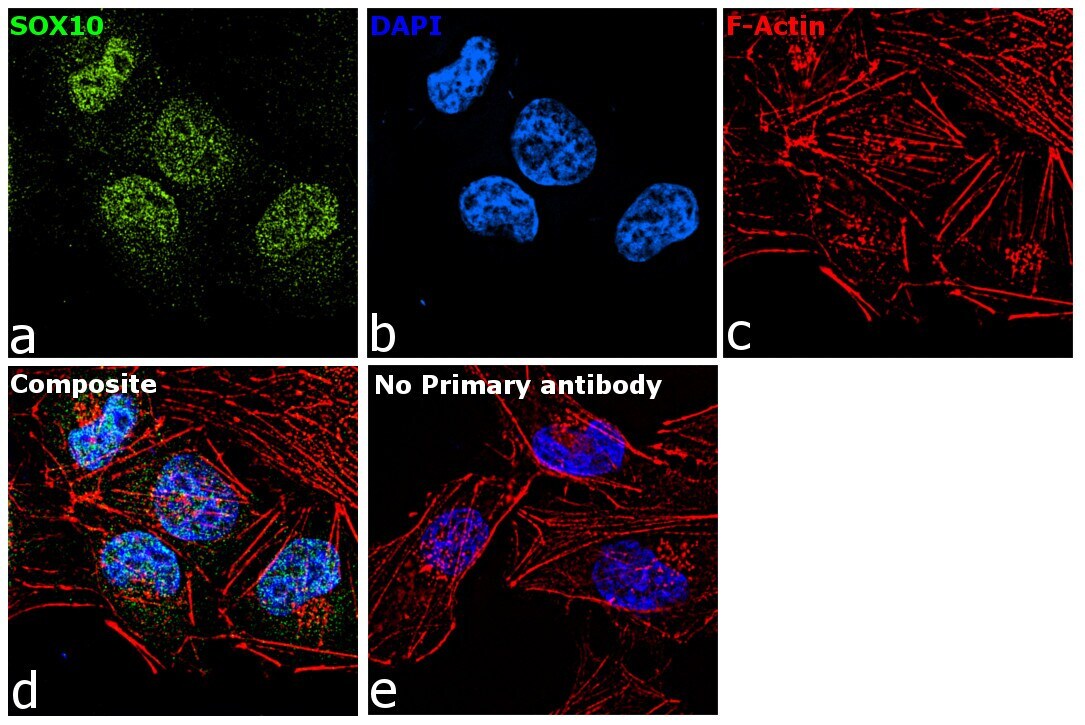
- Immunofluorescence analysis of SOX10 was performed using 70% confluent log phase A-375 cells treated with SOX10 polyclonal antibody (Product # PA5-40697). The cells were fixed with 4% paraformaldehyde for 10 Minutes, permeabilized with 0.1% Triton™ X-100 for 15 minutes, and blocked with 2% BSA for 1 hour at room temperature. cells were labeled with SOX10 polyclonal antibody (Product # PA5-40697) at 5 µg/mL in 0.1% BSA, incubated at 4 degree Celsius overnight and then labeled with Goat anti-Rabbit IgG (H+L), Superclonal™ Recombinant Secondary Antibody, Alexa Fluor 488 (Product # A27034) at a dilution of 1:2,000 for 45 minutes at room temperature (Panel a: green). Nuclei (Panel b: blue) were stained with ProLong™ Diamond Antifade Mountant with DAPI (Product # P36962). F-actin (Panel c: red) was stained with Rhodamine Phalloidin (Product # R415). Panel d represents the merged image showing nuclear localization. Panel e represents control cells with no primary antibody to assess background. The images were captured at 60X magnification.

- Submitted by
- Invitrogen Antibodies (provider)
- Main image

- Experimental details
- Immunofluorescence analysis of SOX10 was performed using 70% confluent log phase A-375 cells treated with SOX10 polyclonal antibody (Product # PA5-40697). The cells were fixed with 4% paraformaldehyde for 10 Minutes, permeabilized with 0.1% Triton™ X-100 for 15 minutes, and blocked with 2% BSA for 1 hour at room temperature. cells were labeled with SOX10 polyclonal antibody (Product # PA5-40697) at 5 µg/mL in 0.1% BSA, incubated at 4 degree Celsius overnight and then labeled with Goat anti-Rabbit IgG (Heavy Chain), Superclonal™ Recombinant Secondary Antibody, Alexa Fluor 488 (Product # A27034) at a dilution of 1:2,000 for 45 minutes at room temperature (Panel a: green). Nuclei (Panel b: blue) were stained with ProLong™ Diamond Antifade Mountant with DAPI (Product # P36962). F-actin (Panel c: red) was stained with Rhodamine Phalloidin (Product # R415). Panel d represents the merged image showing nuclear localization. Panel e represents control cells with no primary antibody to assess background. The images were captured at 60X magnification.
Supportive validation
- Submitted by
- Invitrogen Antibodies (provider)
- Main image
- Experimental details
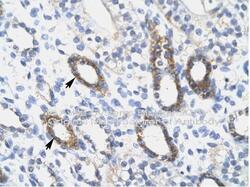
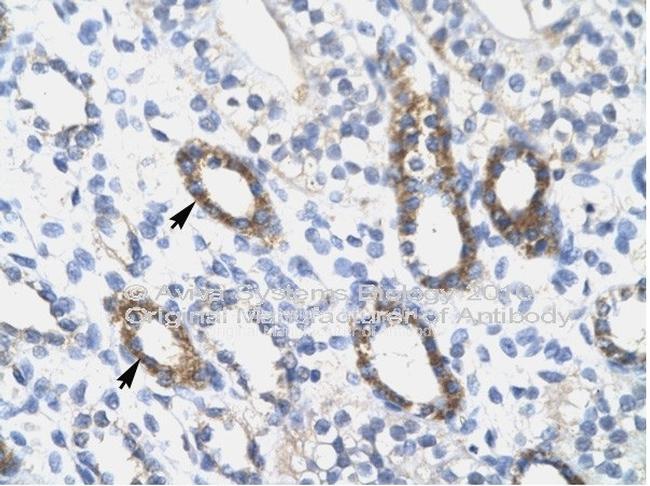
- Immunohistochemistry (paraffin-embedded) analysis of kidney tissue using an anti-SOX10 polyclonal antibody (Product # PA5-40697).
- Submitted by
- Invitrogen Antibodies (provider)
- Main image
- Experimental details
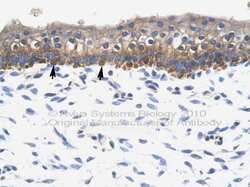
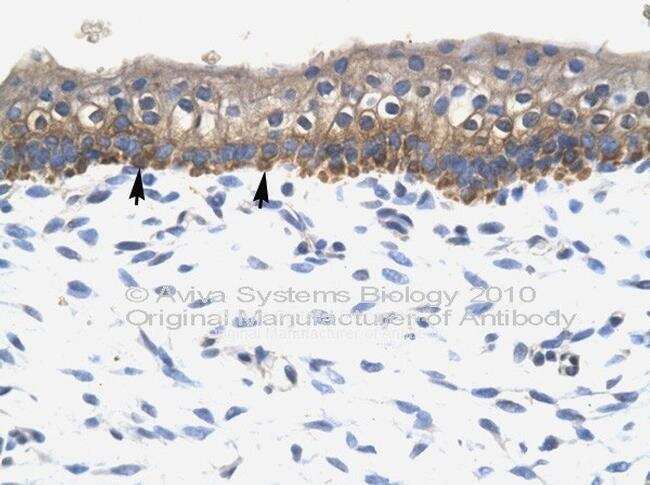
- Immunohistochemistry (paraffin-embedded) analysis of skin tissue using an anti-SOX10 polyclonal antibody (Product # PA5-40697).
- Submitted by
- Invitrogen Antibodies (provider)
- Main image

- Experimental details
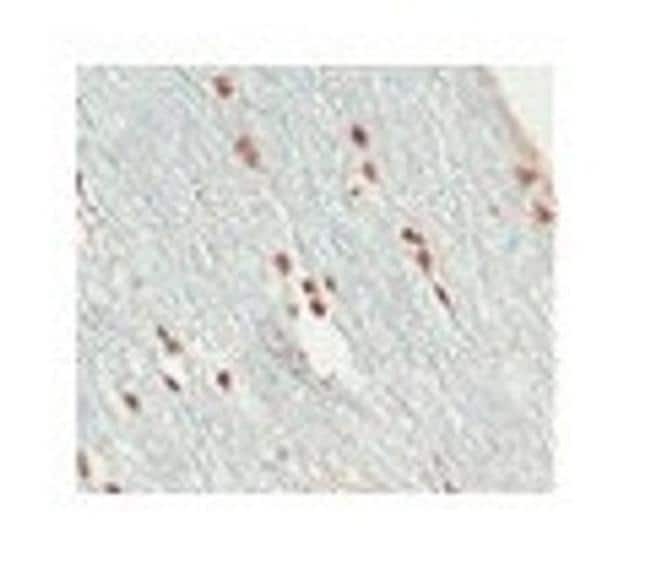
- Immunohistochemistry (paraffin-embedded) analysis of human optic nerves and spinal cord cells using an anti-SOX10 polyclonal antibody (Product # PA5-40697).; Lane 8), processed to minimize antigen loss (shortened protocol, reduced exposure to high temperature); embedded in paraffin wax; sectioned at 3 micronsA2/ (IHC-PZ + FF)As above for initial fixation then post-fixed in 10% buffered formalin for 5 daysB/ (IHC-P)human optic nerve and spinal cord fixed in 10% buffered formalin (relatively short post mortem interval and fixation duration); standard processing; embedded in paraffin wax; sectioned at 3 micronsControlsNegative: omission of primary.Positive: Olig2 reactivity was in comparison with antibody from Prof Charles Stiles/ Dr John Alberta (DF308; N terminal Olig.
Supportive validation
- Submitted by
- Invitrogen Antibodies (provider)
- Main image

- Experimental details
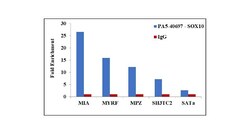
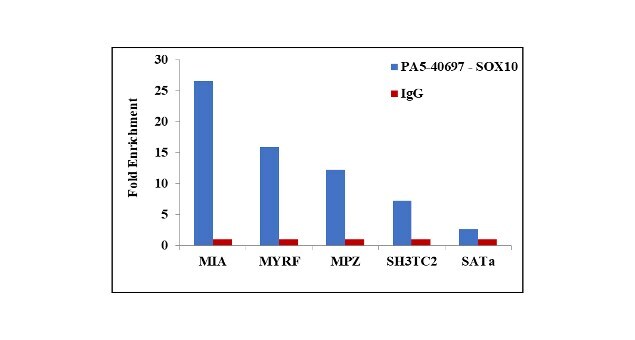
- Chromatin Immunoprecipitation (ChIP) assay of endogenous SOX10 protein using Anti-SOX10 Antibody: ChIP was performed using Anti-SOX10 Rabbit Polyclonal Antibody (Product # PA5-40697, 5 µg) on sheared chromatin from A-375 cells using the MAGnify ChIP System kit (Product # 49-2024). Normal Rabbit IgG was used as a negative IP control. The purified DNA was analyzed by qPCR using primers binding to MYRF promoter, MIA, MPZ and SH3TC2 transcriptional start sites and SAT2 satellite repeats. Data is presented as fold enrichment of the antibody signal versus the negative control IgG using the comparative CT method.

- Submitted by
- Invitrogen Antibodies (provider)
- Main image
- Experimental details
- Chromatin Immunoprecipitation (ChIP) assay of endogenous SOX10 protein using Anti-SOX10 Antibody: ChIP was performed using Anti-SOX10 Rabbit Polyclonal Antibody (Product # PA5-40697, 5 µg) on sheared chromatin from A-375 cells using the MAGnify ChIP System kit (Product # 49-2024). Normal Rabbit IgG was used as a negative IP control. The purified DNA was analyzed by qPCR using primers binding to MYRF promoter, MIA, MPZ and SH3TC2 transcriptional start sites and SAT2 satellite repeats. Data is presented as fold enrichment of the antibody signal versus the negative control IgG using the comparative CT method.
Supportive validation
- Submitted by
- Invitrogen Antibodies (provider)
- Main image
- Experimental details
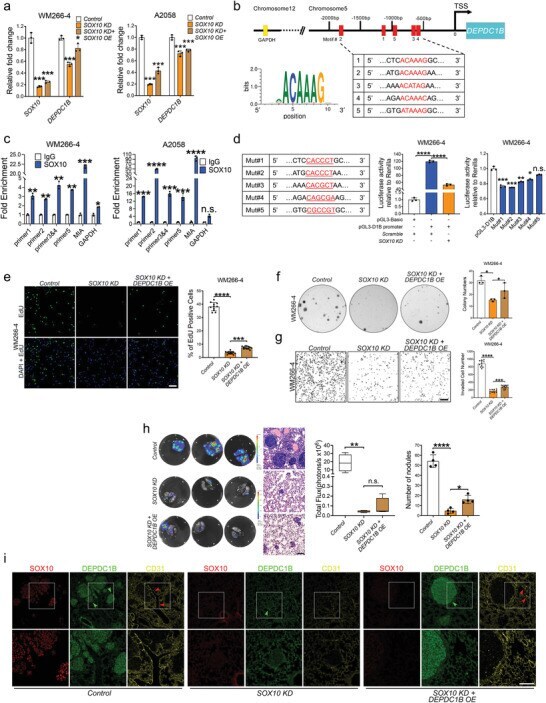
- Figure 3 DEPDC1B functions downstream of SOX10 to partly mediate its oncogenic role. a) qPCR analysis of SOX10 and DEPDC1B mRNA levels in melanoma cells treated with control ( scramble ), SOX10 KD alone, and SOX10 KD + DEPDC1B OE , n = 3. b) Schematic diagram showing the genomic location of DEPDC1B regulatory regions containing SOX10 binding motifs naming in a 5' to 3' order as motifs 2, 1, 5, 3 and 4 based on their degree of similarity to a SOX10 consensus sequence as evaluated by the JASPAR database. c) ChIP-qPCR analysis showing fold enrichment levels of motifs bound by SOX10 compared with IgG control, n = 3. d) The wild-type DEPDC1B promoter (-2071bp to -57bp) was cloned into pGL3-based vector and the activity was evaluated in WM266-4 cells treated with SOX10 KD or scramble control by dual luciferase reporter assay. The six nucleotides within the five SOX10 consensus motifs were mutated (A/T to C/G, and vice versa) and each mutated promoter activity was compared with the wild-type promoter by luciferase reporter assay. e) DEPDC1B OE in SOX10 KD partially restored the number of EdU + cells ( n >= 7), f) colony formation ( n = 3), and g) transwell-invaded cells ( n >= 7) compared with SOX10 KD alone. Scale bar = 200 um. h) Bioluminescence analysis showed a limited degree of rescue in lung metastases by DEPDC1B OE in SOX10 KD cells compared with SOX10 KD alone and parental control, n = 4. H&E staining of the corresponding lung sections. Due to the strong inhibitory effect of
- Submitted by
- Invitrogen Antibodies (provider)
- Main image
- Experimental details
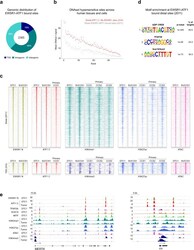
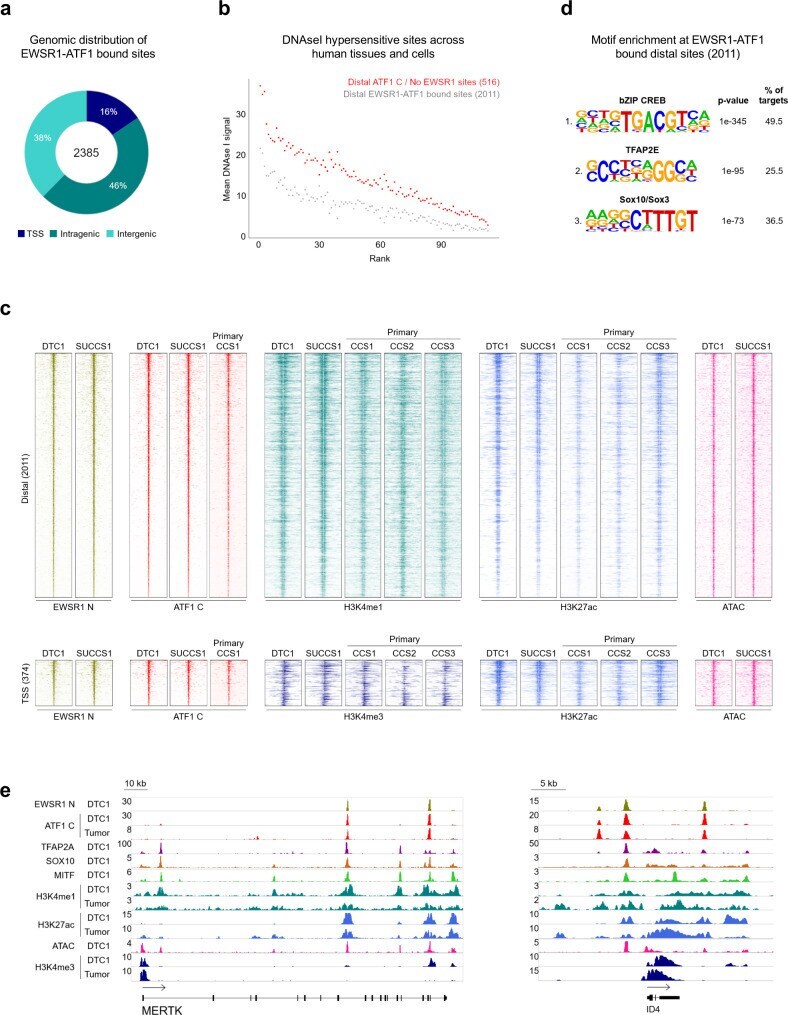
- Fig. 1 EWSR1-ATF1 displays a distinct binding pattern compared to wt ATF1. a Genomic distribution of 2385 consensus EWSR1-ATF1 binding sites shared between DTC1 and SU-CCS-1 cell lines, illustrating preferential EWSR1-ATF1 binding to distal genomic regions. b DNAse I hypersensitivity profile comparison between 2011 distal EWSR1-ATF1 sites and 516 wt ATF1 bound distal sites across 113 different cell types, showing a more restricted DNA accessibility pattern for the fusion protein binding sites in other cell types. c Top panel: heatmaps depicting EWSR1 N, ATF1 C, H3K4me1, H3K27ac, and ATAC signal intensities at 2011 EWSR1-ATF1 bound distal sites in DTC1 and SU-CCS-1 cell lines, as well as three primary CCS tumors. Bottom panel : EWSR1 N, ATF1 C, H3K4me3, H3K27ac, and ATAC signal intensities at 374 TSS-associated EWSR1-ATF1 binding sites. For each heatmap 20 kb regions centered on the EWSR1-ATF1 peaks are shown. Signals are ranked by ATF1 C intensity. d De novo motif enrichment analysis for 2011 distal EWSR1-ATF1 binding regions. The top three motifs identified are shown. Binomial p-values are given by the motif enrichment software HOMER. e , ChIP-seq track at MERTK and ID4 genomic loci, illustrating similar EWSR1-ATF1 binding and chromatin activity profiles between DTC1 and primary CCS tumor cells, and the presence of TFAP2A, SOX10, and MITF at EWR1-ATF1 sites.
- Submitted by
- Invitrogen Antibodies (provider)
- Main image
- Experimental details
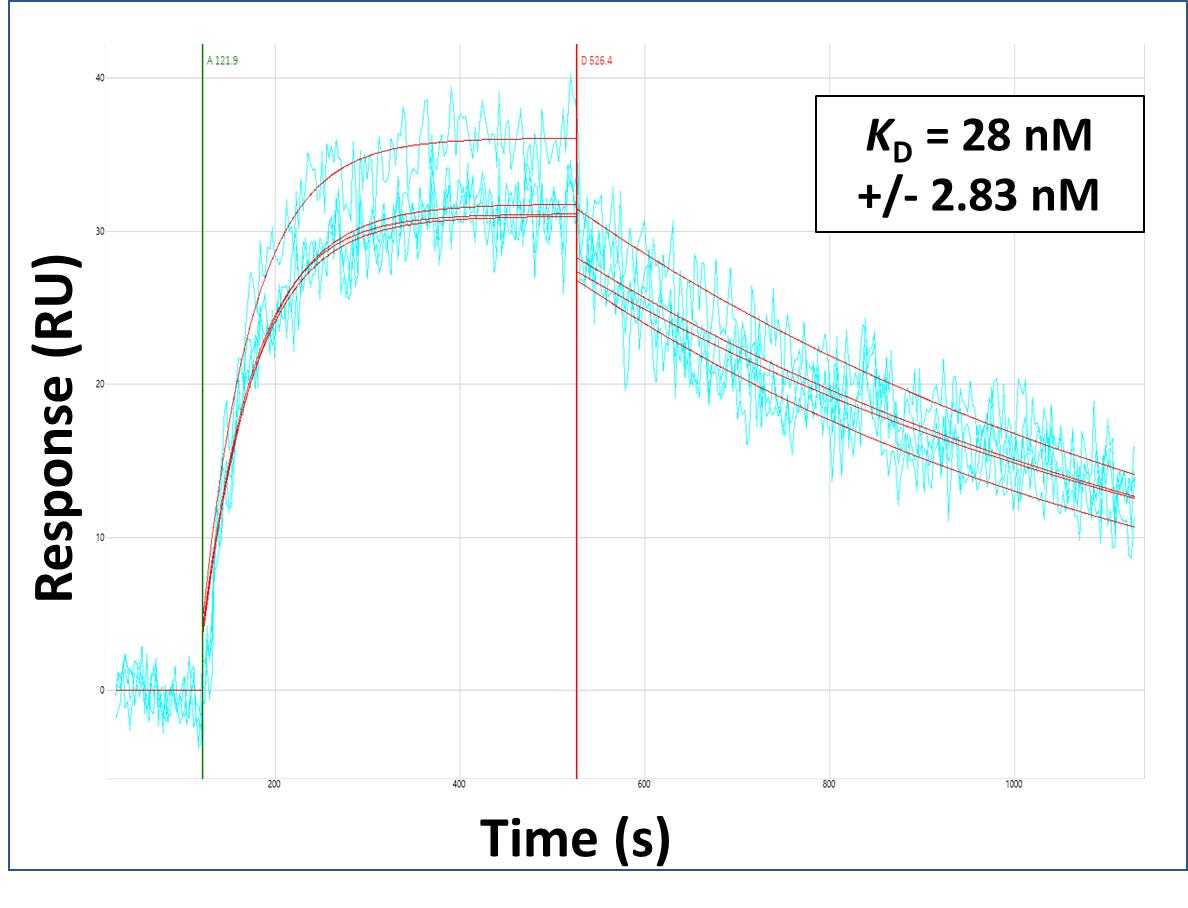
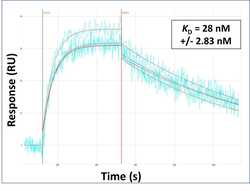
- Surface Plasmon Resonance of SOX10 polyclonal antibody (Product # PA5-40697). Purified polyclonal antibodies were immobilized on a Protein A/G coated Carterra LSA sensor chip at concentrations of 5, and 50 µg/mL in duplicate. Antibodies on the surface were exposed to interaction with peptides sequentially via microfluidic controlled flow at 333 nm peptide concentration for kinetic characterization of the binders for affinity and specificity, followed by curve fitting using the Kinetics software. Kd determinations for both concentrations were averaged and results and standard deviation are shown.