 Explore
 Validate
 Learn
Learn Western blot
 Immunocytochemistry
Antibody data
- Antibody Data
- Antigen structure
- References [0]
- Comments [0]
- Validations
- Immunocytochemistry [2]
- Immunohistochemistry [3]
- Flow cytometry [1]
- Other assay [10]
Submit
Validation data
Reference
Comment
Report error
- Product number
- 44-609G - Provider product page

- Provider
- Invitrogen Antibodies
- Product name
- AKT Pan Polyclonal Antibody
- Antibody type
- Polyclonal
- Antigen
- Synthetic peptide
- Reactivity
- Human, Mouse
- Host
- Rabbit
- Isotype
- IgG
- Vial size
- 100 μL
- Storage
- -20°C
No comments: Submit comment
Supportive validation
- Submitted by
- Invitrogen Antibodies (provider)
- Main image

- Experimental details
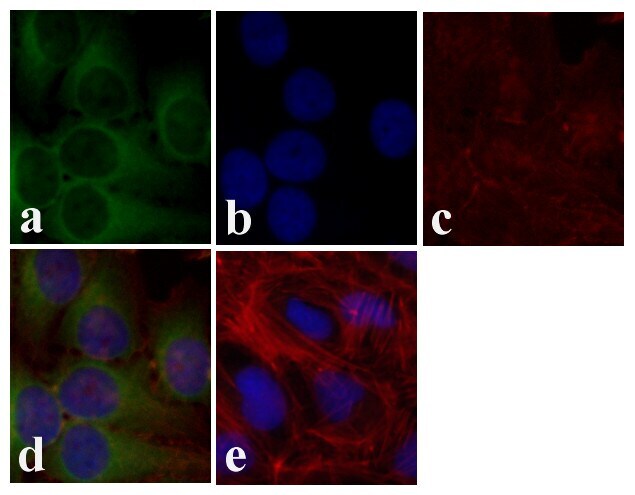
- Immunofluorescence analysis of AKT pan was done on 70% confluent log phase U2OS cells. The cells were fixed with 4% paraformaldehyde for 15 minutes, permeabilized with 0.25% Triton™ X-100 for 10 minutes, and blocked with 5% BSA for 1 hour at room temperature. The cells were labeled with AKT pan Rabbit Polyclonal Antibody (Product # 44-609G) at 1:250 dilution in 0.1%BSA and incubated for 3 hours at room temperature and then labeled with Alexa Fluor 488 Goat Anti-Rabbit IgG Secondary Antibody (Product # A-11008) at a dilution of 1:400 for 30 minutes at room temperature (Panel a: green). Nuclei (Panel b: blue) were stained with SlowFade® Gold Antifade Mountant with DAPI (Product # S36938). F-actin (Panel c: red) was stained with Alexa Fluor 594 Phalloidin (Product # A12381). Panel d is a merged image showing cytoplasmic localization. Panel e shows no primary antibody control. The images were captured at 20X magnification.
- Submitted by
- Invitrogen Antibodies (provider)
- Main image
- Experimental details
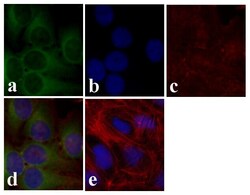
- Immunofluorescence analysis of AKT pan was done on 70% confluent log phase U2OS cells. The cells were fixed with 4% paraformaldehyde for 15 minutes, permeabilized with 0.25% Triton™ X-100 for 10 minutes, and blocked with 5% BSA for 1 hour at room temperature. The cells were labeled with AKT pan Rabbit Polyclonal Antibody (Product # 44-609G) at 1:250 dilution in 0.1%BSA and incubated for 3 hours at room temperature and then labeled with Alexa Fluor 488 Goat Anti-Rabbit IgG Secondary Antibody (Product # A-11008) at a dilution of 1:400 for 30 minutes at room temperature (Panel a: green). Nuclei (Panel b: blue) were stained with SlowFade® Gold Antifade Mountant with DAPI (Product # S36938). F-actin (Panel c: red) was stained with Alexa Fluor 594 Phalloidin (Product # A12381). Panel d is a merged image showing cytoplasmic localization. Panel e shows no primary antibody control. The images were captured at 20X magnification.

Supportive validation
- Submitted by
- Invitrogen Antibodies (provider)
- Main image
- Experimental details
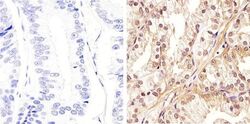
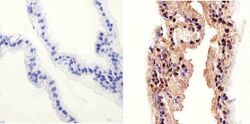
- Immunohistochemistry analysis of AKT (Pan) showing staining in the cytoplasm and nucleus of paraffin-embedded human prostate carcinoma (right) compared to a negative control without primary antibody (left). To expose target proteins, antigen retrieval was performed using 10mM sodium citrate (pH 6.0), microwaved for 8-15 min. Following antigen retrieval, tissues were blocked in 3% H2O2-methanol for 15 min at room temperature, washed with ddH2O and PBS, and then probed with a AKT (Pan) Rabbit Polyclonal Antibody (Product # 44-609G) diluted in 3% BSA-PBS at a dilution of 1:100 overnight at 4°C in a humidified chamber. Tissues were washed extensively in PBST and detection was performed using an HRP-conjugated secondary antibody followed by colorimetric detection using a DAB kit. Tissues were counterstained with hematoxylin and dehydrated with ethanol and xylene to prep for mounting.
- Submitted by
- Invitrogen Antibodies (provider)
- Main image
- Experimental details
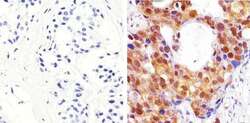
- Immunohistochemistry analysis of AKT (Pan) showing staining in the cytoplasm and nucleus of paraffin-embedded mouse prostate tissue (right) compared to a negative control without primary antibody (left). To expose target proteins, antigen retrieval was performed using 10mM sodium citrate (pH 6.0), microwaved for 8-15 min. Following antigen retrieval, tissues were blocked in 3% H2O2-methanol for 15 min at room temperature, washed with ddH2O and PBS, and then probed with a AKT (Pan) Rabbit Polyclonal Antibody (Product # 44-609G) diluted in 3% BSA-PBS at a dilution of 1:20 overnight at 4°C in a humidified chamber. Tissues were washed extensively in PBST and detection was performed using an HRP-conjugated secondary antibody followed by colorimetric detection using a DAB kit. Tissues were counterstained with hematoxylin and dehydrated with ethanol and xylene to prep for mounting.

- Submitted by
- Invitrogen Antibodies (provider)
- Main image
- Experimental details
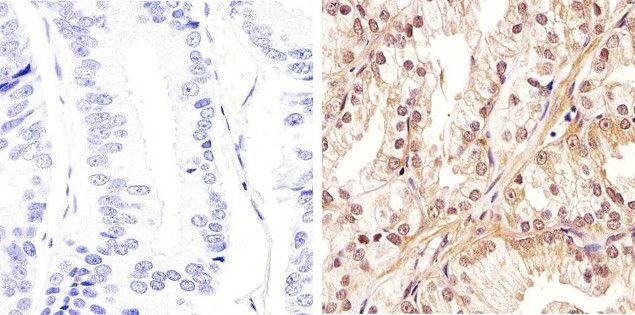
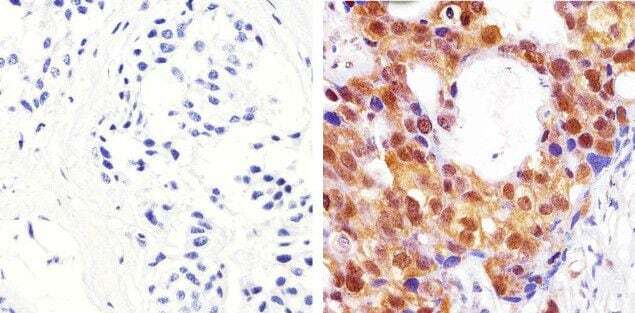
- Immunohistochemistry analysis of AKT (Pan) showing staining in the cytoplasm and nucleus of paraffin-embedded human breast carcinoma (right) compared to a negative control without primary antibody (left). To expose target proteins, antigen retrieval was performed using 10mM sodium citrate (pH 6.0), microwaved for 8-15 min. Following antigen retrieval, tissues were blocked in 3% H2O2-methanol for 15 min at room temperature, washed with ddH2O and PBS, and then probed with a AKT (Pan) Rabbit Polyclonal Antibody (Product # 44-609G) diluted in 3% BSA-PBS at a dilution of 1:100 overnight at 4°C in a humidified chamber. Tissues were washed extensively in PBST and detection was performed using an HRP-conjugated secondary antibody followed by colorimetric detection using a DAB kit. Tissues were counterstained with hematoxylin and dehydrated with ethanol and xylene to prep for mounting.
Supportive validation
- Submitted by
- Invitrogen Antibodies (provider)
- Main image

- Experimental details
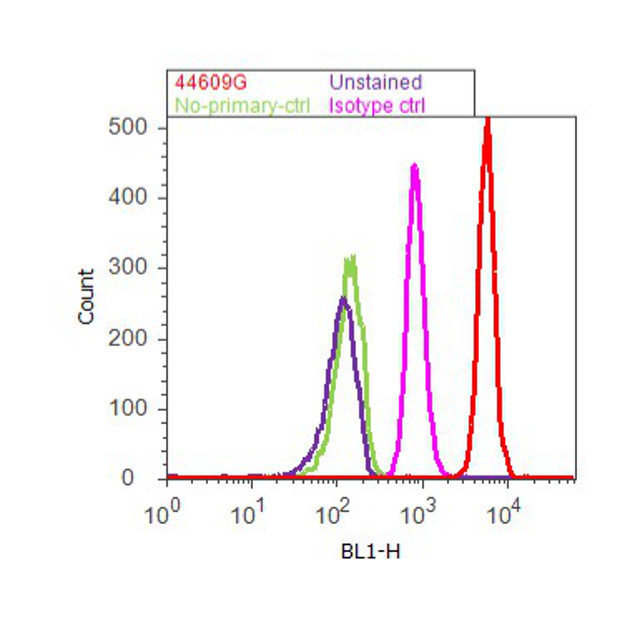
- Flow cytometry analysis of AKT pan was done on HEK-293 cells. Cells were fixed with 70% ethanol for 10 minutes, permeabilized with 0.25% Triton™ X-100 for 20 minutes, and blocked with 5% BSA for 30 minutes at room temperature. Cells were labeled with AKT pan Rabbit Polyclonal Antibody (44609G, red histogram) or with rabbit isotype control (pink histogram) at 3-5 µg/million cells in 2.5% BSA. After incubation at room temperature for 2 hours, the cells were labeled with Alexa Fluor® 488 Goat Anti-Rabbit Secondary Antibody (A11008) at a dilution of 1:400 for 30 minutes at room temperature. The representative 10,000 cells were acquired and analyzed for each sample using an Attune® Acoustic Focusing Cytometer. The purple histogram represents unstained control cells and the green histogram represents no-primary-antibody control.
Supportive validation
- Submitted by
- Invitrogen Antibodies (provider)
- Main image
- Experimental details
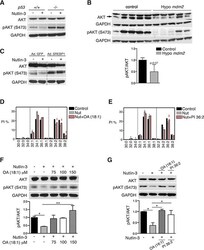
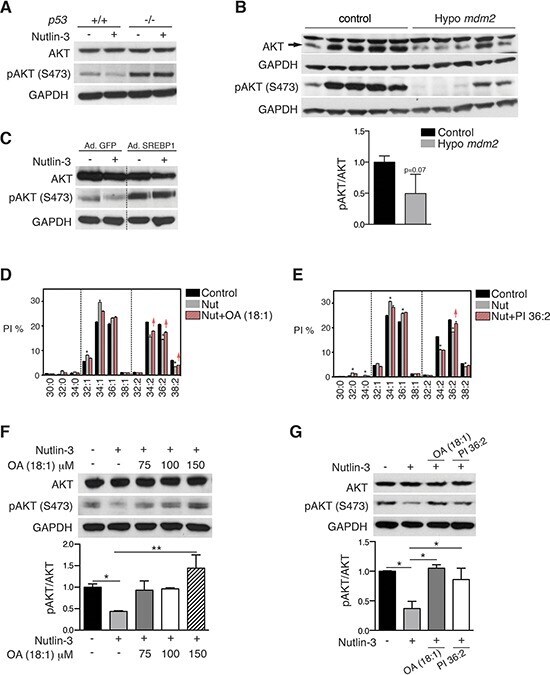
- Figure 6 p53-mediated SCD repression attenuates AKT activation A. HCT116 p53 +/+ and p53 -/- cells were treated with 5 muM nutlin-3 for 72 h and pAKT (S473) and total AKT levels were assessed by western blotting. GAPDH was used as loading control. B. AKT and pAKT (S473) levels in tissues from hypo Mdm2 and control mice ( n = 5). The ratio pAKT/AKT is expressed relative to control, p = 0, 07, unpaired t test. C. Re-introduction of SREBP1 restores pAKT in nutlin-3-treated cells. HCT116 p53 +/+ cells were infected with an adenovirus encoding SREBP1c or empty virus. Four h after infection, cells were treated 5 muM nutlin-3 for 72 h. pAKT and total AKT levels were assessed by western blotting. The blot was cropped to show the conditions of interest. D and F. Oleic acid (OA) rescues the effect of p53 on pAKT by restoring phospholipid profiles. HCT116 cells were treated with OA (100 muM) in combination with 5 muM nutlin-3 (Nut). Phospholipid profiles are presented as described in the legend to Figure 1 . Representative blots of total AKT and pAKT (S473) are shown. The graph presents the average pAKT/AKT ratio of two independent samples. * p < 0.05, ** p < 0.01 by ANOVA. E and G. PI36:2 restores pAKT (S473) levels in nutlin-3-treated cells. HCT116 cells were treated with 5 muM nutlin-3 alone (Nut) or in combination with PI36:2 at 10 muM. After 72 h, cells pellets were collected for lipid or western blot analysis. Phospholipid profiles were presented as described in the legend to Figu
- Submitted by
- Invitrogen Antibodies (provider)
- Main image

- Experimental details
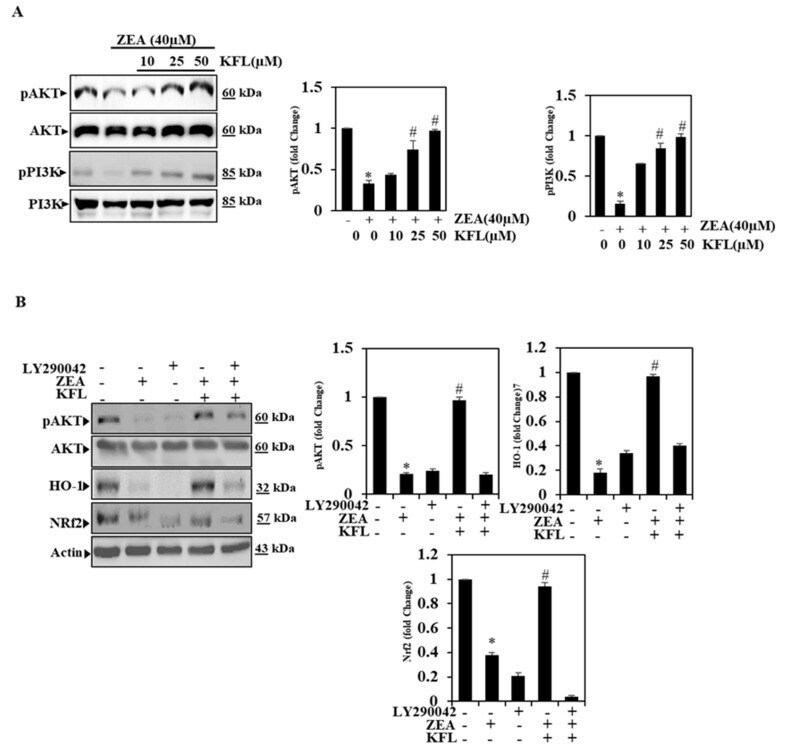
- Figure 4 KFL triggers the PI3K/Akt pathway in ZEA-induced HepG2 cells. ( A ) Cells were treated with KFL (10, 25 and 50 uM) followed by ZEA (40 uM) for 24 h. After the treatment, whole-cell lysates were exposed to Western blotting with anti-pPI3K and anti-pAkt antibodies. Total PI3K and Akt levels were measured as loading controls. ( B ) Cells were pre-treated with a PI3K/Akt inhibitor (LY294002, 30 muM) for 2 h, followed by KFL (50 muM) and/or ZEA (40 muM) for 24 h. Western blot was performed to detect the pAkt, HO-1 and Nrf2 levels by anti-pAkt, anti-HO-1 and anti-Nrf2 abs. Data are represented as the mean +- SD of triplicate values ( n = 3), and * p < 0.05 represents noteworthy discrepancies compared with the control. # p < 0.05 represents significant variations compared with the ZEA alone and KFL with ZEA treatment groups.
- Submitted by
- Invitrogen Antibodies (provider)
- Main image
- Experimental details
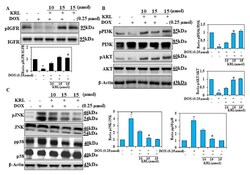
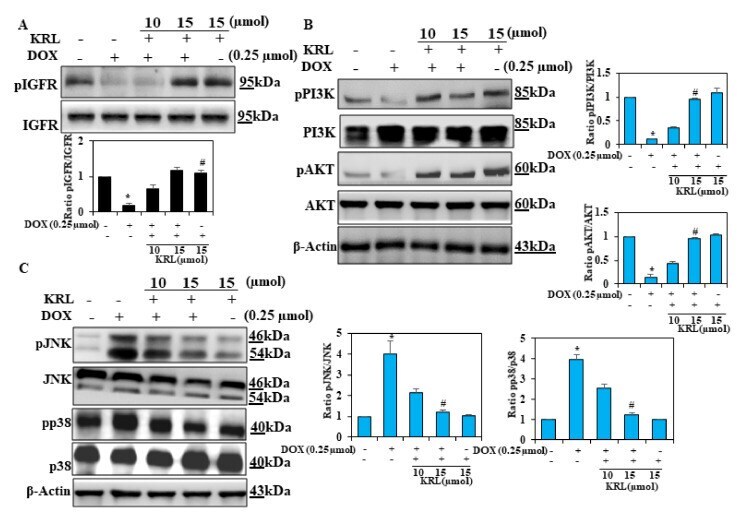
- Figure 3 KRL enhances cell survival mechanism. H9c2 cells were cultured in serum-free media for 3 h, followed by treatment with KRL for 2 h before or after DOX treatment, respectively. ( A , B ) KRL activates the IGF1R-mediated survival pathway in H9c2 cells. The expression of p-IGF1R, PI3K, p-PI3K, AKT, and p-AKT was analyzed by Western blotting. beta-actin was used as the internal control. ( C ) Representative Western blots showing the changes in MAPK signaling proteins (pP38 and pJNK) in H9c2 cells. Data are represented as the mean +- SD of triplicate values ( n = 3) and * p < 0.05 represents significant variations compared with the control. # p < 0.05 represents significant variations as compared to DOX alone and KRL with DOX treatment groups.
- Submitted by
- Invitrogen Antibodies (provider)
- Main image
- Experimental details
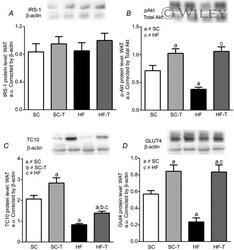
- Representative Western blot analysis of white adipose tissue for IRS-1 (A), p-Akt (B), TC10 (C) and GLUT4 (D) The average values were determined, and equal protein loading was confirmed by probing the blots with beta-actin antibodies. Data are reported as the means +- SEM, n = 5 in each group. Significant differences between the groups are indicated by symbols ( P < 0.05) and were determined by a one-way ANOVA and the Holm-Sidak post hoc test.

- Submitted by
- Invitrogen Antibodies (provider)
- Main image
- Experimental details
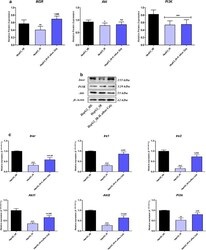
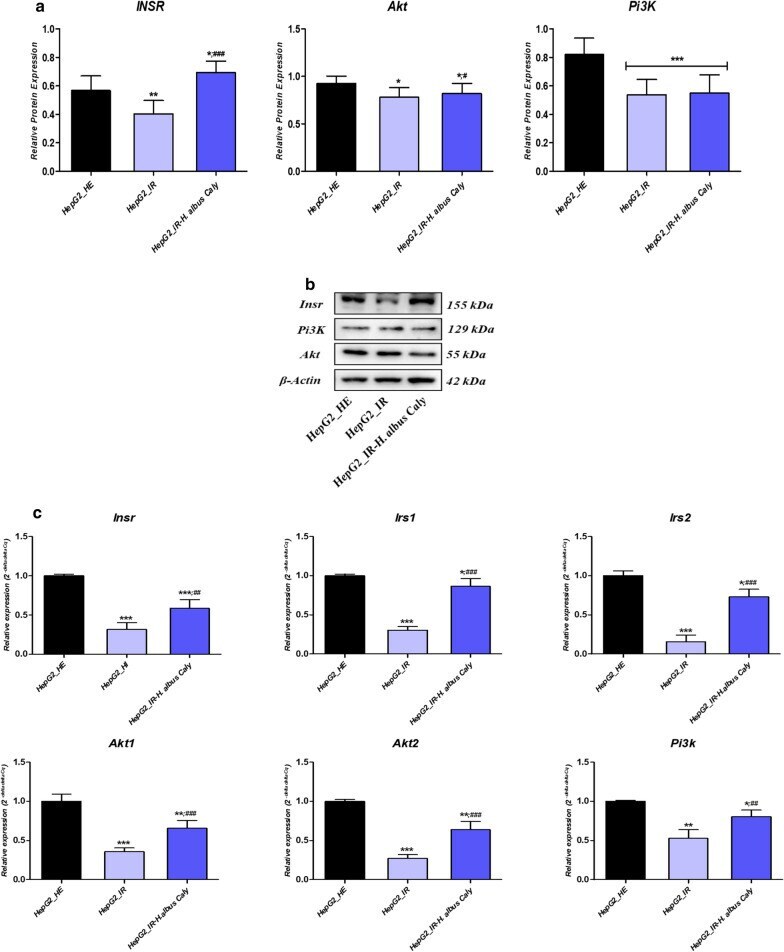
- Fig. 7 Effect of total calystegines on collapsed insulin signalling pathway in HI/HG HepG2 cells. a Quantitative analysis of insulin signalling-related proteins expression using western blot. b Representative blots images of insulin signalling-related proteins profiling. c Relative genes expression of key insulin signalling regulators. Representative data from three independent experiments are shown +- SD (n = 3). An asterisk (*) indicates a comparison of IR group to untreated healthy cells. A hashtag (#) indicates a comparison of IR group pre-treated with calystegines to IR untreated healthy cells. */# p < 0.05, **/## p < 0.01, ***/### p < 0.001. HepG2_HE: HepG2 healthy untreated cells; HepG2_IR: Insulin resistant HepG2 cells exposed to high concentrations of insulin and glucose. HepG2_IR- H. albus _Caly: Insulin resistant HepG2 cells exposed to high concentrations of insulin and glucose and pre-treated with 250 mug/ml calystegines extracted from Hyoscyamus albus seeds
- Submitted by
- Invitrogen Antibodies (provider)
- Main image
- Experimental details
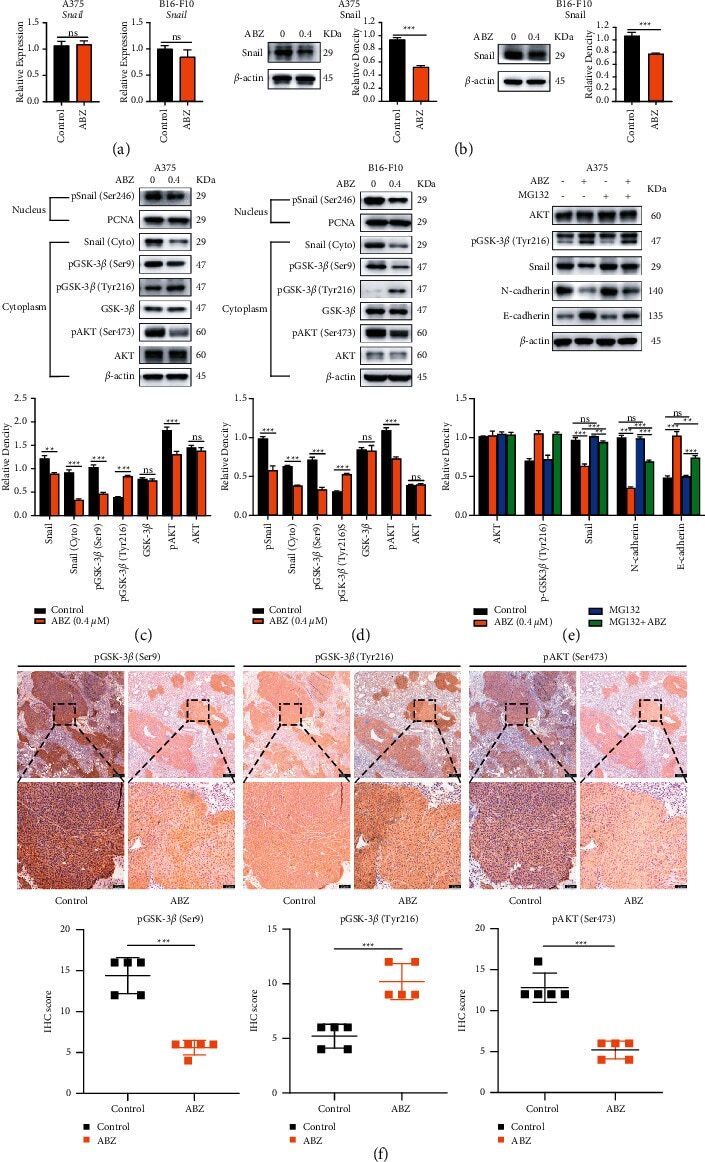
- Figure 4 ABZ treatment downregulates the snail expression in melanoma cells by increasing the accumulation of phosphorylated GSK-3 beta /Tyr216. (a) The relative transcription levels of Snail in the ABZ-treated (0.4 mu M) and control groups of A375 (left) and B16-F10 (right) melanoma cells were measured by RT-qPCR, with beta -actin as the internal control. (b) The expression of transcription factor Snail in A375 (left) and B16-F10 (right) cells was detected by western blot analysis, with beta -actin as the internal reference protein. (c-d) The expression levels of cytoplasmic proteins AKT, pAKT, GSK-3 beta , pGSK-3 beta (Ser9/Tyr216) and Snail, and nuclear protein pSnail in A375 and B16-F10 cells were also determined by western blotting, with beta -actin and PCNA as the internal controls for the cytoplasmic and nuclear proteins, respectively. The histograms show the relative density of AKT/pAKT, GSK-3 beta /pGSK-3 beta (Ser9/Tyr216), and Snail/p-Snail. (e) A375 cells were cotreated with or without MG132 and 0.4 mu M ABZ for 24 h western blot (up) was used to detect the expression levels of AKT, pGSK-3 beta /Tyr216, Snail, N-cadherin, and E-cadherin in the cytoplasm of A375 cells. The histogram (bottom) shows the relative density of AKT, pGSK-3 beta /Tyr216, Snail, E-cadherin, and N-cadherin. (f) Histogram showing the relative expression intensity of pGSK-3 beta (Ser9/Tyr216) and pAKT after immunohistochemical staining of mouse metastatic lung cancer tissues. Scale bars = 100
- Submitted by
- Invitrogen Antibodies (provider)
- Main image
- Experimental details
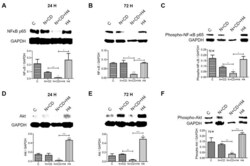
- Figure 6 Effect of FUS, alone and in combination with CDDO-me and/or nelfinavir, on both total and activated NF-kappaB and Akt protein levels in DU145 cells. The effect of combined treatment with nelfinavir and CDDO-me (CD), alone or in combination with FUS (N + CD + H4), on both total and activated (phosphorylated) NF-kappaB p65 ( A - C ) and Akt ( D - F ) protein levels is shown. Representative immunoblot images are in the top panel, along with the loading control (GAPDH). Bar graphs in each of the bottom panels of A-F show normalized densitometric values. Data are representative of three independent experiments ( n = 3). Significant changes from untreated controls or individual treatment groups are shown as p -values (* p < 0.05; ** p < 0.01; and *** p < 0.001). Unlike the recurrence of NF-kappaB and Akt levels in DU145 cells exposed to FUS alone (cf. Supplemental Figure S1 ), our three-treatment combination (N + CD + H4) abrogated the reactivation of these two crucial transcription factors.

- Submitted by
- Invitrogen Antibodies (provider)
- Main image
- Experimental details
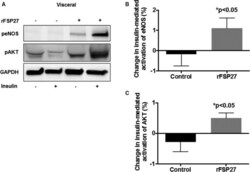
- Figure 3 Insulin-mediated activation of eNOS (endothelial NO synthase) and AKT (protein Kinase B) in response to recombinant FSP 27 in visceral depot. A , Representative visceral adipose tissue immunoblot demonstrating severe impairment in insulin-mediated activation of eNOS and AKT in visceral fat. After 24 hours of rFSP 27 (recombinant FSP 27) exposure, insulin-mediated activation is restored. B , Quantification of percent change in insulin-mediated activation of eNOS at baseline and after 24 hours of treatment with rFSP 27 in the visceral depot. C , Quantification of percent change in insulin-mediated activation of AKT at baseline and after 24 hours of treatment with rFSP 27 in the visceral depot (n=10, P

- Submitted by
- Invitrogen Antibodies (provider)
- Main image
- Experimental details
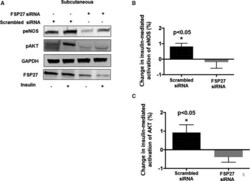
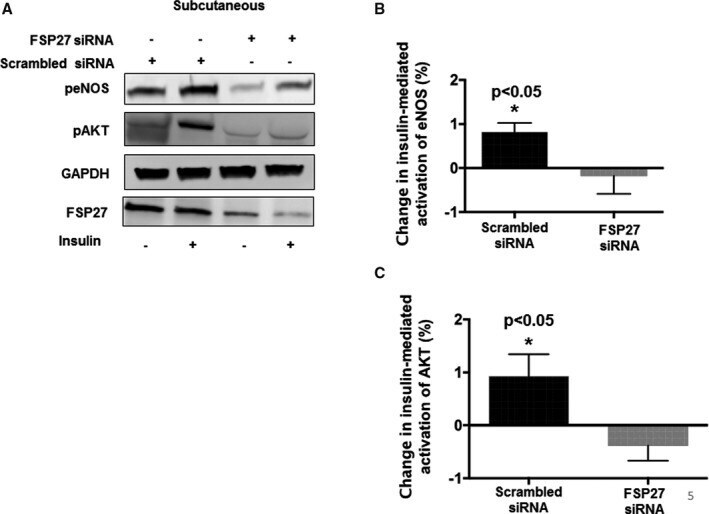
- Figure 5 Insulin-mediated activation of eNOS (endothelial NO synthase) and AKT (protein Kinase B) in response to si RNA -mediated knockdown of FSP 27 in the subcutaneous depot. A , Representative immunoblot demonstrating insulin-mediated activation of eNOS and AKT in subcutaneous fat under scrambled si RNA (small interfering RNA ) conditions and after knockdown of FSP 27 by si RNA . B , Quantification of percent change in insulin-mediated activation of eNOS at baseline and after si RNA -mediated knockdown of FSP 27 in the subcutaneous fat depot. C , Quantification of percent change in insulin-mediated activation of AKT at baseline and after si RNA -mediated knockdown of FSP 27 in subcutaneous fat depot (n=10, P
- Submitted by
- Invitrogen Antibodies (provider)
- Main image
- Experimental details
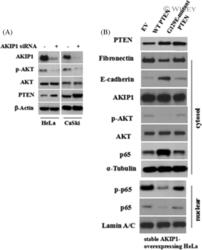
- 6 FIGURE AKIP1 Suppresses PTEN during the EMT. A, HeLa and CaSki cervical cancer cells were transfected with a control siRNA (siNC) or AKIP1 siRNA. The cell lysates were collected and the protein expression of PTEN, AKIP1, p-Akt, total Akt, and beta-Actin was detected using western blot. B, Stable AKIP1-expressing cells were transfected with EV, wild-type PTEN, or G129E-mutant PTEN plasmids. At 48 hours after transfection, cell lysates were harvested after cell fractionation. Levels of indicated proteins were determined using western blot analysis
