Explore
 Validate
 Learn
Learn Western blot
 ELISA
ELISA Immunocytochemistry
Antibody data
- Antibody Data
- Antigen structure
- References [16]
- Comments [0]
- Validations
- Immunocytochemistry [2]
- Flow cytometry [1]
- Other assay [12]
Submit
Validation data
Reference
Comment
Report error
- Product number
- 39-6400 - Provider product page

- Provider
- Invitrogen Antibodies
- Product name
- Nucleolin Monoclonal Antibody (ZN004)
- Antibody type
- Monoclonal
- Antigen
- Synthetic peptide
- Reactivity
- Human, Mouse
- Host
- Mouse
- Isotype
- IgG
- Antibody clone number
- ZN004
- Vial size
- 100 μg
- Concentration
- 0.5 mg/mL
- Storage
- -20°C
Submitted references A novel role for nucleolin in splice site selection.
Prevention of dsRNA-induced interferon signaling by AGO1x is linked to breast cancer cell proliferation.
Loss of PHF6 leads to aberrant development of human neuron-like cells.
Roniciclib down-regulates stemness and inhibits cell growth by inducing nucleolar stress in neuroblastoma.
Mutual Balance of Histone Deacetylases 1 and 2 and the Acetyl Reader ATAD2 Regulates the Level of Acetylation of Histone H4 on Nascent Chromatin of Human Cells.
Nucleolar Relocalization of RBM14 by Influenza A Virus NS1 Protein.
Class I Histone Deacetylase HDAC1 and WRN RECQ Helicase Contribute Additively to Protect Replication Forks upon Hydroxyurea-induced Arrest.
Morphological, Biochemical, and Functional Study of Viral Replication Compartments Isolated from Adenovirus-Infected Cells.
Molecular evolution and in vitro characterization of Botryllus histocompatibility factor.
CRISPR/Cas9 allows efficient and complete knock-in of a destabilization domain-tagged essential protein in a human cell line, allowing rapid knockdown of protein function.
Mitomycin C reduces abundance of replication forks but not rates of fork progression in primary and transformed human cells.
Nucleolar accumulation of APE1 depends on charged lysine residues that undergo acetylation upon genotoxic stress and modulate its BER activity in cells.
Nucleophosmin delocalization in thyroid tumour cells.
Two novel NPM1 mutations in a therapy-responder AML patient.
Secretome-based identification and characterization of potential biomarkers in thyroid cancer.
APE1/Ref-1 interacts with NPM1 within nucleoli and plays a role in the rRNA quality control process.
Shefer K, Boulos A, Gotea V, Arafat M, Ben Chaim Y, Muharram A, Isaac S, Eden A, Sperling J, Elnitski L, Sperling R
RNA biology 2022;19(1):333-352
RNA biology 2022;19(1):333-352
Prevention of dsRNA-induced interferon signaling by AGO1x is linked to breast cancer cell proliferation.
Ghosh S, Guimaraes JC, Lanzafame M, Schmidt A, Syed AP, Dimitriades B, Börsch A, Ghosh S, Mittal N, Montavon T, Correia AL, Danner J, Meister G, Terracciano LM, Pfeffer S, Piscuoglio S, Zavolan M
The EMBO journal 2020 Sep 15;39(18):e103922
The EMBO journal 2020 Sep 15;39(18):e103922
Loss of PHF6 leads to aberrant development of human neuron-like cells.
Fliedner A, Gregor A, Ferrazzi F, Ekici AB, Sticht H, Zweier C
Scientific reports 2020 Nov 4;10(1):19030
Scientific reports 2020 Nov 4;10(1):19030
Roniciclib down-regulates stemness and inhibits cell growth by inducing nucleolar stress in neuroblastoma.
Ognibene M, Pezzolo A
Scientific reports 2020 Jul 31;10(1):12902
Scientific reports 2020 Jul 31;10(1):12902
Mutual Balance of Histone Deacetylases 1 and 2 and the Acetyl Reader ATAD2 Regulates the Level of Acetylation of Histone H4 on Nascent Chromatin of Human Cells.
Lazarchuk P, Hernandez-Villanueva J, Pavlova MN, Federation A, MacCoss M, Sidorova JM
Molecular and cellular biology 2020 Apr 13;40(9)
Molecular and cellular biology 2020 Apr 13;40(9)
Nucleolar Relocalization of RBM14 by Influenza A Virus NS1 Protein.
Beyleveld G, Chin DJ, Moreno Del Olmo E, Carter J, Najera I, Cillóniz C, Shaw ML
mSphere 2018 Nov 14;3(6)
mSphere 2018 Nov 14;3(6)
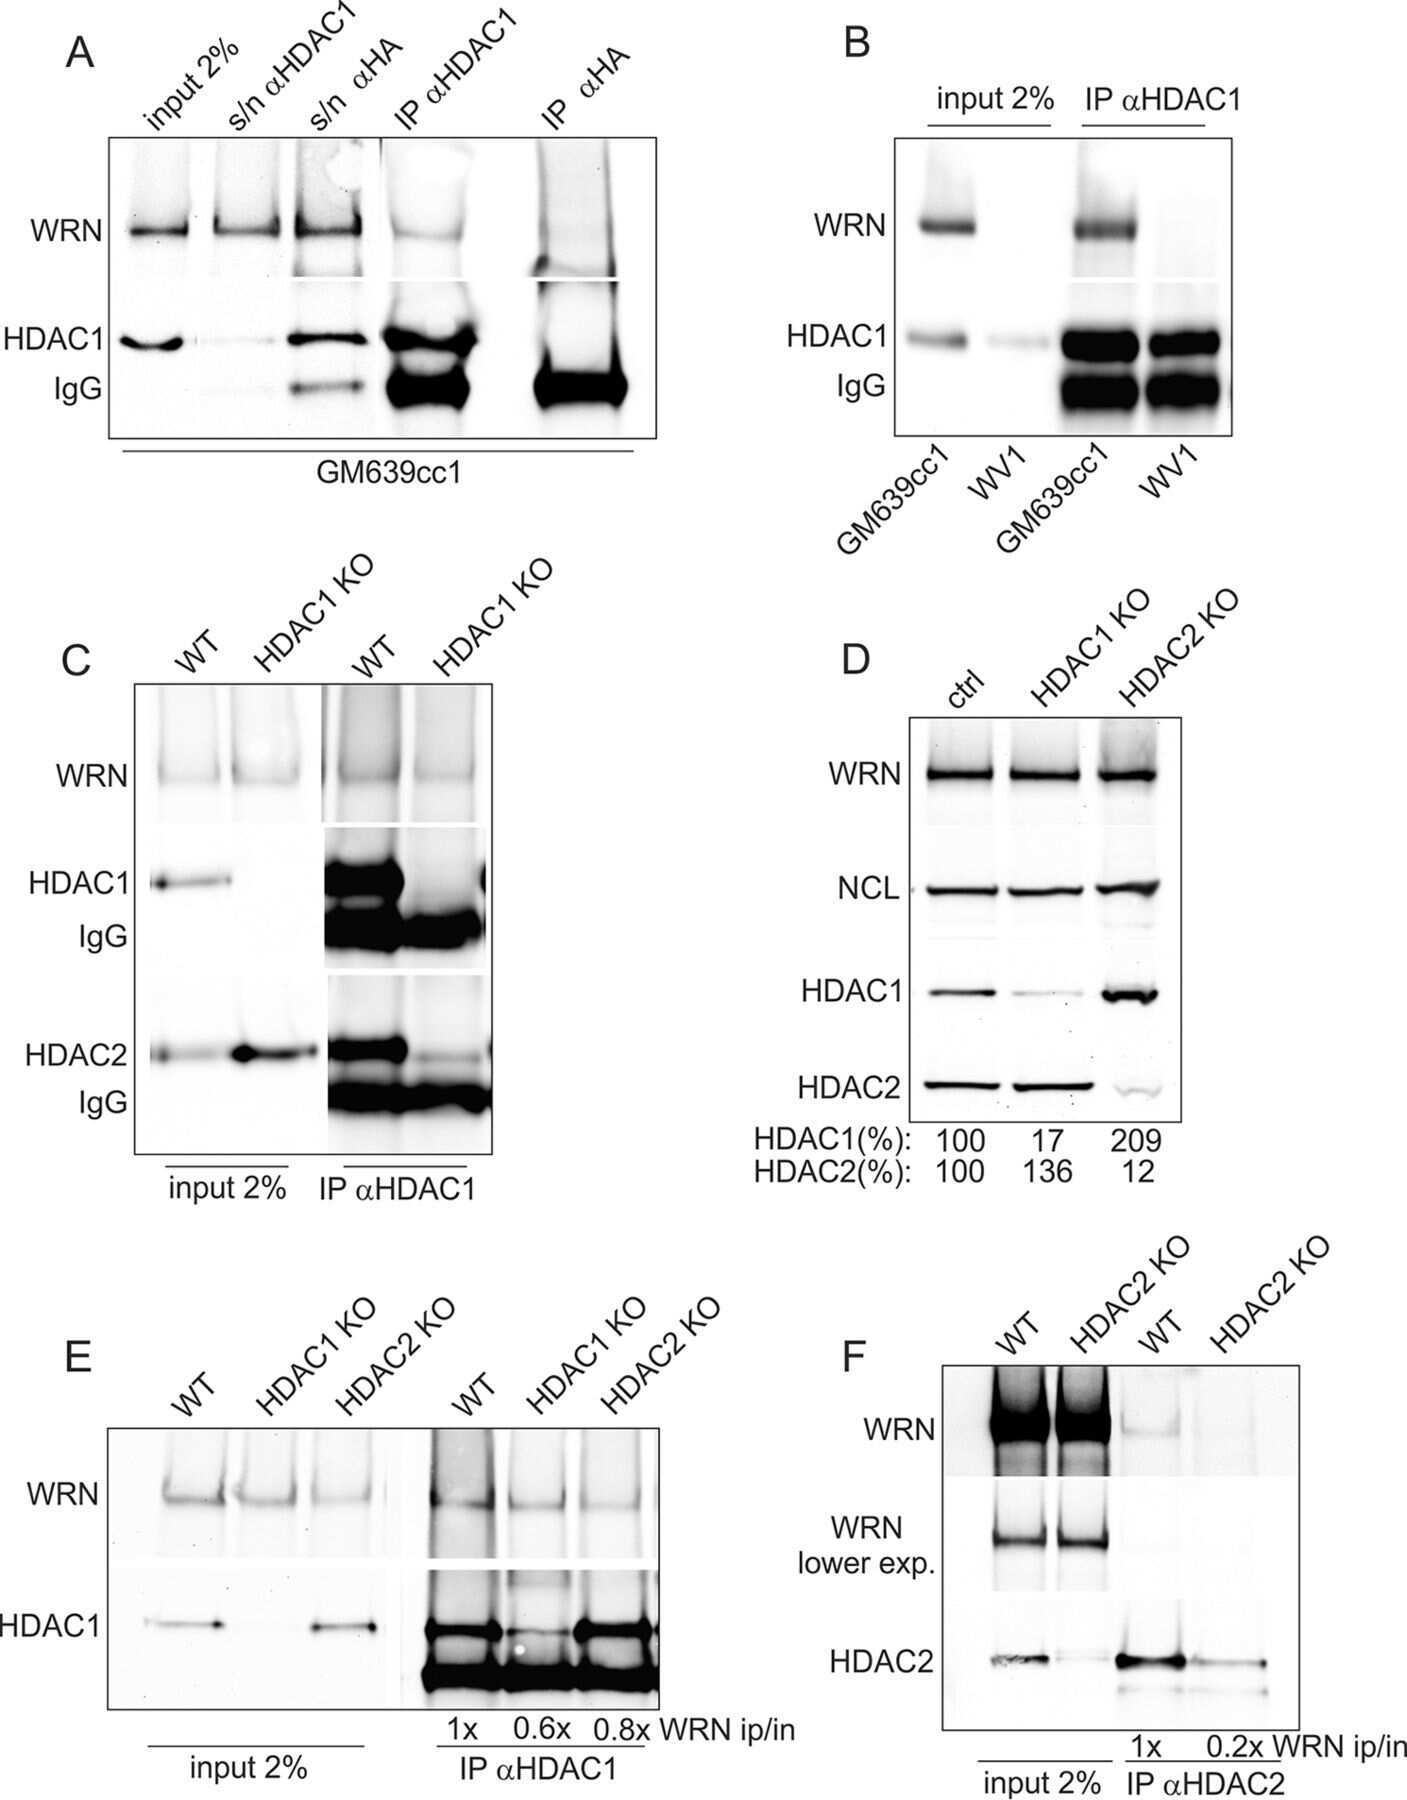
Class I Histone Deacetylase HDAC1 and WRN RECQ Helicase Contribute Additively to Protect Replication Forks upon Hydroxyurea-induced Arrest.
Kehrli K, Phelps M, Lazarchuk P, Chen E, Monnat R Jr, Sidorova JM
The Journal of biological chemistry 2016 Nov 18;291(47):24487-24503
The Journal of biological chemistry 2016 Nov 18;291(47):24487-24503
Morphological, Biochemical, and Functional Study of Viral Replication Compartments Isolated from Adenovirus-Infected Cells.
Hidalgo P, Anzures L, Hernández-Mendoza A, Guerrero A, Wood CD, Valdés M, Dobner T, Gonzalez RA
Journal of virology 2016 Jan 13;90(7):3411-27
Journal of virology 2016 Jan 13;90(7):3411-27
Molecular evolution and in vitro characterization of Botryllus histocompatibility factor.
Taketa DA, Nydam ML, Langenbacher AD, Rodriguez D, Sanders E, De Tomaso AW
Immunogenetics 2015 Oct;67(10):605-23
Immunogenetics 2015 Oct;67(10):605-23
CRISPR/Cas9 allows efficient and complete knock-in of a destabilization domain-tagged essential protein in a human cell line, allowing rapid knockdown of protein function.
Park A, Won ST, Pentecost M, Bartkowski W, Lee B
PloS one 2014;9(4):e95101
PloS one 2014;9(4):e95101
Mitomycin C reduces abundance of replication forks but not rates of fork progression in primary and transformed human cells.
Kehrli KR, Sidorova JM
Oncoscience 2014;1(7):540-555
Oncoscience 2014;1(7):540-555
Nucleolar accumulation of APE1 depends on charged lysine residues that undergo acetylation upon genotoxic stress and modulate its BER activity in cells.
Lirussi L, Antoniali G, Vascotto C, D'Ambrosio C, Poletto M, Romanello M, Marasco D, Leone M, Quadrifoglio F, Bhakat KK, Scaloni A, Tell G
Molecular biology of the cell 2012 Oct;23(20):4079-96
Molecular biology of the cell 2012 Oct;23(20):4079-96
Nucleophosmin delocalization in thyroid tumour cells.
Pianta A, Puppin C, Passon N, Franzoni A, Romanello M, Tell G, Di Loreto C, Bulotta S, Russo D, Damante G
Endocrine pathology 2011 Mar;22(1):18-23
Endocrine pathology 2011 Mar;22(1):18-23
Two novel NPM1 mutations in a therapy-responder AML patient.
Pianta A, Fabbro D, Damiani D, Tiribelli M, Fanin R, Franzoni A, Romanello M, Tell G, Di Loreto C, Damante G
Hematological oncology 2010 Sep;28(3):151-5
Hematological oncology 2010 Sep;28(3):151-5
Secretome-based identification and characterization of potential biomarkers in thyroid cancer.
Kashat L, So AK, Masui O, Wang XS, Cao J, Meng X, Macmillan C, Ailles LE, Siu KW, Ralhan R, Walfish PG
Journal of proteome research 2010 Nov 5;9(11):5757-69
Journal of proteome research 2010 Nov 5;9(11):5757-69
APE1/Ref-1 interacts with NPM1 within nucleoli and plays a role in the rRNA quality control process.
Vascotto C, Fantini D, Romanello M, Cesaratto L, Deganuto M, Leonardi A, Radicella JP, Kelley MR, D'Ambrosio C, Scaloni A, Quadrifoglio F, Tell G
Molecular and cellular biology 2009 Apr;29(7):1834-54
Molecular and cellular biology 2009 Apr;29(7):1834-54
No comments: Submit comment
Supportive validation
- Submitted by
- Invitrogen Antibodies (provider)
- Main image

- Experimental details
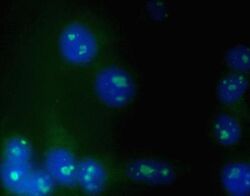
- Immunofluorescent analysis of K562 cells using Zymed Ms anti-Nucleolin (Product # 39-6400).

- Submitted by
- Invitrogen Antibodies (provider)
- Main image
- Experimental details
- Immunofluorescent analysis of K562 cells using Zymed Ms anti-Nucleolin (Product # 39-6400).

Supportive validation
- Submitted by
- Invitrogen Antibodies (provider)
- Main image
- Experimental details
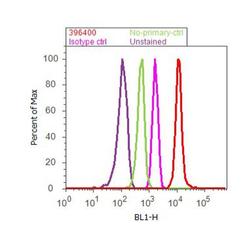
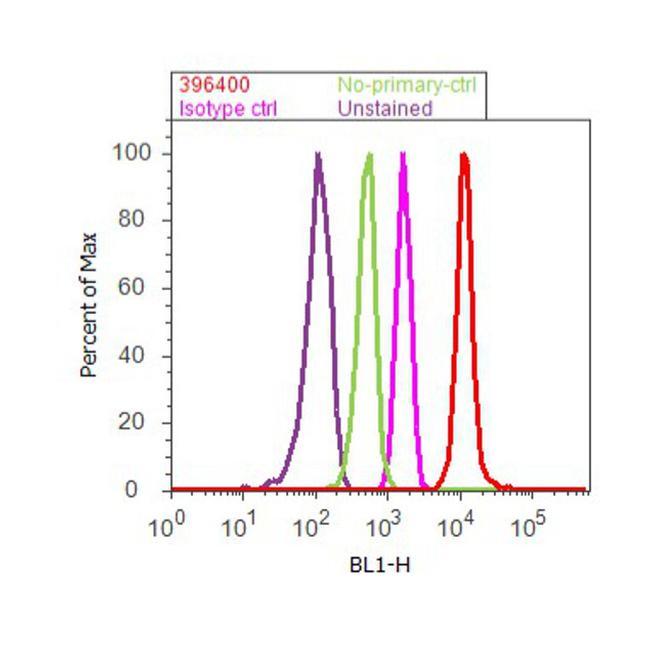
- Flow cytometry analysis of Nucleolin was done on Jurkat cells. Cells were fixed with 70% ethanol for 10 minutes, permeabilized with 0.25% Triton™ X-100 for 20 minutes, and blocked with 5% BSA for 30 minutes at room temperature. Cells were labeled with Nucleolin Mouse Monoclonal Antibody (396400, red histogram) or with mouse isotype control (pink histogram) at 3-5 ug/million cells in 2.5% BSA. After incubation at room temperature for 2 hours, the cells were labeled with Alexa Fluor® 488 Rabbit Anti-Mouse Secondary Antibody (A11059) at a dilution of 1:400 for 30 minutes at room temperature. The representative 10,000 cells were acquired and analyzed for each sample using an Attune® Acoustic Focusing Cytometer. The purple histogram represents unstained control cells and the green histogram represents no-primary-antibody control.
Supportive validation
- Submitted by
- Invitrogen Antibodies (provider)
- Main image

- Experimental details
- NULL
- Submitted by
- Invitrogen Antibodies (provider)
- Main image
- Experimental details
- NULL
- Submitted by
- Invitrogen Antibodies (provider)
- Main image

- Experimental details
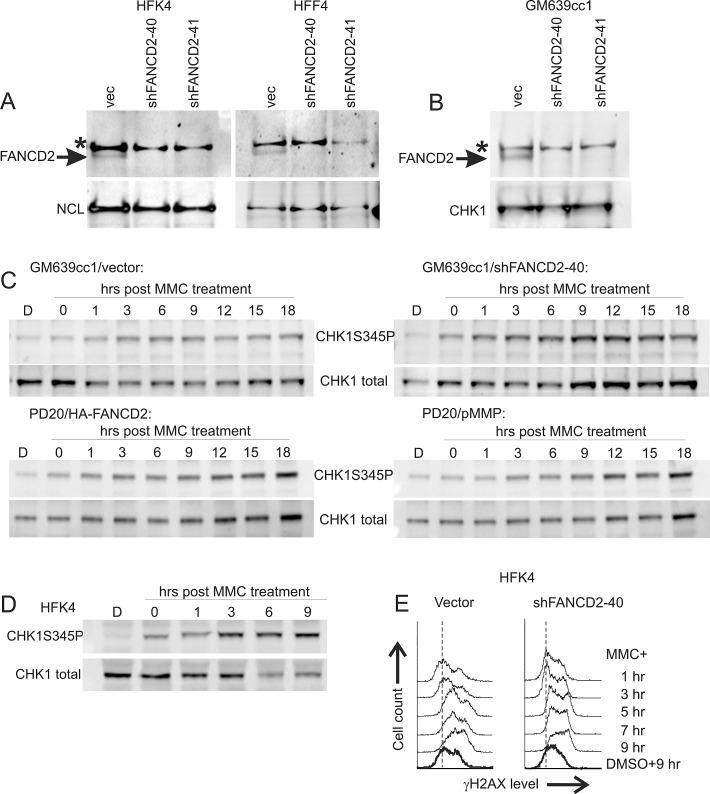
- Figure 1 Characterization of response to MMC in human fibroblasts and keratinocytes with and without FANCD2 deficiency A ) Western blots of FANCD2 expression in isogenic primary human keratinocytes HFK4 and fibroblasts HFF4 infected with an empty lentiviral vector pLKO.1 (vec) or vectors expressing two different shRNAs against FANCD2. B ) A Western blot of GM639cc1 SV40 fibroblasts infected with the same lentiviral constructs. NCL, nucleolin, or CHK1 were used as internal controls. An asterisk denotes a nonspecific band typical of the antibody used. C ) Western blots visualizing phospho-CHK1 (Serine 345-phosphorylated) and total CHK1 in GM639cc1 cells with and without FANCD2 depletion and in PD20 fancd2-/- fibroblasts with and without HA-FANCD2 complementation. pMMP is an empty vector used to stably transfect PD20 fancd2-/- fibroblasts as a control. Cells were allowed to recover for up to 18 hrs after MMC treatment (25muM/1hr). D ) A Western blot of HFK4 cells treated with 25muM of MMC for 1hr and allowed to recover for indicated times before harvest. D: DMSO (vehicle) treated control. Serine 345-phosphorylated (CHK1S345P) and total CHK1 were visualized. E) Flow cytometry profiles of control (vector) or FANCD2-depleted HFK4 cells recovering from MMC (25muM /1hr) for indicated times, and DMSO-treated controls. Cells were stained for gammaH2AX expression.
- Submitted by
- Invitrogen Antibodies (provider)
- Main image
- Experimental details
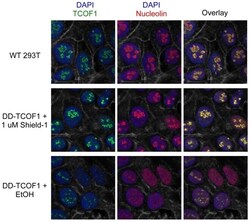
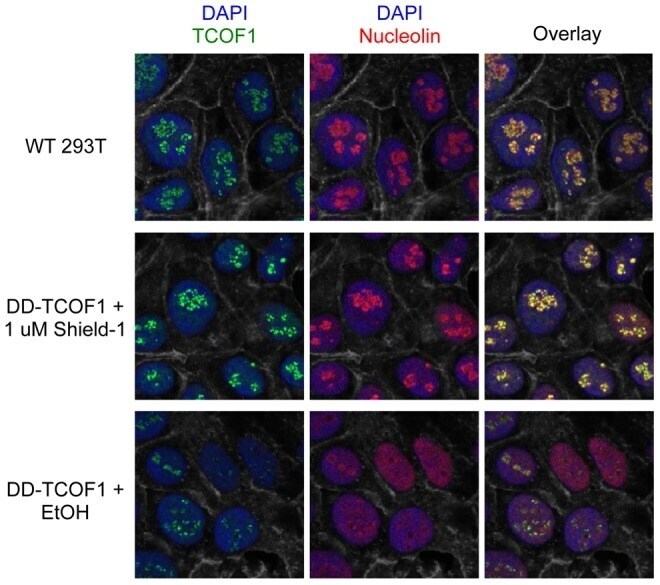
- Figure 3 DD-TCOF1 retains the nucleolar localization of wild-type TCOF1. Knock-in cells in Shield-1 or ethanol vehicle alone and parental wild-type 293T cells were stained and imaged as described in Materials and Methods. A single representative z-slice confocal image is shown. The visible grayscale cell boundaries represent F-actin (stained with phalloidin).
- Submitted by
- Invitrogen Antibodies (provider)
- Main image
- Experimental details
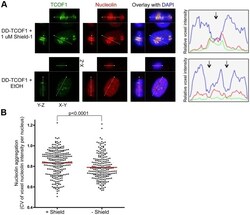
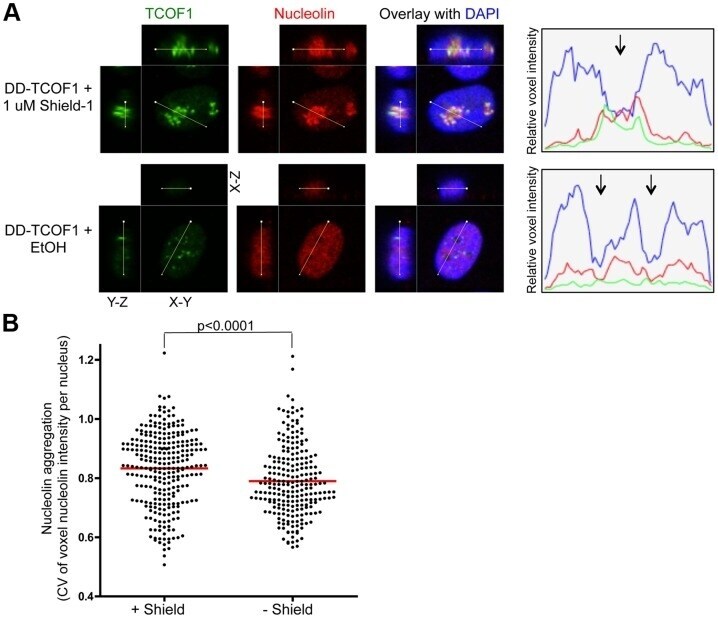
- Figure 4 Destabilization of TCOF1 results in dispersal of nucleolin. ( A ) The relative fluorescence intensities across the indicated lines are shown in the graph, and the arrows indicate the position of nucleoli as defined by a hole in the DAPI stain. Representative nuclei from knock-in cells in Shield-1 or ethanol vehicle alone are shown. ( B ) The aggregation of nucleolin was measured by the coefficient of variation (CV, stdev/mean) of nucleolin voxel intensities within DAPI-defined nuclei in 3D reconstructions, as described in Materials and Methods. As examples, this CV metric was 0.95 for the +Shield nucleus and 0.71 for the -Shield nucleus in panel A. The population means are indicated by the red lines. There is significantly less nucleolin aggregation in knock-in cell nuclei in the absence of Shield-1, p
- Submitted by
- Invitrogen Antibodies (provider)
- Main image
- Experimental details
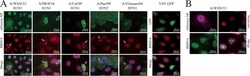
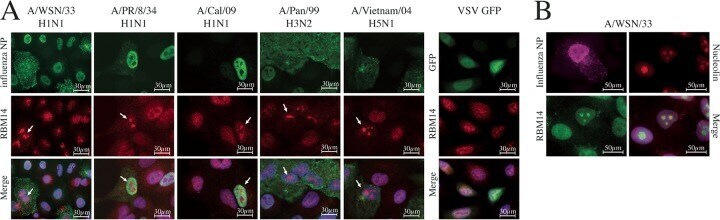
- FIG 5 RBM14 relocalizes to the nucleolus in IAV-infected cells. (A) Wide-field immunofluorescence microscopy images show that RBM14 relocalizes to a distinct subnuclear compartment in IAV-infected cells. A549 cells were infected with the indicated influenza A viruses at an MOI of 1.0 and were fixed 6 h postinfection. The cells were stained with anti-RBM14 antibody (red), anti-IAV NP antibody (green), and DAPI nuclear stain (blue). RBM14 relocalization (indicated by white arrows) was observed with a range of influenza A virus subtypes but not with vesicular stomatitis virus (VSV; far right panel). Magnification, x63. Scale bars are indicated on the figure. (B) WSN-infected A549 cells were stained with anti-nucleolin antibody (red), and it was observed that this staining coincided with anti-RBM14 staining (green) in infected cells (stained with anti-IAV NP antibody; magenta), indicating that IAV drives RBM14 to the nucleolus in infected cells. Magnification, x63. Scale bars are indicated on the figure.
- Submitted by
- Invitrogen Antibodies (provider)
- Main image
- Experimental details
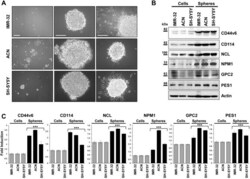
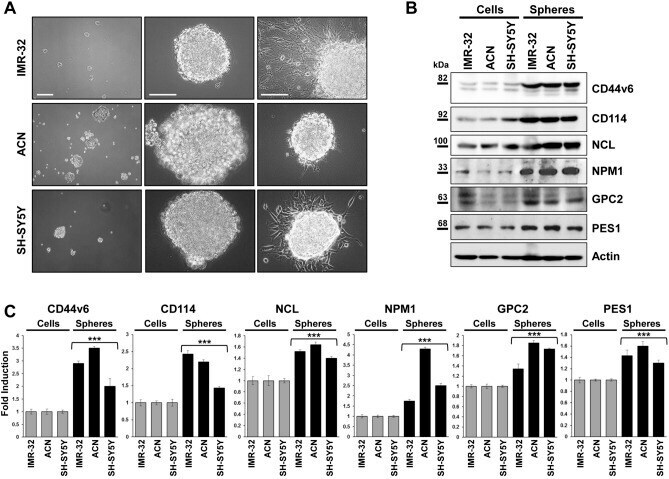
- Figure 1 Neuroblastoma tumor spheres show high levels of cancer stem cell surface markers and of key nucleolar proteins. ( A ) Neurospheres derived from IMR-32, ACN and SH-SY5Y neuroblastoma cell lines cultured for three days in serum-free medium and in non-adherent conditions. Spheres show differences in number and dimensions (left photos), cells aggregation (middle photos) and adhesion ability (right photos). (Scale bars: 200 um on the left and 100 um in the middle and on the right). ( B ) Protein lysates from IMR-32, ACN and SH-SY5Y cell lines and from neurospheres derived by each cell line were collected and subjected to Western blot analysis with anti-CD44v6, anti-CD114, anti-Nucleolin (NCL), anti-Nucleophosmin-1 (NPM1), anti-Glypican-2 (GPC2) and anti-Pescadillo Ribosomal Biogenesis Factor-1 (PES1) antibodies. Cropped blots are shown here, and black lines indicate where one part of the blot ends and another begins. Supplementary Figure S5 shows the entire blots images. ( C ) Neurospheres protein levels were quantified by densitometry, normalized to those of each cell line (fold induction = 1) and to the content of the loading control protein (Actin), then visualized by histograms. Data are representative of three independent experiments +- SD (*** p < 0.001).
- Submitted by
- Invitrogen Antibodies (provider)
- Main image

- Experimental details
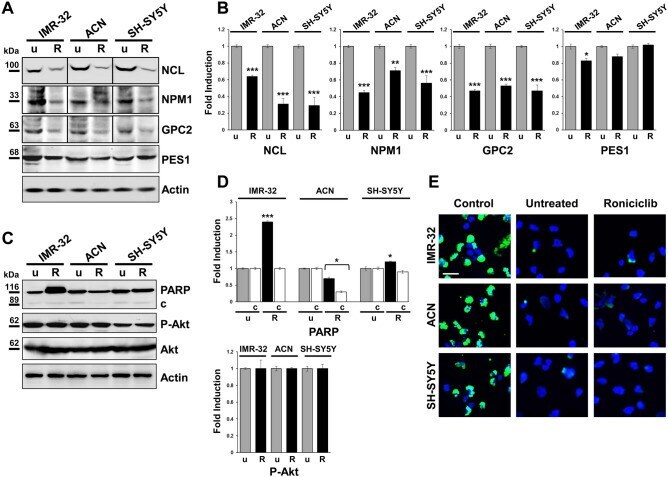
- Figure 7 Roniciclib limits nucleolar proteins expression without influencing neuroblastoma cells apoptosis. ( A, C ) Protein lysates from IMR-32, ACN and SH-SY5Y cell lines untreated (u = Roniciclib 0 uM) or treated with Roniciclib (R) 1 uM, 20 uM and 5 uM respectively for 72 h were collected and subjected to Western blot analysis with anti-NCL, anti-NPM1, anti-GPC2, anti-PES1, anti-PARP (c = cleaved PARP), and anti-phospho-Akt (P-Akt) antibodies. Cropped blots are shown here, and black lines indicate where one part of the blot ends and another begins. Supplementary Figure S7 , panels 1-2, shows the entire blots images. ( B, D ) Protein levels of the Roniciclib treated cells were quantified by densitometry, normalized to those of the untreated cells (fold induction = 1) and to the content of the loading control protein (Actin or total Akt), then visualized by histograms. Data are representative of three independent experiments +- SD (* p < 0.05; ** p < 0.01; *** p < 0.001). ( E ) Immunofluorescence analysis of IMR-32, ACN and SH-SY5Y cell lines untreated (Roniciclib 0 uM) or treated with Roniciclib for 72 h, using TUNEL staining (green) to reveal DNA strand breaks generated during apoptosis. NB cells pre-treated with DNase I were used as positive controls. Cells were counterstained with DAPI to visualize nuclei (blue). (Scale bar: 20 um).
- Submitted by
- Invitrogen Antibodies (provider)
- Main image
- Experimental details
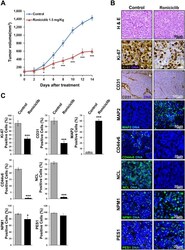
- Figure 8 Roniciclib reduces tumor growth in a neuroblastoma xenograft model. 1 x 10 6 IMR-32 cells were injected in the capsule f the left adrenal gland of nude mice. Mice received oral administration of vehicle control (n = 10) or of Roniciclib (1.5 mg/kg once daily) (n = 10) upon tumor growth. ( A ) Curves indicate tumor volume with vehicle control or with Roniciclib treatment over 14 days. ( B ) In vivo characterization of orthotopic neuroblastoma after 14 days of control vehicle or Roniciclib treatment. For histological analysis, sections were stained with hematoxylin and eosin (H & E). Serial sections were treated by immunohistochemistry with anti-Ki-67 and anti-CD31 (brown) antibodies and by immunofluorescence with anti-MAP2, anti-CD44v6, anti-NCL, anti-NPM1 and PES1 (all green) antibodies. Cells nuclei are counterstained with hematoxylin (violet) or with DAPI (blue). ( C ) The histograms represent the percentage of Ki-67 + , CD31 + , MAP2 + , CD44v6 + , NCL + , NPM1 + and PES1 + cells. Data are representative of three independent observations +- SD (* p < 0.05; *** p < 0.001).

- Submitted by
- Invitrogen Antibodies (provider)
- Main image
- Experimental details
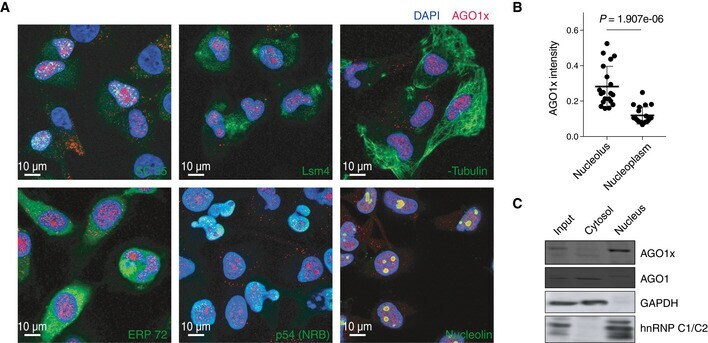
- Figure 2 AGO1x localizes to the nuclear region Representative immunofluorescence images showing the subcellular distribution of AGO1x (red) relative to nuclear and cytoplasmic markers. DAPI was used to mark the nucleus (blue). The co-stained subcellular marker is indicated in each panel in green. SC 35, Lsm4, alpha-tubulin, ERP72, p54 (NRB), and nucleolin serve as markers for nuclear speckles, cytosol and nucleus, cytosol, endoplasmic reticulum, paraspeckle, and nucleolus, respectively. Mean (+- SD) pixel intensities of AGO1x staining in nucleolus and nucleoplasm, computed from z-stack images of MDA-MB-231 cells ( n = 20). The P -value was determined using a paired two-tailed t -test. Representative AGO1x and AGO1 blot from MDA-MB-231 cell fractions. GAPDH and hnRNP C1/C2 served as markers of purity of the individual fractions. Source data are available online for this figure.
- Submitted by
- Invitrogen Antibodies (provider)
- Main image

- Experimental details
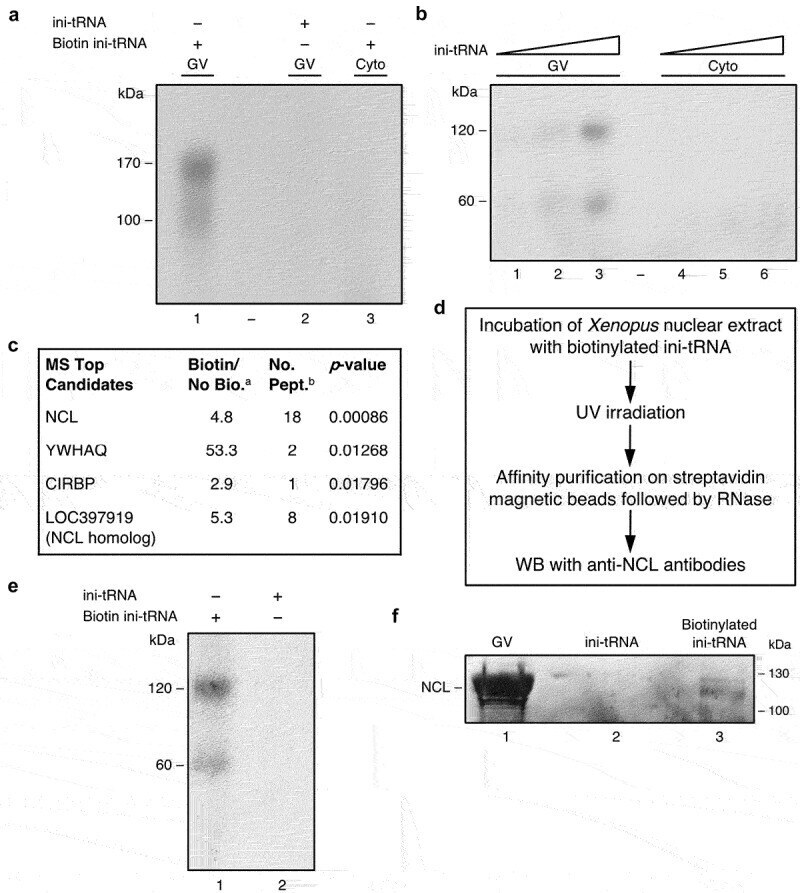
- Figure 2. NCL is directly bound to ini-tRNA in the nucleus. ( A, B ) Proteins bound to ini-tRNA in nuclear extracts. Increasing quantities of in vitro transcribed biotinylated 32 P-labelled ini-tRNA were incubated with nuclear (lanes 1-3) and cytoplasmic (lanes 4-6) extracts, UV crosslinked and affinity purified on streptavidin magnetic beads and run on SDS PAGE before ( A ) or after ( B ) RNase treatment. ( C ) Significant peptides associated with ini-tRNA in the nucleus based on mass spectrometry analysis; a Bio/noBio indicates the fold change in biotin versus no biotin, average of three biological experiments; b number of peptides (see also Table S1 ). ( D ) Scheme of the experiment described in E, F confirming NCL binding to ini-tRNA. ( E ) In vitro transcribed biotinylated 32 P-labelled ini-tRNA was incubated with nuclear extract of Xenopus oocytes, UV crosslinked, and subjected to affinity purification on streptavidin magnetic beads, and run on SDS PAGE after RNase digestion (lane 1), and control non-biotinylated 32 P-labelled ini-tRNA that went through the same procedure (lane 2). ( F ) Analogous experiment, followed by WB with anti-NCL antibodies. Left , GVs; middle , control non-biotinylated ini-tRNA; right , biotinylated ini-tRNA.
- Submitted by
- Invitrogen Antibodies (provider)
- Main image
- Experimental details
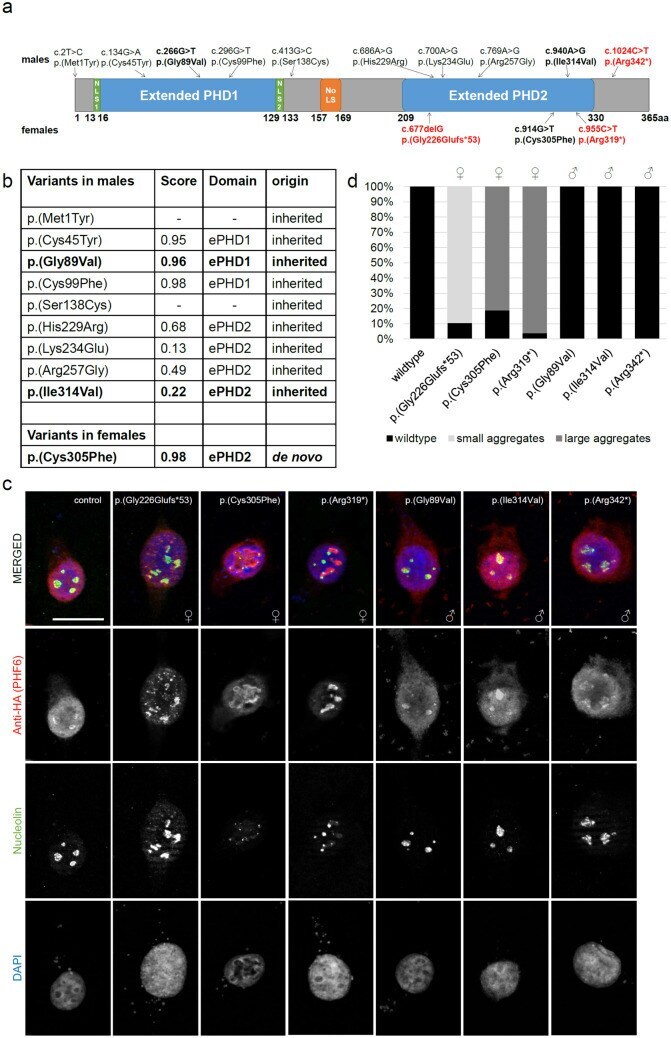
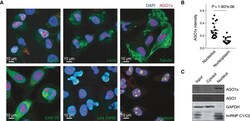
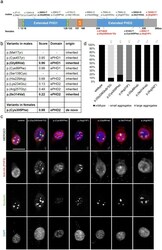
- Figure 1 Overexpression analysis of variants in PHF6 from females vs males. ( a ) Protein scheme of PHF6 (Q8IWS0) with all missense variants previously published in male and female individuals ,,,,, as well as three selected truncating variants , analysed via immunofluorescence coloured in red. Analysed variants (immunofluorescence) are printed in bold. Coding domains (according to uniprot ) are displayed in colour. NLS nuclear localization domain, NoLS nucleolar localization domain. ( b ) Table including all published missense variants occurring in male and female individuals, their VIPUR score, their localization in regard to ePHD and their origin (inherited/de novo). Variants p. (Met1Tyr) and p. (Ser138Cys) do not reside in a domain and cannot be modelled. Analysed variants (immunofluorescence) are printed in bold. ePHD extended atypical PHD-like zinc finger domain, 1 = N-terminal, 2 = C-terminal. ( c ) Immunofluorescence of HEK-293 cells transiently transfected with HA-tagged wildtype or mutant PHF6 co-stained with nucleolin (NCL). While wildtype PHF6 was expressed in the nucleoplasm as well as the nucleolus co-localizing with NCL, all three variants occurring in females led to an accumulation of PHF6 into aggregates, partly co-localizing with NCL. The truncating variant c.677delG (p. (Gly226Glufs*53)) resulted in small and more aggregates in the nucleus, and the two variants in the C-terminal ePHD resulted in large PHF6 aggregates while the expression of aberrant PHF6 in