 Explore
 Validate
 Learn
Learn Western blot
Antibody data
- Antibody Data
- Antigen structure
- References [0]
- Comments [0]
- Validations
- Western blot [3]
- Immunohistochemistry [3]
- Other assay [35]
Submit
Validation data
Reference
Comment
Report error
- Product number
- 44-680G - Provider product page

- Provider
- Invitrogen Antibodies
- Product name
- Phospho-ERK1/ERK2 (Thr185, Tyr187) Polyclonal Antibody
- Antibody type
- Polyclonal
- Antigen
- Synthetic peptide
- Description
- Purified from rabbit serum by sequential epitope-specific chromatography, this product contains enough material for 10 mini-blots. The antibody has been negatively preadsorbed using a non-phosphopeptide corresponding to the sites of phosphorylation to remove antibody that is reactive with non-phosphorylated ERK1&2. The final product is generated by affinity chromatography using an ERK1&2-derived peptide that is phosphorylated at threonine 202/185 and tyrosine 204/187, respectively, within the activation loop. This antibody has been used in western blotting and previous lots have been used in immunostaining. Other applications may work but have not been tested. The positive control used in western analysis were PC12 cells +/- Sorbitol; NIH3T3 +/- PDGF; and HEK293 +/- UV.
- Reactivity
- Human, Mouse, Rat, Bovine, Chicken/Avian, Drosophila, Xenopus
- Host
- Rabbit
- Isotype
- IgG
- Vial size
- 100 µL
- Storage
- -20°C
No comments: Submit comment
Supportive validation
- Submitted by
- Invitrogen Antibodies (provider)
- Main image
- Experimental details
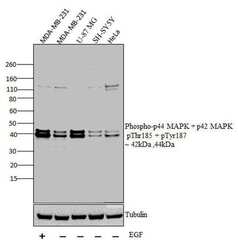
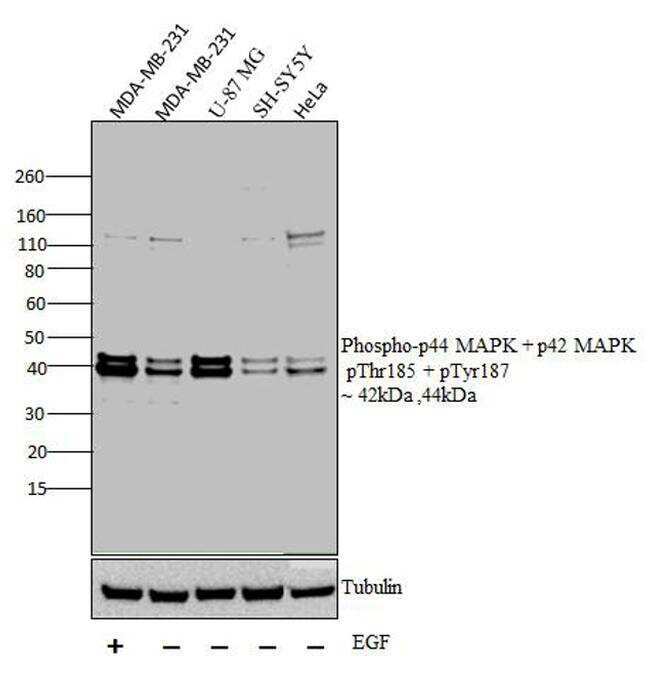
- Western blot analysis was performed on whole cell extracts (30 µg lysate) of MDA-MB-231 with treatment of EGF(100 ng/mL for 15 mins) (Lane 1), MDA-MB-231 (Lane 2), U-87 MG (Lane 3),, SH-SY5Y (Lane 4) and HeLa (Lane 5). The blots were probed with Anti-Phospho-p44 MAPK + p42 MAPK pThr185 + pTyr187 Rabbit polyclonal Antibody (Product# 44680G, 1 in 1000 dilution) and detected by chemiluminescence Goat anti-Rabbit IgG (H+L) Secondary Antibody, HRP conjugate (Product # G-21234, 1:5000 dilution). Bands of 42 kDa and 44 kDa corresponding to Phospho-p44 MAPK + p42 MAPK pThr185 + pTyr187 was observed across cell lines tested. Known quantity of protein samples were electrophoresed using Novex® NuPAGE® 12 % Bis-Tris gel (Product # NP0341BOX), XCell SureLock™ Electrophoresis System (Product # EI0002) and Novex® Sharp Pre-Stained Protein Standard (Product # LC5800). Resolved proteins were then transferred onto a nitrocellulose membrane with iBlot® 2 Dry Blotting System (Product # IB21001). The membrane was probed with the relevant primary and secondary Antibody following blocking with 5 % skimmed milk. Chemiluminescent detection was performed using Pierce™ ECL Western Blotting Substrate (Product # 32106).
- Submitted by
- Invitrogen Antibodies (provider)
- Main image
- Experimental details
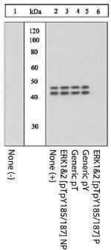
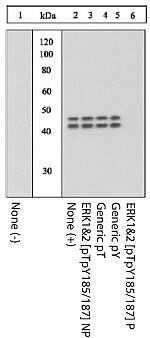
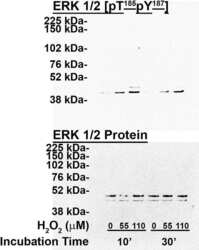
- Extracts of PC12 cells unstimulated (1) or stimulated with 0.5 M sorbitol for 5 minutes (2-6) were resolved by SDS-PAGE on a 10% Tris-glycine gel and transferred to PVDF. The membrane was blocked with a 5% BSA-TBST buffer overnight at 4°C, and then incubated with the ERK1&2 (pTpY 185/187) antibody for two hours at room temperature in a 3% BSA-TBST buffer, following its prior incubation with: no peptide (1, 2), the non-phosphopeptide corresponding to the phosphopeptide immunogen (3), a generic phosphothreonine-containing peptide (4), a generic phosphotyrosine-containing peptide (5), or the phosphopeptide immunogen (6). After washing, the membrane was incubated with goat F (ab')2 anti-rabbit IgG HRP conjugate (Product # ALI4404) and signals were detected using the Pierce SuperSignal™ method.
- Submitted by
- Invitrogen Antibodies (provider)
- Main image
- Experimental details
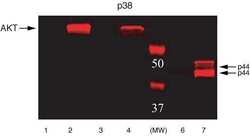
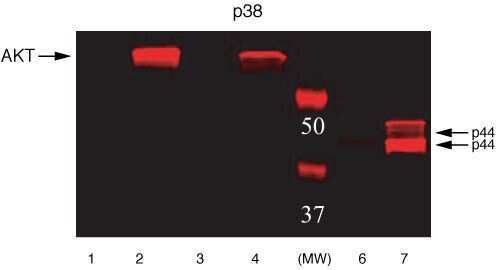
- ERK1&2 (pTpY185/187) phosphospecific antibody. NIH3T3 or NIH3T3-L1 cells were treated with either PDGF or Insulin. Western Blots were performed using either Akt (pS473) (Product # 44-622G) or Erk (pTpY185/187) (Product # 44-680G) primary antibodies. Anti-rabbit secondary antibody conjugated to Alexa fluor 680 was used for detection. Data was analyzed on the LI-COR Odyssey® Infrared Imaging System. Akt (pS473): Lane 1 - NIH3T3 control, 20 µg; Lane 2 - NIH3T3 + PDGF, 20 µg; Lane 3 - NIH3T3-L1 control, 20 µg; Lane 4 - NIH3T3-L1 + Insulin, 20 µg. Erk (pTpY185/187): Lane 6 - NIH3T3 control, 5 µg; Lane 7 - NIH3T3 + PDGF, 5 µg.
Supportive validation
- Submitted by
- Invitrogen Antibodies (provider)
- Main image
- Experimental details
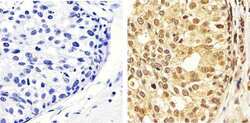
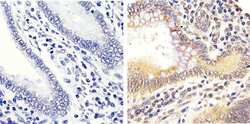
- Immunohistochemistry analysis of ERK1/2 (pTpY185/187) showing staining in the cytoplasm and nucleus of paraffin-embedded human breast carcinoma tissue (right) compared to a negative control without primary antibody (left). To expose target proteins, antigen retrieval was performed using 10mM sodium citrate (pH 6.0), microwaved for 8-15 min. Following antigen retrieval, tissues were blocked in 3% H2O2-methanol for 15 min at room temperature, washed with ddH2O and PBS, and then probed with a ERK1/2 (pTpY185/187) polyclonal antibody (Product # 44-680G) diluted in 3% BSA-PBS at a dilution of 1:50 overnight at 4ºC in a humidified chamber. Tissues were washed extensively in PBST and detection was performed using an HRP-conjugated secondary antibody followed by colorimetric detection using a DAB kit. Tissues were counterstained with hematoxylin and dehydrated with ethanol and xylene to prep for mounting.
- Submitted by
- Invitrogen Antibodies (provider)
- Main image
- Experimental details
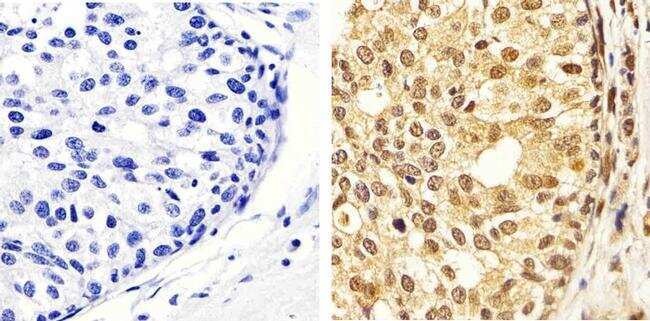
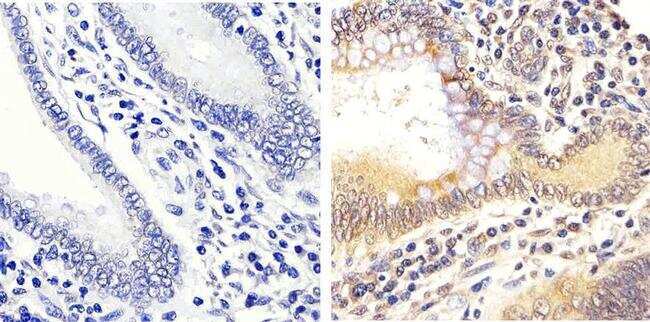
- Immunohistochemistry analysis of ERK1/2 (pTpY185/187) showing staining in the cytoplasm and nucleus of paraffin-embedded human colon carcinoma tissue (right) compared to a negative control without primary antibody (left). To expose target proteins, antigen retrieval was performed using 10mM sodium citrate (pH 6.0), microwaved for 8-15 min. Following antigen retrieval, tissues were blocked in 3% H2O2-methanol for 15 min at room temperature, washed with ddH2O and PBS, and then probed with a ERK1/2 (pTpY185/187) polyclonal antibody (Product # 44-680G) diluted in 3% BSA-PBS at a dilution of 1:20 overnight at 4ºC in a humidified chamber. Tissues were washed extensively in PBST and detection was performed using an HRP-conjugated secondary antibody followed by colorimetric detection using a DAB kit. Tissues were counterstained with hematoxylin and dehydrated with ethanol and xylene to prep for mounting.
- Submitted by
- Invitrogen Antibodies (provider)
- Main image
- Experimental details
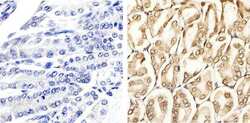
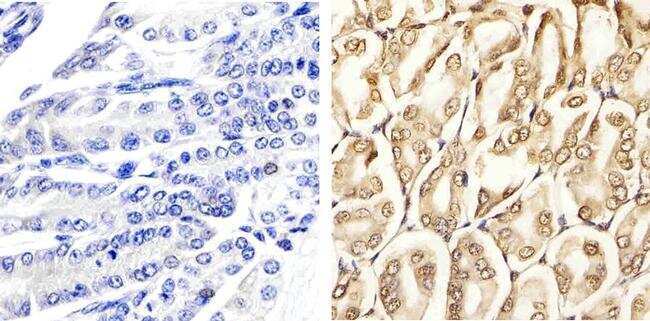
- Immunohistochemistry analysis of ERK1/2 (pTpY185/187) showing staining in the cytoplasm and nucleus of paraffin-embedded mouse stomach tissue (right) compared to a negative control without primary antibody (left). To expose target proteins, antigen retrieval was performed using 10mM sodium citrate (pH 6.0), microwaved for 8-15 min. Following antigen retrieval, tissues were blocked in 3% H2O2-methanol for 15 min at room temperature, washed with ddH2O and PBS, and then probed with a ERK1/2 (pTpY185/187) polyclonal antibody (Product # 44-680G) diluted in 3% BSA-PBS at a dilution of 1:20 overnight at 4ºC in a humidified chamber. Tissues were washed extensively in PBST and detection was performed using an HRP-conjugated secondary antibody followed by colorimetric detection using a DAB kit. Tissues were counterstained with hematoxylin and dehydrated with ethanol and xylene to prep for mounting.
Supportive validation
- Submitted by
- Invitrogen Antibodies (provider)
- Main image

- Experimental details
- NULL
- Submitted by
- Invitrogen Antibodies (provider)
- Main image
- Experimental details
- NULL
- Submitted by
- Invitrogen Antibodies (provider)
- Main image
- Experimental details
- NULL
- Submitted by
- Invitrogen Antibodies (provider)
- Main image
- Experimental details
- NULL
- Submitted by
- Invitrogen Antibodies (provider)
- Main image

- Experimental details
- NULL
- Submitted by
- Invitrogen Antibodies (provider)
- Main image
- Experimental details
- NULL
- Submitted by
- Invitrogen Antibodies (provider)
- Main image

- Experimental details
- NULL
- Submitted by
- Invitrogen Antibodies (provider)
- Main image
- Experimental details
- NULL
- Submitted by
- Invitrogen Antibodies (provider)
- Main image
- Experimental details
- NULL
- Submitted by
- Invitrogen Antibodies (provider)
- Main image
- Experimental details
- NULL

- Submitted by
- Invitrogen Antibodies (provider)
- Main image
- Experimental details
- NULL

- Submitted by
- Invitrogen Antibodies (provider)
- Main image
- Experimental details
- NULL
- Submitted by
- Invitrogen Antibodies (provider)
- Main image
- Experimental details
- NULL

- Submitted by
- Invitrogen Antibodies (provider)
- Main image

- Experimental details
- NULL
- Submitted by
- Invitrogen Antibodies (provider)
- Main image
- Experimental details
- NULL

- Submitted by
- Invitrogen Antibodies (provider)
- Main image
- Experimental details
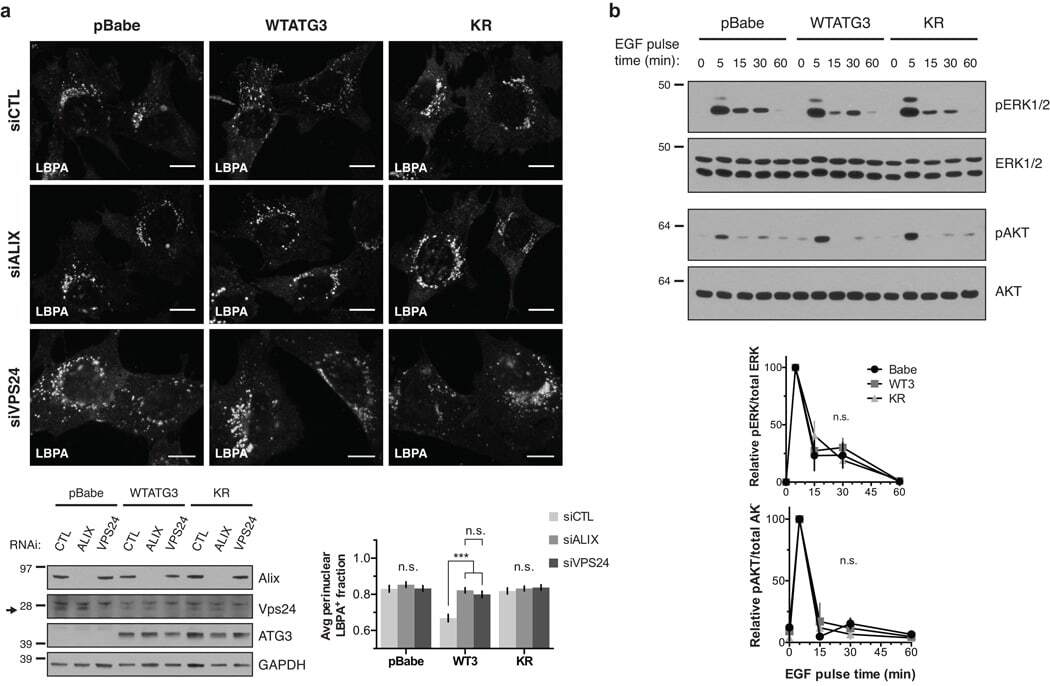
- Figure 5 Loss of ATG12-ATG3 conjugation phenocopies loss of Alix (a) Indicated cell types were transfected with siRNA against ALIX (siALIX), VPS24 (siVPS24), or a non-targeting control (siCTL) and immunostained with anti-LBPA to mark late endosomes. Scale bar, 10 um. Right: Quantification of the perinuclear LBPA + fraction as described in Fig. 2d (mean +- SEM; n = 60 cells pooled from three independent experiments). Statistical significance calculated using ANOVA, followed by Tukey's HSD test (***P < 0.001). Matched lysates were immunoblotted for anti-Alix and anti-Vps24. (b) Indicated cell types were serum-starved overnight at 37 degC followed by treatment with 100 ng/mL EGF for the indicated times. Lysates were immunoblotted for anti-phosphorylated-ERK1/2 (pERK1/2), anti-ERK1/2, anti-phosphorylated-AKT (pAKT), and anti-AKT. Right: Quantification of phosphorylated ERK and AKT levels (mean SEM; n = 3 independent experiments). Statistical significance calculated using ANOVA, followed by Tukey's HSD test. Uncropped images of blots are shown in Supplementary Figure 6 .
- Submitted by
- Invitrogen Antibodies (provider)
- Main image
- Experimental details
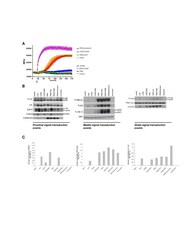
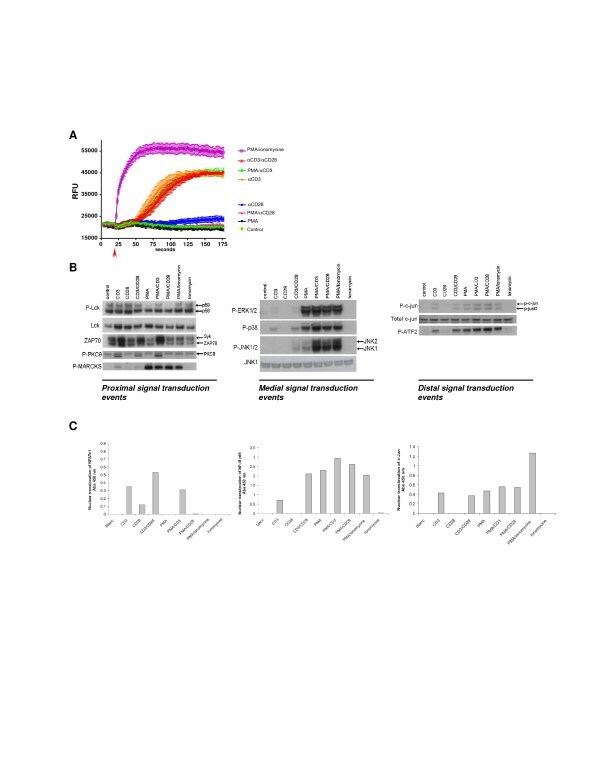
- Figure 1 Signal transduction in Jurkat T cells . Jurkat T cells were stimulated with different combinations of stimuli in order to elucidate the different signal transduction pathways. A ; Jurkat T cells were stimulated as indicated and intracellular Ca 2+ release was monitored over/in time. B ; Intracellular signal transduction routes were charted via phosphoanalysis using western blot. Jurkat T cells were stimulated for 15 min using different stimulations. Proximal (Lck, ZAP70, PKCtheta and the PKC substrate MARCKs), medial (MAPK phosphorylation) and distal (c-Jun and ATF2) signaling was monitored based on the phosphorylation status of the described proteins. C ; Nuclear translocation of the transcription factors NFAT, NFkB and c-Jun was evaluated 15 minutes after stimulation.
- Submitted by
- Invitrogen Antibodies (provider)
- Main image
- Experimental details
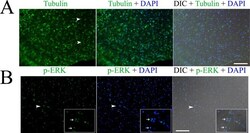
- Fig 1 Immunofluorescence detection of beta tubulin (A) and phosphorylated ERK (p-ERK) (B) in the germinal layer of the whole-mount preparations of in vitro cultured E. multilocularis vesicles. Arrow heads in (A) indicate the neuron cells with long neurites. Arrow heads in (B) indicate the areas which are magnified in the inserts. Note the higher expression of p-ERK in the nucleolus of some cells indicated by the arrows in the inserts. Merges of the differential interference contrast (DIC) bright field microscopy with the fluorescence channels are shown. Bar = 125 mum.

- Submitted by
- Invitrogen Antibodies (provider)
- Main image
- Experimental details
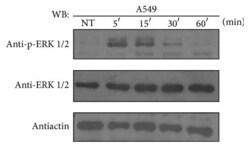
- Figure 1 ATRA activates the ERK pathway through nongenomic mechanisms in A549 cells. A549 cells were serum-starved for 18 h, treated or nontreated (NT) with 5 mu M of ATRA for the times indicated. The phosphorylated form of ERK and total proteins were detected by western blot using specific antibodies.

- Submitted by
- Invitrogen Antibodies (provider)
- Main image
- Experimental details
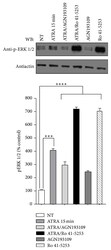
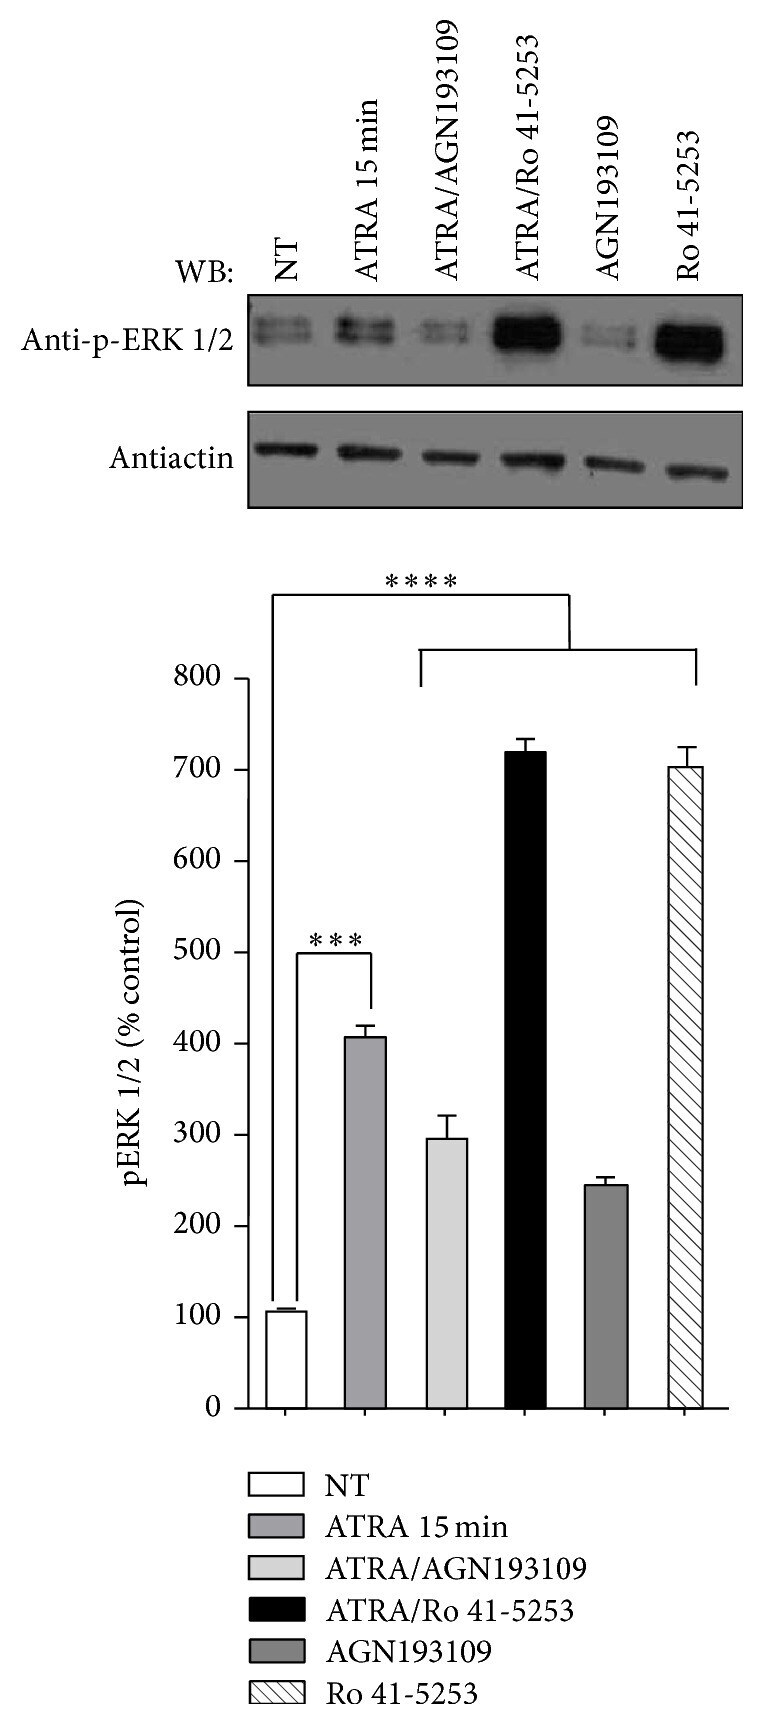
- Figure 2 Effect of AGN193109 and Ro 41-5253 inhibitors on ATRA-induced ERK activation. A549 cells were serum-starved for 18 h, treated or nontreated (NT) with 5 mu M of ATRA for 15 minutes. Cells were preincubated for 1 h with 10 mu M of AGN193109 or 20 mu M of Ro 41-5253 alone or in combination with ATRA. The phosphorylated form of ERK was detected by western blot using specific antibodies. beta -Actin was used as the loading control. The graph represents the densitometric values of ERK phosphorylation in three independent experiments (means +- SEM, *** P < 0.0001; **** P < 0.00001 compared with NT cells, analysis of variance and Newman-Keuls test).
- Submitted by
- Invitrogen Antibodies (provider)
- Main image
- Experimental details
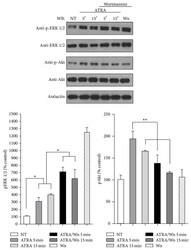
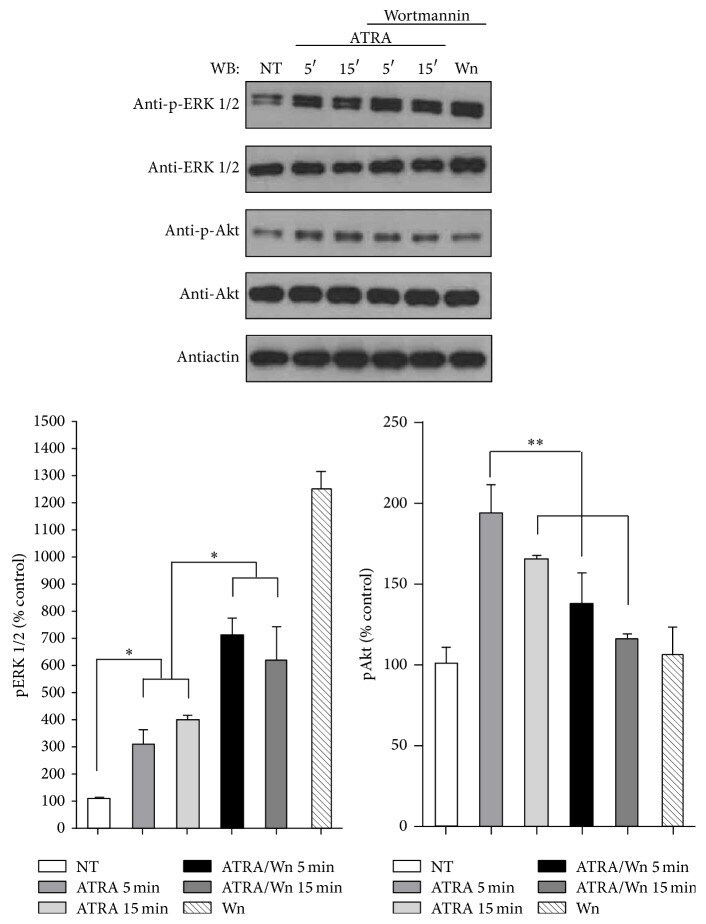
- Figure 3 Effect of PI3K inhibitor wortmannin on ATRA-induced ERK phosphorylation. A549 cells were serum-starved for 18 h and treated or nontreated (NT) with 5 mu M of ATRA at different times. Cells were preincubated for 1 h with 10 mu M of wortmannin (Wm) alone or in combination with ATRA. The phosphorylated form of ERK and Akt and total proteins were detected by western blot using specific antibodies. The graph represents the densitometric analysis of ERK and Akt phosphorylation in three independent experiments (means +- SEM, * P < 0.05; ** P < 0.001; analysis of variance and Newman-Keuls test).
- Submitted by
- Invitrogen Antibodies (provider)
- Main image
- Experimental details
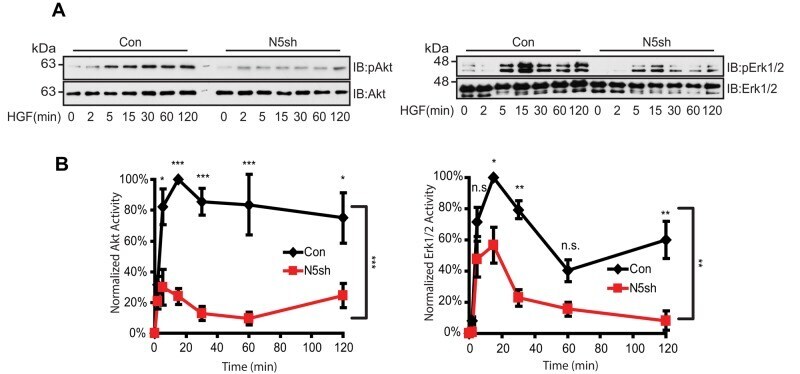
- FIGURE 5: HGF-induced Akt/Erk phosphorylation is attenuated by NHE5 knockdown. Cells serum-starved overnight were stimulated with 50 ng/ml of HGF. The amount of phosphorylated and total Akt and Erk1/2 was detected by immunoblotting. (A) Representative immunoblots are shown. (B) The relative level of phospho-Akt and phospho-Erk are expressed as mean +- SEM of four experiments. p Values for pairwise comparisons at each time point were obtained following repeated-measures ANOVA with time as the within-subject factor. *, p < 0.05, **, p < 0.01, ***, p < 0.001, n.s., not significant.
- Submitted by
- Invitrogen Antibodies (provider)
- Main image
- Experimental details
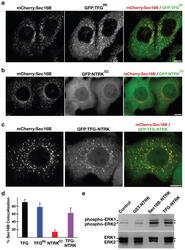
- Figure 7 Targeting of the NTRK1 kinase domain to ER exit sites is sufficient to activate NTRK1-mediated downstream signaling (a-c) Swept field confocal optics were used to image HeLa cells that had been transiently transfected with mCherry:Sec16B and GFP fusions to either the amino terminus of TFG referred to as GFP:TFG (N) (n=18), the transmembrane and kinase domains of NTRK1 referred to as GFP:NTRK (C) (n=15), or a TFG (N) -NTRK1 (C) fusion (n=28), which is equivalent to the oncogene characterized previously ( 21 ). Representative color overlays of mCherry:Sec16B (red) and GFP fusions (green) are shown. Scale bar, 10 mum. (d) Bar graph showing the percent co-localization between the GFP fusions described above and mCherry:Sec16B (error bars represent means +/- SEM for each condition; n=15 different cells for each condition and at least 800 unique ER exit sites were examined). (e) Extracts from hTERT-RPE1 cells stably transfected with GFP alone (Control) or various GFP fusions to the NTRK1 transmembrane and kinase domains (as indicated) were separated by SDS-PAGE and blotted using a phospho-specific ERK1-ERK2 antibody (top) and a pan-ERK1-ERK2 antibody (bottom).

- Submitted by
- Invitrogen Antibodies (provider)
- Main image
- Experimental details
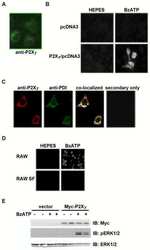
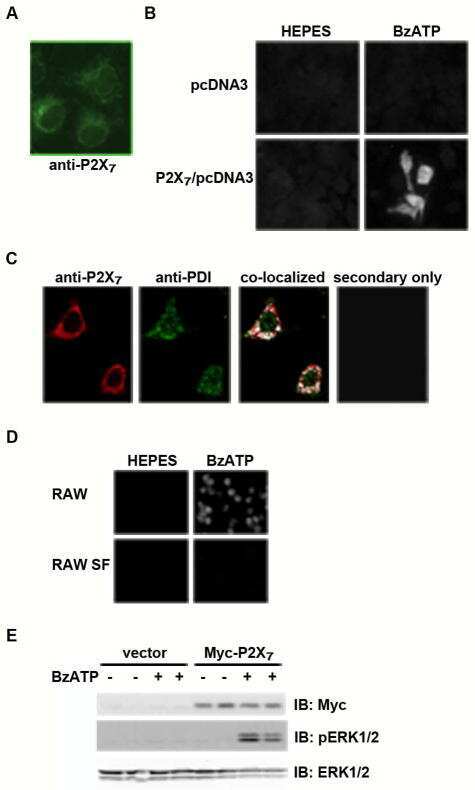
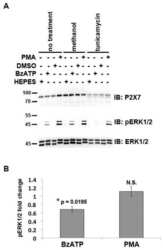
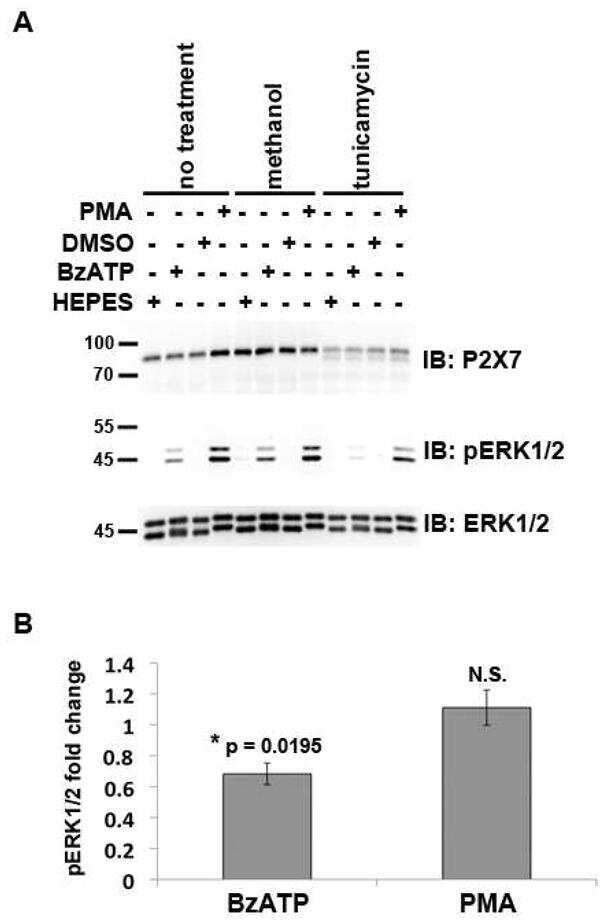
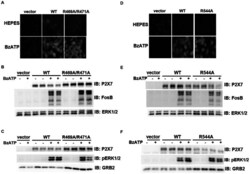
- Figure 7 Mutations within the other Arg-X-Arg sequences do not result in altered P2X 7 activity. A and D, The P2X 7 R469A/R471A double mutant and the P2X 7 R554A single mutant do not display attenuated nucleotide-stimulated pore activity. These data are representative of at least three experiments. B and E, The P2X 7 R469A/R471A and R554A mutants do not display attenuated BzATP-stimulated FosB/DeltaFosB induction. The anti-FosB antibody recognizes both full-length FosB (indicated by the top three bands) and its truncated splice variant DeltaFosB (indicated by the bottom two bands). These data are representative of at least two experiments. C and F, The P2X 7 R469A/R471A and R554A mutants exhibit normal nucleotide-stimulated ERK1/2 activation. These data are representative of two experiments.

- Submitted by
- Invitrogen Antibodies (provider)
- Main image
- Experimental details
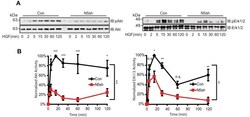
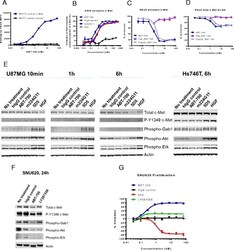
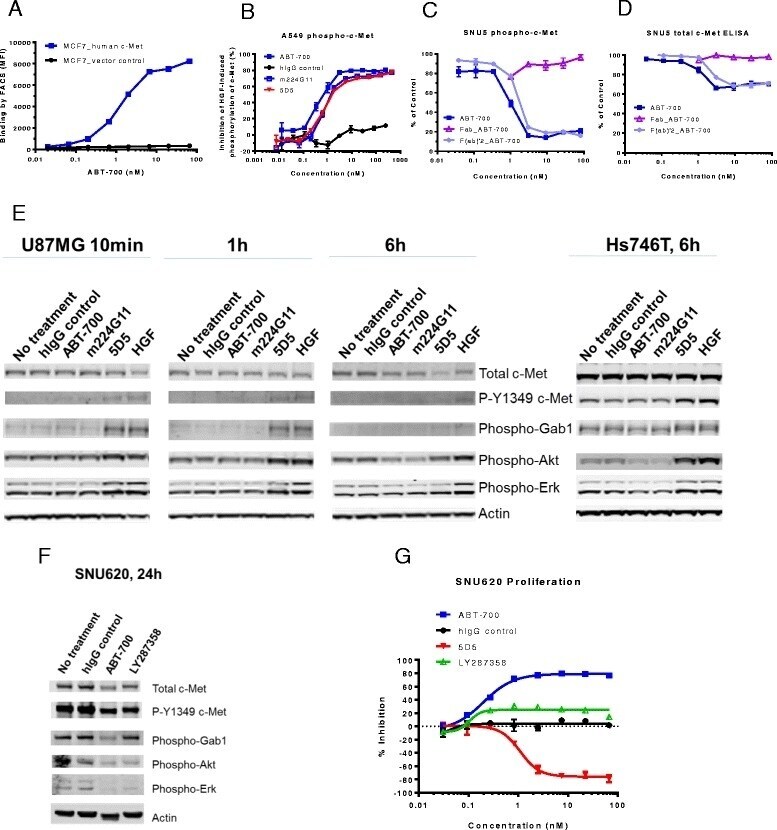
- Fig. 1 ABT-700 specifically binds cellular c-Met and antagonizes c-Met signaling in both HGF-dependent and -independent settings. a FACS analysis of ABT-700 binding to MCF7 transfectants. Stable human c-Met or vector control transfectants of human MCF7 breast cancer cells were incubated with increasing amounts of ABT-700 and bound ABT-700 was detected by FACS with secondary anti-human IgG conjugated with Alexa 488. b ELISA quantification of phospho-c-Met in A549 cells. A549 cells grown in a 96-well plate were pre-incubated for one hour with antibodies in a dose-range as shown, followed by stimulation with 1 nM HGF for 10 min. Total cell lysates were made and phospho-c-Met was detected by ELISA. c ELISA quantification of phospho-c-Met in SNU5 cells. SNU5 cells grown in a 96-well plate were incubated with antibodies in a dose-range as shown for 6 h. Total cell lysates were made and subjected to ELISA for phospho-c-Met. The value of cells in media alone was used as 100 % of control. d ELISA quantification of total c-Met in SNU5 cells. SNU5 cells grown in a 96-well plate were incubated with antibodies in a dose-range as shown for 6 h. Total cell lysates were made and c-Met level was determined by ELISA. The value of cells in media alone was used as 100 % of control. e Western blot analysis of U87MG cell lysates. U87MG cells grown in a 12-well plate were treated with antibodies as shown at 10 mug/mL for 10 min, 1 h or 6 h. Total cell lysates were analyzed for c-Met and other phosp
- Submitted by
- Invitrogen Antibodies (provider)
- Main image
- Experimental details
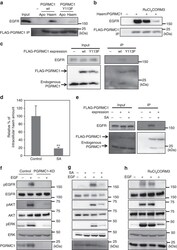
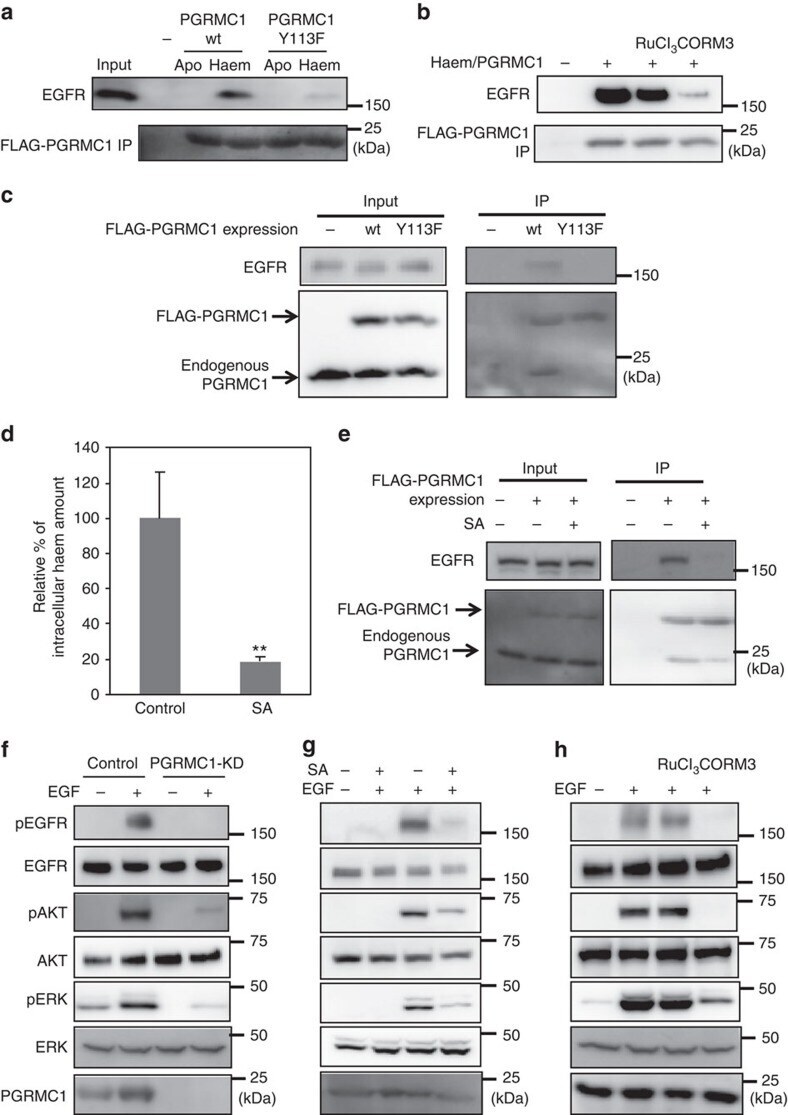
- Figure 4 Haem-dependent dimerization of PGRMC1 is necessary for tumour proliferation mediated by EGFR signalling. ( a ) FLAG-PGRMC1 wild-type (wt) and Y113F mutant proteins (a.a.44-195), in either apo- or haem-bound form, were incubated with purified EGFR and co-immunoprecipitated with anti-FLAG antibody-conjugated beads. Input and bound proteins were detected by Western blotting. ( b ) In vitro binding assay was performed as in ( a ) using haem-bound FLAG-PGRMC1 wt (a.a.44-195) and purified EGFR with or without treatment of RuCl 3 and CORM3. ( c ) FLAG-PGRMC1 wt or Y113F (full length) was over-expressed in HCT116 cells and immunoprecipitated with anti-FLAG antibody-conjugated beads. Co-immunoprecipitated proteins (FLAG-PGRMC1, endogenous PGRMC1 and EGFR) were detected with Western blotting by using anti-PGRMC1 or anti-EGFR antibody. ( d ) HCT116 cells were treated with or without 250 mumol l -1 of succinylacetone (SA) for 48 h. The intracellular haem was extracted and quantified by reverse-phase HPLC. The data represent mean+-s.d. of four separate experiments. ** P
- Submitted by
- Invitrogen Antibodies (provider)
- Main image
- Experimental details
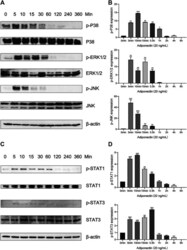
- FIGURE 4 Adiponectin promotes JNK, ERK1/2 and P38 phosphorylation on OCCM-30 cells. (A,B) The expression of JNK (46 and 54 kDa), ERK1/2 (42 and 44 kDa) and P38 (42 kDa) expression as well as their phosphorylated forms after Adiponectin (20 ng/mL) stimulation were analyzed by Western Blots. beta-actin served as a loading control. Graphics show the relative expression of p-JNK, p-ERK1/2 and p-P38 compared to cells at time point 0 min. (C,D) Adiponectin (20 ng/mL) promotes STAT1 (98 KDa) and STAT3 (85 KDa) phosphorylation during a period of 30 min. Graphics show the relative expression of p-STAT1 and p-STAT3 compared to cells at time point 0 min. Values are expressed as means +- SD: Ns (not significant), * p < 0.05; ** p < 0.01; *** p < 0.001.

- Submitted by
- Invitrogen Antibodies (provider)
- Main image
- Experimental details
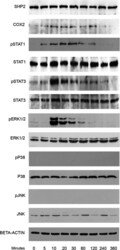
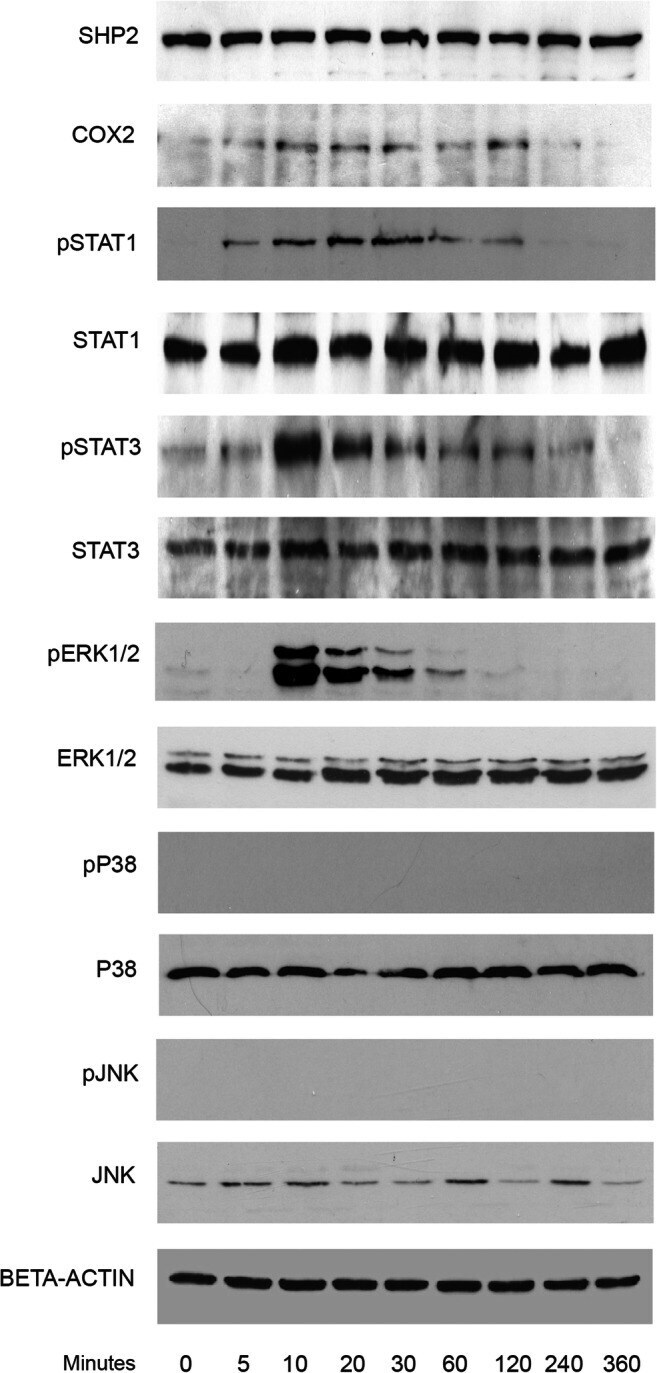
- Fig. 2 Kinetic analysis performed on OCCM-30 cells after stimulation with leptin. The expression of SHP2; COX2; p-STAT1; STAT1; p-STAT3; STAT3; p-ERK1/2; ERK1/2; p-P38; P38; p-JNK; and JNK were visualized by western blot: Leptin upregulates p-STAT1; p-STAT3; and p-ERK1/2 as well as COX2 on OCCM cells whereas no activation of P38 or JNK was observed. Each experiment was repeated three times
- Submitted by
- Invitrogen Antibodies (provider)
- Main image
- Experimental details
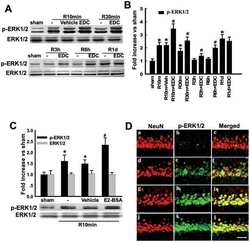
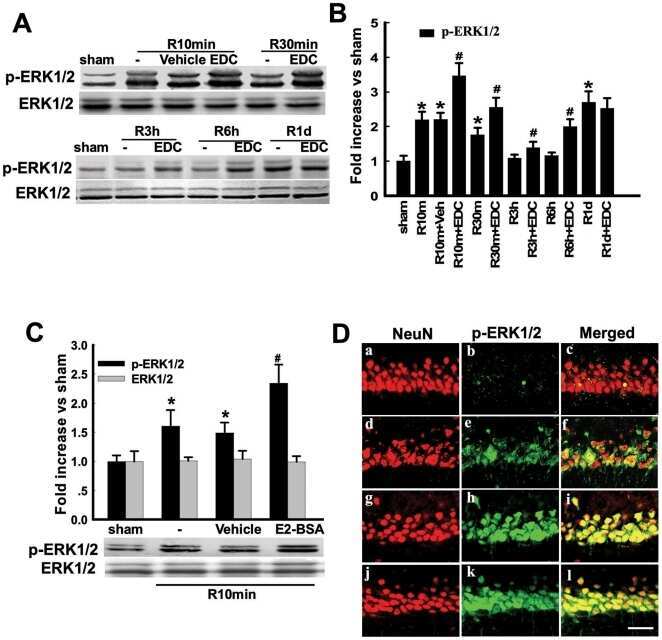
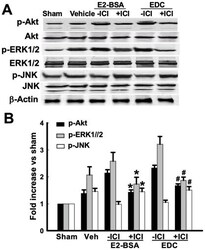
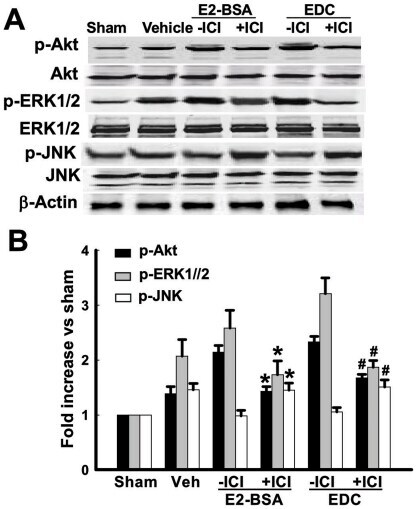
- Figure 6 Effects of ICI 182,780 on phosphorylation of Akt, ERK1/2 and JNK induced by E2-BSA or EDC at 10min of reperfusion in hippocampal CA1 region. ( A ) Western blot analysis showed phosphorylation levels and protein expressions of Akt, ERK1/2 and JNK. Samples were obtained from sham, vehicle, E2-BSA, E2-BSA+ICI, EDC and EDC+ICI treated animals. Bands corresponding to p-Akt, p-ERK1/2 and p-JNK were scanned and the intensities represented as fold increase vs. sham as shown in ( B ). F(5,18) = 106, p
- Submitted by
- Invitrogen Antibodies (provider)
- Main image

- Experimental details
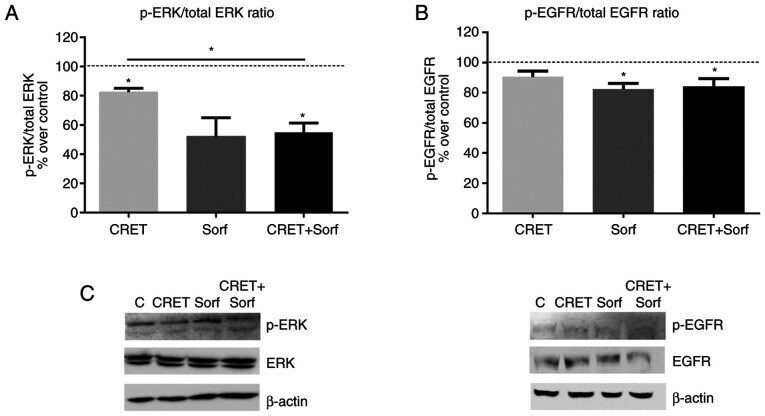
- Figure 4. Effect of CRET and/or sorafenib on EGFR and ERK expression and activation. Western blotting results for p-ERK, ERK, p-EGFR and EGFR expression are presented. The samples were treated with CRET alone (4 h intermittent exposure), sorafenib alone (4 h) or in combination. Data are presented as the ratio of (A) p-ERK1/2 over total ERK1/2 protein and (B) p-EGFR over total EGFR protein. Data are presented as the mean +- SEM of >=3 experimental replicates. *P
- Submitted by
- Invitrogen Antibodies (provider)
- Main image
- Experimental details
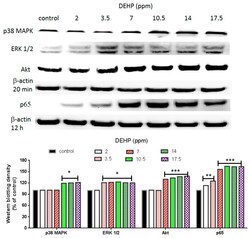
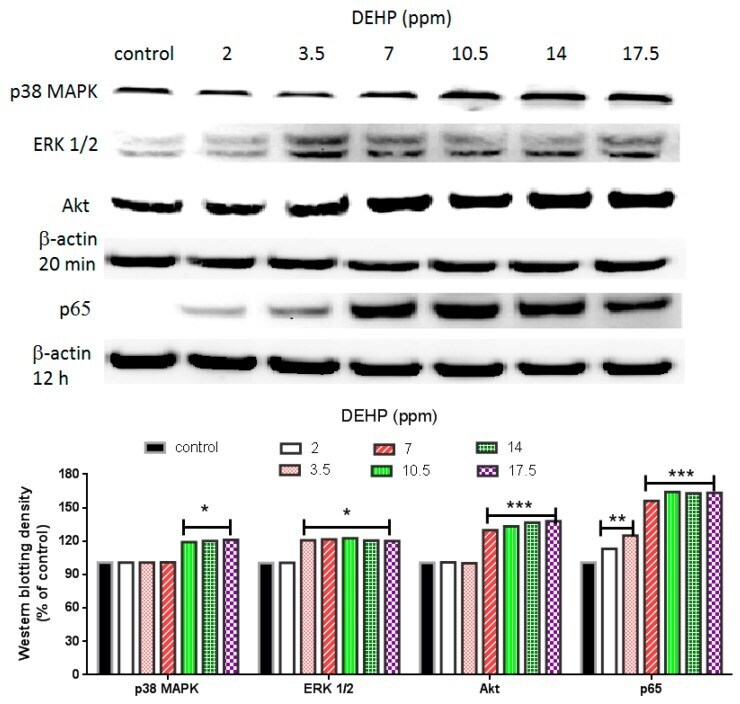
- Figure 3 Effects of DEHP on phosphorylated p38 MAPK, phosphorylated ERK1/2, phosphorylated Akt, and NF-kappaB (p65) protein expression. VSMC ( n >= 3) were treated with DEHP (concentrations between 2 and 17.5 ppm) for 20 min (p38 MAPK, ERK1/2, and Akt) or 12 h (NF-kappaB) prior to protein extraction. Phosphorylated p38 MAPK, phosphorylated ERK1/2, phosphorylated Akt, and NF-kappaB (p65) were expressed by Western blotting. Statistics are shown for DEHP-treated cells * p < 0.05, ** p < 0.01, and *** p < 0.005, compared to the respective control groups.
- Submitted by
- Invitrogen Antibodies (provider)
- Main image
- Experimental details
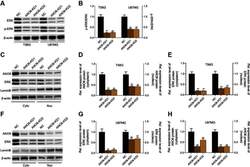
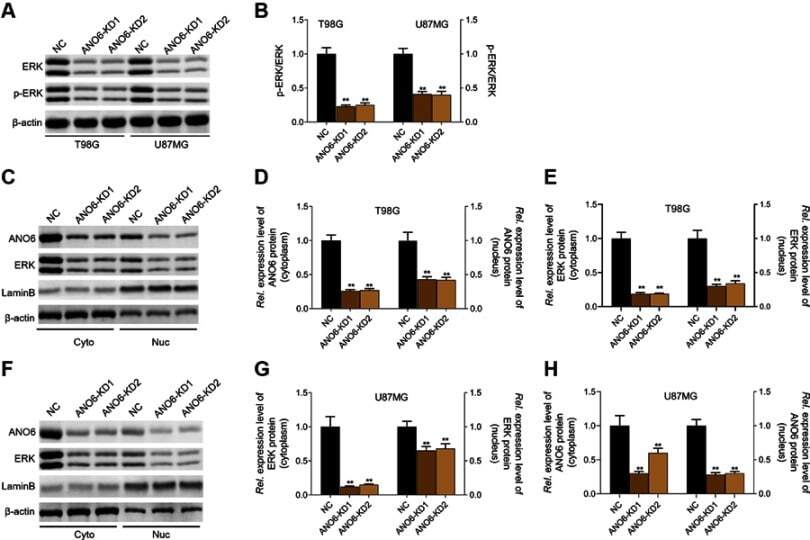
- Knockdown of ANO6 inhibited the activation of ERK signaling. After T98G and U87MG cells transfection with ANO6-KD 1 or ANO6-KD2, (A and B) the protein expression level of ERK and phospho-ERK was detected by Western blot assay; (C) the protein expression levels of ANO6 and ERK were detected by Western blot assay in cytoplasm and cell nucleus of T98G cells; (D and E) Histograms were used to represent statistical results of the protein expression levels of ANO6 and ERK in cytoplasm and cell nucleus of T98G cells; (F) the protein expression levels of ANO6 and ERK were detected by Western blot assay in cytoplasm and cell nucleus of U87MG cells. (G and H) Histograms were used to represent statistical results of the protein expression levels of ANO6 and ERK in cytoplasm and cell nucleus of U87MG cells; β-actin was used as a load control for cytoplasm. LaminB was used as a load control for cell nucleus. Data are presented as the mean standard deviation. **p
- Submitted by
- Invitrogen Antibodies (provider)
- Main image
- Experimental details
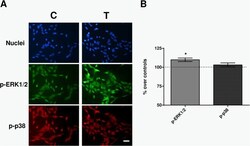
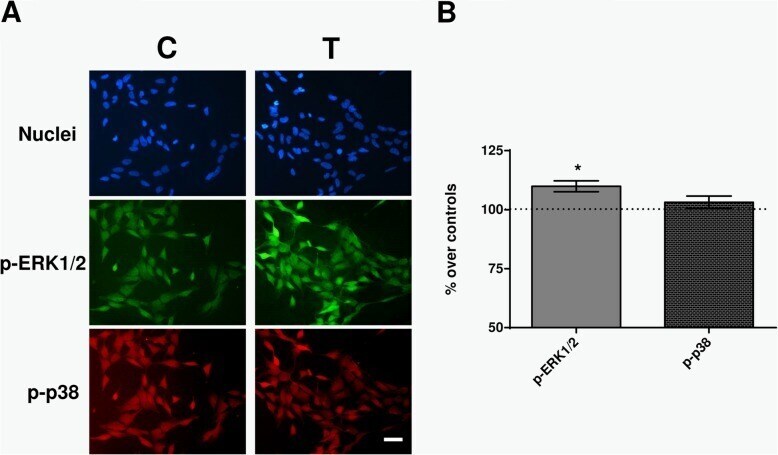
- Fig. 6 Immunofluorescence. a Immunofluorescence for p-ERK and p-p38 at 30 min of sham- or CRET-treatment: representative micrographs. Alexa Green for p-ERK, Alexa Red for p-p38 and Hoechst 33258 for DNA. C = Control, T = Treated with 448 kHz at 50 muA/mm 2 . Bar = 100 mum. b Quantification of p-ERK and p-p38 positive cells. Values are means +- SEM of 3 experimental replicates, normalized over sham-exposed controls. *: 0.05 > p >= 0.01; Student's t-test
- Submitted by
- Invitrogen Antibodies (provider)
- Main image

- Experimental details
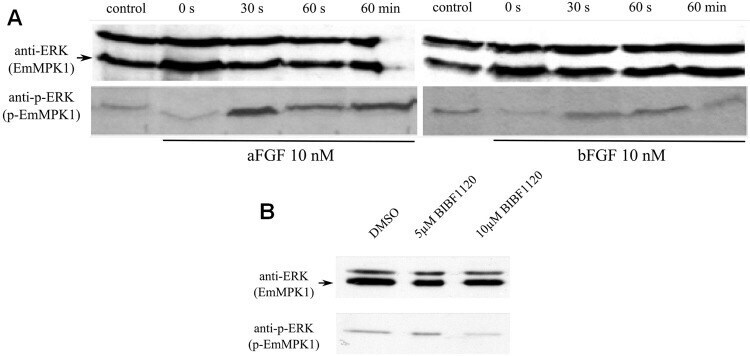
- Fig 7 Effects of host FGFs and BIBF 1120 on EmMPK1 phosphorylation in metacestode vesicles. A , axenically cultivated metacestode vesicles were incubated in cMEM (control) or in medium without FCS (0 s), upon which FGF1 (aFGF) or FGF2 (bFGF) were added at a concentration of 10 nM for 30 sec (30s), 60 sec (60s) or 60 min (60min). Protein lysates were subsequently separated by 12% SDS-PAGE and Western blots were analysed using polyclonal antibodies against Erk-like MAP kinases (anti-ERK) or double phosphorylated Erk-like MAP kinases (anti-p-ERK). B , axenically cultivated metacestode vesicles were incubated with DMSO (negative control), 5 mM or 10 mM BIBF1120 (30 min each) and cell lysates were subsequently analysed as described above. Both experiments were performed in triplicate with similar results.
- Submitted by
- Invitrogen Antibodies (provider)
- Main image
- Experimental details
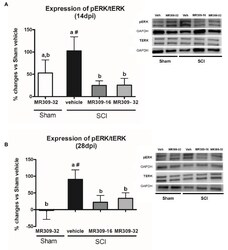
- Figure 2 Spinal ERK1/2 phosphorylation (pERK) expression after preventive sigma-1 receptor antagonist MR309 treatment. Quantification and representative immunoblots of total ERK (tERK), pERK, and glyceraldehyde 3-phosphate dehydrogenase (GAPDH). Experimental groups: Sham-Veh ( n = 5), Sham-MR309-32 ( n = 5), SCI-Veh ( n = 4), SCI-MR309-16 ( n = 5), and SCI-MR309-32 ( n = 5). Protein expressions were normalized to GAPDH, and data are presented as a percentage respect to SCI-Veh mice. ANOVA analysis revealed significant differences at both 14 ( F (4,23) = 3.54, p = 0.025) and 28 ( F (4,24) = 3.65, p = 0.022) days post-injury. a, b: groups not sharing a letter are significantly different, p < 0.05, by Duncan's test; #: significant differences vs. SCI-Veh ( p < 0.05, Duncan's test). MR309 treatments prevent pERK upregulation observed in mild spinal cord injured mice at both 14 (A) and 28 (B) days post-injury. Control images were reused either for illustrative purposes or methodological purposes when several protein levels were assessed in one blot. Full-length blots are presented in Supplementary Figure S1 .
