 Explore
 Validate
 Learn
LearnMA1-099
antibody from Invitrogen Antibodies
Targeting: MAPK1
ERK, ERK2, MAPK2, p41mapk, PRKM1, PRKM2
 Western blot
 Immunocytochemistry
 Immunoprecipitation Immunohistochemistry Flow cytometry Chromatin Immunoprecipitation
Antibody data
- Antibody Data
- Antigen structure
- References [0]
- Comments [0]
- Validations
- Immunocytochemistry [2]
- Immunohistochemistry [3]
- Flow cytometry [2]
- Chromatin Immunoprecipitation [2]
Submit
Validation data
Reference
Comment
Report error
- Product number
- MA1-099 - Provider product page

- Provider
- Invitrogen Antibodies
- Product name
- ERK2 Monoclonal Antibody (6F8)
- Antibody type
- Monoclonal
- Antigen
- Other
- Description
- MA1-099 has been successfully used in Western blot, ChIP, flow cytometry, immunofluorescence, immunohistochemistry and immunoprecipitation applications, and reacts with human, dog, rat, mouse and monkey samples. MA1-099 has successfully been used in western blot to detect p42 ERK in HeLa, NRK and MDCK cell lysates. As demonstrated by a Western blot using recombinant ERK1 and ERK2 proteins, MA1-099 can also detect ERK1, but detects ERK2 at much lower concentrations. As demonstrated by a Western blot using a panel of lysates from various species, MA1-099 only detects endogenous ERK2.
- Reactivity
- Human, Mouse, Rat, Canine
- Host
- Mouse
- Isotype
- IgG
- Antibody clone number
- 6F8
- Vial size
- 100 μg
- Concentration
- 1 mg/mL
- Storage
- -20°C
No comments: Submit comment
Supportive validation
- Submitted by
- Invitrogen Antibodies (provider)
- Main image

- Experimental details
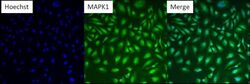
- Immunofluorescent analysis of MAPK1 (green) in HeLa cells. Formalin fixed cells were permeabilized with 0.1% Triton X-100 in TBS for 10 minutes at room temperature. Cells were then blocked with 5% normal goat serum (Product # 31873) for 15 minutes at room temperature. Cells were then probed with a mouse monoclonal antibody recognizing MAPK1 (Product # MA1-099), at a dilution of 1:200 for at least 1 hour at room temperature. Cells were then washed with PBS and incubated with DyLight 488 goat-anti-mouse secondary antibody at a dilution of 1:400 for 30 minutes at room temperature. Nuclei (blue) were stained with Hoechst 33342 dye (Product # 62249). Images were taken on a Thermo Scientific ArrayScan at 10X magnification.

- Submitted by
- Invitrogen Antibodies (provider)
- Main image
- Experimental details
- Immunofluorescent analysis of MAPK1 (green) in HeLa cells. Formalin fixed cells were permeabilized with 0.1% Triton X-100 in TBS for 10 minutes at room temperature. Cells were then blocked with 5% normal goat serum (Product # 31873) for 15 minutes at room temperature. Cells were then probed with a mouse monoclonal antibody recognizing MAPK1 (Product # MA1-099), at a dilution of 1:200 for at least 1 hour at room temperature. Cells were then washed with PBS and incubated with DyLight 488 goat-anti-mouse secondary antibody at a dilution of 1:400 for 30 minutes at room temperature. Nuclei (blue) were stained with Hoechst 33342 dye (Product # 62249). Images were taken on a Thermo Scientific ArrayScan at 10X magnification.

Supportive validation
- Submitted by
- Invitrogen Antibodies (provider)
- Main image

- Experimental details
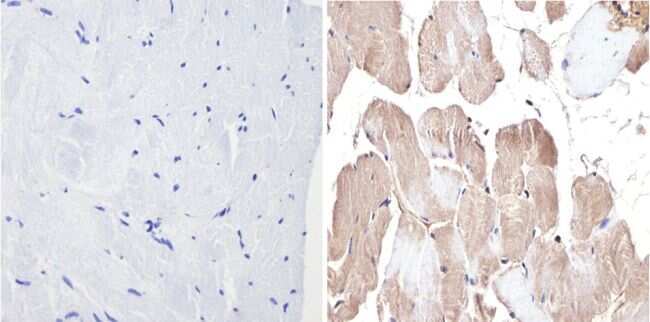
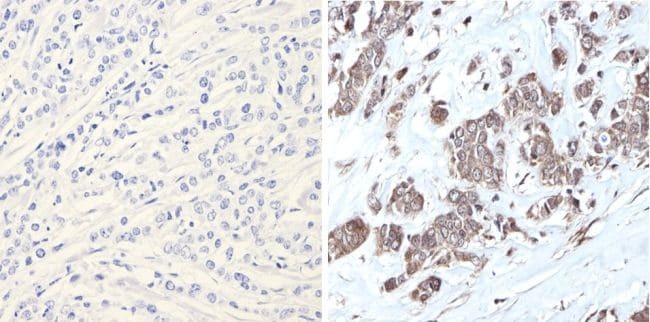
- Immunohistochemistry analysis of MAPK1 showing positive staining in the nucleus and cytoplasm of paraffin-treated Human skeletal muscle (right) compared with a negative control in the absence of primary antibody (left). To expose target proteins, antigen retrieval method was performed using 10mM sodium citrate (pH 6.0), microwaved for 8-15 min. Following antigen retrieval, tissues were blocked in 3% H2O2-methanol for 15 min at room temperature, washed with ddH2O and PBS, and then probed with a MAPK1 monoclonal antibody (Product # MA1-099) diluted by 3% BSA-PBS at a dilution of 1:100 overnight at 4°C in a humidified chamber. Tissues were washed extensively PBST and detection was performed using an HRP-conjugated secondary antibody followed by colorimetric detection using a DAB kit. Tissues were counterstained with hematoxylin and dehydrated with ethanol and xylene to prep for mounting.
- Submitted by
- Invitrogen Antibodies (provider)
- Main image
- Experimental details
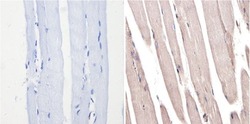
- Immunohistochemistry analysis of MAPK1 showing positive staining in the nucleus and cytoplasm of paraffin-treated Mouse skeletal muscle (right) compared with a negative control in the absence of primary antibody (left). To expose target proteins, antigen retrieval method was performed using 10mM sodium citrate (pH 6.0), microwaved for 8-15 min. Following antigen retrieval, tissues were blocked in 3% H2O2-methanol for 15 min at room temperature, washed with ddH2O and PBS, and then probed with a MAPK1 monoclonal antibody (Product # MA1-099) diluted by 3% BSA-PBS at a dilution of 1:200 overnight at 4°C in a humidified chamber. Tissues were washed extensively PBST and detection was performed using an HRP-conjugated secondary antibody followed by colorimetric detection using a DAB kit. Tissues were counterstained with hematoxylin and dehydrated with ethanol and xylene to prep for mounting.
- Submitted by
- Invitrogen Antibodies (provider)
- Main image
- Experimental details
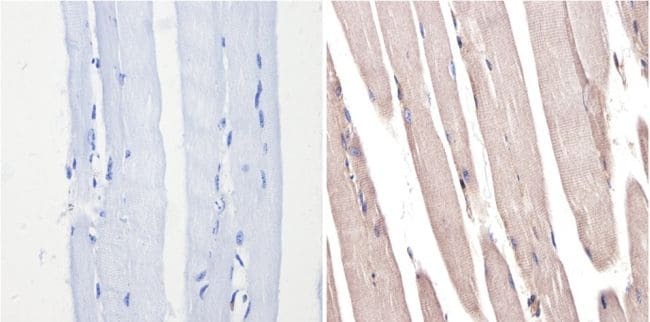
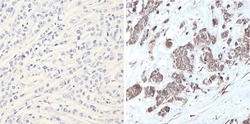
- Immunohistochemistry analysis of MAPK1 showing positive staining in the nucleus and cytoplasm of paraffin-treated Human breast carcinoma (right) compared with a negative control in the absence of primary antibody (left). To expose target proteins, antigen retrieval method was performed using 10mM sodium citrate (pH 6.0), microwaved for 8-15 min. Following antigen retrieval, tissues were blocked in 3% H2O2-methanol for 15 min at room temperature, washed with ddH2O and PBS, and then probed with a MAPK1 monoclonal antibody (Product # MA1-099) diluted by 3% BSA-PBS at a dilution of 1:200 overnight at 4°C in a humidified chamber. Tissues were washed extensively PBST and detection was performed using an HRP-conjugated secondary antibody followed by colorimetric detection using a DAB kit. Tissues were counterstained with hematoxylin and dehydrated with ethanol and xylene to prep for mounting.
Supportive validation
- Submitted by
- Invitrogen Antibodies (provider)
- Main image
- Experimental details
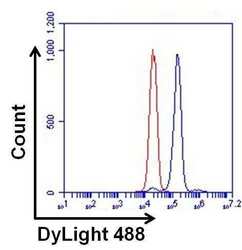
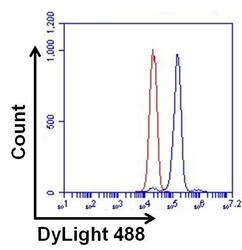
- Flow cytometry analysis of ERK2 on HeLa cells. Cells were fixed, permeabilized, and stained with a p42 MAP Kinase/ERK2/MAPK1 monoclonal antibody (Product # MA1-099, blue histogram) or a Mouse IgG2a isotype control (Product # MA1-10418, red histogram) at a concentration of 1 µg/mL. After incubation of the primary antibody for at least 1 hour on ice, the cells were stained with a DyLight 488-conjugated goat anti-mouse IgG secondary antibody (Product # 35502) for at least 30 minutes on ice. A representative 10,000 cells were acquired for each sample.
- Submitted by
- Invitrogen Antibodies (provider)
- Main image
- Experimental details
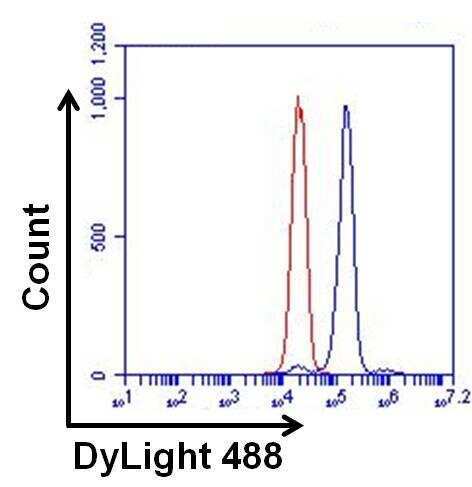
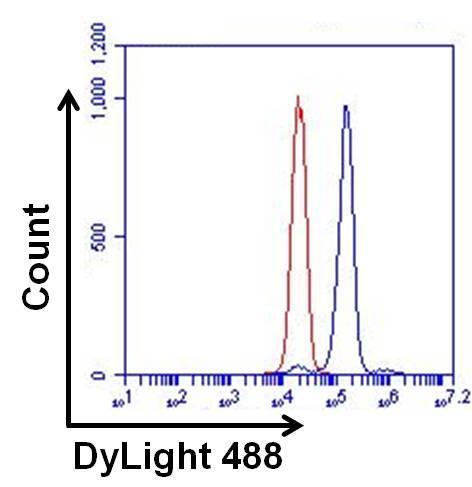
- Flow cytometry analysis of ERK2 on HeLa cells. Cells were fixed, permeabilized, and stained with a p42 MAP Kinase/ERK2/MAPK1 monoclonal antibody (Product # MA1-099, blue histogram) or a Mouse IgG2a isotype control (Product # MA1-10418, red histogram) at a concentration of 1 µg/mL. After incubation of the primary antibody for at least 1 hour on ice, the cells were stained with a DyLight 488-conjugated goat anti-mouse IgG secondary antibody (Product # 35502) for at least 30 minutes on ice. A representative 10,000 cells were acquired for each sample.
Supportive validation
- Submitted by
- Invitrogen Antibodies (provider)
- Main image
- Experimental details
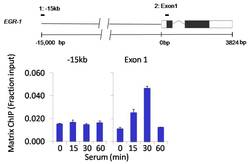
- Chromatin immunoprecipitation analysis of ERK2/MAPK1 was performed using cross-linked chromatin from 1 x 10⁶ HCT116 colon carcinoma cells treated with serum for 0, 15, 30, and 60 minutes. Immunoprecipitation was performed using a multiplex microplate Matrix ChIP assay (see reference for Matrix ChIP protocol: http://www.ncbi.nlm.nih.gov/pubmed/22098709) with 1.0 µL/100 µL well volume of an ERK2/MAPK1 monoclonal antibody (Product # MA1-099). Chromatin aliquots from ~1 x 10⁵ cells were used per ChIP pull-down. Quantitative PCR data were done in quadruplicate using 1 µL of eluted DNA in 2 µL SYBR real-time PCR reactions containing primers to amplify -15kb upstream of the Egr1 gene or exon-1 of Egr1. PCR calibration curves were generated for each primer pair from a dilution series of sheared total genomic DNA. Quantitation of immunoprecipitated chromatin is presented as signal relative to the total amount of input chromatin. Results represent the mean +/- SEM for three experiments. A schematic representation of the Egr-1 locus is shown above the data where boxes represent exons (black boxes = translated regions, white boxes = untranslated regions); the zigzag line represents an intron; and the straight line represents upstream sequence. Regions amplified by Egr-1 primers are represented by black bars. Data courtesy of the Innovators Program.

- Submitted by
- Invitrogen Antibodies (provider)
- Main image

- Experimental details
- Chromatin immunoprecipitation analysis of ERK2/MAPK1 was performed using cross-linked chromatin from 1 x 10⁶ HCT116 colon carcinoma cells treated with serum for 0, 15, 30, and 60 minutes. Immunoprecipitation was performed using a multiplex microplate Matrix ChIP assay (see reference for Matrix ChIP protocol: http://www.ncbi.nlm.nih.gov/pubmed/22098709) with 1.0 µL/100 µL well volume of an ERK2/MAPK1 monoclonal antibody (Product # MA1-099). Chromatin aliquots from ~1 x 10⁵ cells were used per ChIP pull-down. Quantitative PCR data were done in quadruplicate using 1 µL of eluted DNA in 2 µL SYBR real-time PCR reactions containing primers to amplify -15kb upstream of the Egr1 gene or exon-1 of Egr1. PCR calibration curves were generated for each primer pair from a dilution series of sheared total genomic DNA. Quantitation of immunoprecipitated chromatin is presented as signal relative to the total amount of input chromatin. Results represent the mean +/- SEM for three experiments. A schematic representation of the Egr-1 locus is shown above the data where boxes represent exons (black boxes = translated regions, white boxes = untranslated regions); the zigzag line represents an intron; and the straight line represents upstream sequence. Regions amplified by Egr-1 primers are represented by black bars. Data courtesy of the Innovators Program.
