 Explore
 Validate
 Learn
Learn Flow cytometry
Antibody data
- Antibody Data
- Antigen structure
- References [0]
- Comments [0]
- Validations
- Flow cytometry [4]
- Other assay [8]
Submit
Validation data
Reference
Comment
Report error
- Product number
- MHCD0828 - Provider product page

- Provider
- Invitrogen Antibodies
- Product name
- CD8 Monoclonal Antibody (3B5), Pacific Blue™
- Antibody type
- Monoclonal
- Antigen
- Other
- Description
- For fluorochrome conjugated antibodies only, light exposure should be avoided. Use dim light during handling, incubation with cells, and prior to analysis. It is recommended that cells be analyzed within 18 hours of staining. If the reagent is being diluted, it is recommended that only the quantity to be used within one week be diluted. Each lot is tested by flow cytometry using human peripheral blood leukocytes (PBL). Based on this testing it is recommended that 5 µL of antibody be used per 1 x 10^6 cells in a 100 µL staining volume.
- Reactivity
- Human
- Host
- Mouse
- Isotype
- IgG
- Antibody clone number
- 3B5
- Vial size
- 500 µL
- Concentration
- 0.25 mg/mL
- Storage
- 4° C
No comments: Submit comment
Supportive validation
- Submitted by
- Invitrogen Antibodies (provider)
- Main image

- Experimental details
- Flow cytometry analysis of CD8 using a monoclonal antibody (Product # MHCD0828).

- Submitted by
- Invitrogen Antibodies (provider)
- Main image

- Experimental details
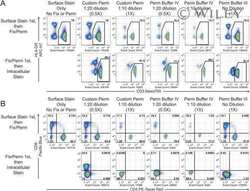
- Figure 1. Multicolor analysis of CD4-positive and CD8-positive populations using Qdot® 605 streptavidin and a Pacific Blue dye-labeled conjugate. Human mononuclear cells were blocked with nonspecific goat IgG and then stained with a biotinylated mouse anti-human CD4 antibody. Cells were incubated with Qdot® 605 streptavidin, then with mouse anti-human CD8 antibody conjugated to Pacific Blue dye. Cells were analyzed on a flow cytometer equipped with a 405 nm violet diode laser and 450/50 and 605/20 nm bandpass filters. Compensation was performed using single-color controls. Cells were analyzed using a lymphocyte gate as determined by FSC/SSC. These reagents give clear separation of the CD4-positive and CD8-positive populations using a single excitation source, the violet diode laser.

- Submitted by
- Invitrogen Antibodies (provider)
- Main image

- Experimental details
- Flow Cytometry analysis using a CD8 monoclonal antibody (Product # MHCD0828).

- Submitted by
- Invitrogen Antibodies (provider)
- Main image

- Experimental details
- Flow cytometry analysis of CD8 using a monoclonal antibody (Product # MHCD0828).

Supportive validation
- Submitted by
- Invitrogen Antibodies (provider)
- Main image
- Experimental details
- NULL
- Submitted by
- Invitrogen Antibodies (provider)
- Main image

- Experimental details
- NULL

- Submitted by
- Invitrogen Antibodies (provider)
- Main image

- Experimental details
- Figure 2. The ImageStream-based autophagy assay detects autophagy in PBMCs. PBMCs from a healthy young donor, stained for LC3 and Lyso-ID after 2 h culture in (A) control medium (B) in starvation medium with lysosomal inhibitors E64d/PepA. BDS histograms of gated double-positive cells in control medium (white line) or starvation medium plus lysosomal inhibitors (red line) (C) in total PBMCs, (D) in CD8 + T cells. (E) Representative images of single cells merged for fluorescent signals from LC3 and Lyso-ID under control, control + inhibitors (C+I), starved or starved plus inhibitors (starved + I) conditions in total PBMCs. (F) Autophagy levels as measured by % double positives with high BDS (left Y axis, white bars) or mean LC3 puncta (right Y axis, black bars) on CD8 + T cells from healthy donors under control conditions and in the presence of E64d/PepA (mean +- s.d., n = 7).

- Submitted by
- Invitrogen Antibodies (provider)
- Main image

- Experimental details
- Figure 3 Stimulation of RHAMM R3-specific T cells by DCs The RHAMM R3-specific cytotoxic CD8 + T cell clone was stimulated for 24 hours without DCs (medium control) or with mock EP DCs or RHAMM EP DCs from HLA-A*0201 - (n = 5) or A*0201 + (n = 3) donors. T cells stimulated with T2 cells +- R3 or R5 peptide served as negative and positive controls. IFN-gamma was quantified in culture supernatants using ELISA. Data are depicted as mean (+ SD); ns not significant, * P < 0.05, ** P < 0.01, one-way ANOVA with Bonferroni posthoc test. CD137, CD107a and granzyme B expression by CD8 + T cells was determined by flow cytometry following 24-hour stimulation with mock EP DCs or RHAMM EP DCs from HLA-A*0201 + donors (n = 2). T cells stimulated with T2 cells + R3 or R5 peptide served as positive and negative controls, respectively. Data are depicted as mean fluorescence intensity (+SD); ns not significant, unpaired t test.

- Submitted by
- Invitrogen Antibodies (provider)
- Main image

- Experimental details
- Figure 6 RHAMM-specific CD8+ T cells in vaccinated HLA-A*0201+ AML patients The graphs on the left show the percentage of RHAMM R3 and R5-specific cells within the CD8 + T cell population infiltrating the injection sites of WT1 EP DCs (i.e., the vaccine; n = 6) or KLH alone (n = 3). Samples were measured by flow cytometry following staining with R3 or R5 pHLA-A*0201 tetramers. Data are depicted as mean (+ SD); * P < 0.05, two-tailed Mann Whitney U test. On the right, dot plots show R3 or R5 pHLA-A*0201 tetramer staining results of CD8 + T cells isolated from WT1 EP DC or KLH injection site skin biopsies.

- Submitted by
- Invitrogen Antibodies (provider)
- Main image

- Experimental details
- Figure 3. Validation of assay using cells deficient for autophagy. MCF7 cells were either transfected with scrambled (SCR) or ULK1 siRNA , then processed for (A) western blot of cell lysates detected with rabbit-anti-ULK1 or (B) RT-qPCR, graph indicates fold change of ULK1mRNA in the MCF7 cell line. (C) Representative dot plot cells stained for LC3 and lysosomes, ULK1 siRNA- treated cells (red) overlaid with scrambled siRNA treated cells (white) (D) % double positives with BDS hi (LC3 + Lyso + in MCF7 cell line) (mean +- SEM, n = 2). Splenocytes from Vav-Atg7 -/- mice (gray) or age-matched wild-type mice (white) were stained for LC3 and lysosomes. (E) Representative BDS overlay histogram from Vav-Atg7 -/- mice (gated on % total double positives) (red) or age-matched wild-type mice (white) on all splenocytes. (F) Basal autophagy in CD8 + splenocytes measured as % double positives that are BDS hi (mean +- SEM, n = 3), (G) basal and induced autophagy levels in CD11b + splenic myeloid cells (mean +- SEM, n = 2).

- Submitted by
- Invitrogen Antibodies (provider)
- Main image
- Experimental details
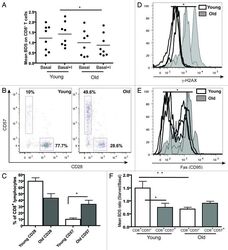
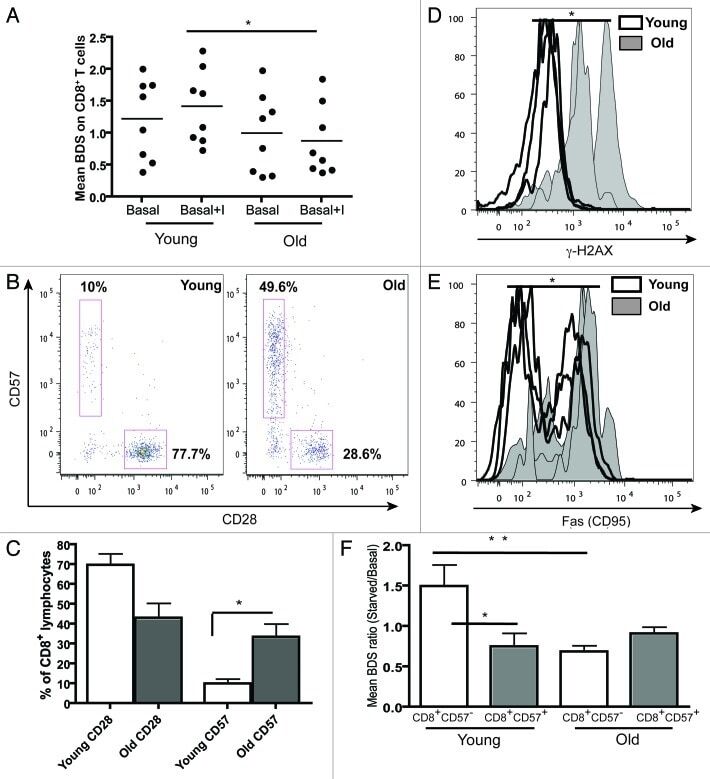
- Figure 5. Aging and replicative senescence markers in human T lymphocytes. PBMCs from healthy young (< 28 y) and old (> 56 y) donors were stained for CD28 and CD57 and run on LSR II flow cytometer. (A) Autophagy levels (Mean BDS) in CD8 + T cells from young (< 28 y, n = 8) and old (> 56 y, n = 8) donors under basal and basal+I (for 2 h) conditions (mean +- SEM, *p < 0.0499 between young and old basal+I). (B) Representative dot plots from a young and an old donor showing percentages of CD28 and CD57 cells gated on CD8 + T cells. (C) Bar graph showing % of CD8 + lymphocytes with CD28 and CD57 markers in four young and old donors (mean +- SEM, p = 0.0571 for CD8 CD28 population and *p = 0.0286 for CD8 CD57 population). (D) Overlaid histogram of gammaH2AX (DNA double-strand break) levels of CD8 + lymphocytes from three young and old donors gated on CD28 + CD57 - population (geometric mean +- SEM, *p = 0.0286). (E) Overlaid histogram of FAS (CD95) levels of CD8 + lymphocytes from four young and old donors gated on CD28 + CD57 - population (geometric mean +- SEM, *p = 0.0286). PBMCs from four healthy young and old donors were cultured under control and starved conditions for 2 h and stained for CD8, CD57, LC3 and Lyso-ID. (F) Colocalization of LC3 and lysosomal marker in CD8 + CD57 +/- cells, expressed as mean BDS ratio between starved and basal treatments (mean +- SEM, n = 5 (young donors), n = 8 (old donors), **p = 0.0049, *p = 0.035).
- Submitted by
- Invitrogen Antibodies (provider)
- Main image
- Experimental details
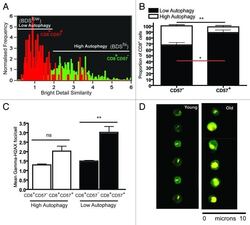
- Figure 6. Levels of gammaH2AX foci in senescent T cells with low autophagy. PBMCs from three healthy donors were bead sorted for CD8 + T cells and stained for CD57 gammaH2AX, LC3 and Lyso-ID and run on ImageStream. (A) Representative BDS overlay histogram for CD8 + CD57 + (red) for CD8 + CD57 - (green) depicts the low and high autophagy gates. (B) Bar graph showing proportion of CD8 + CD57 +/- lymphocytes with low and high autophagy in three healthy donors (mean +- SEM, **p = 0.0029, *p = 0.0273). (C) Bar graph showing mean gammaH2AX foci/cell in low and high autophagy CD8 + CD57 + , CD8 + CD57 - populations (geometric mean +- SEM, **p = 0.0057 and **p = 0.0087, respectively). (D) Representative ImageStream images of gammaH2AX foci in CD8 + lymphocytes from young and old cells.
