 Explore
 Validate
 Learn
Learn Flow cytometry
Antibody data
- Antibody Data
- Antigen structure
- References [0]
- Comments [0]
- Validations
- Flow cytometry [3]
- Other assay [40]
Submit
Validation data
Reference
Comment
Report error
- Product number
- 12-0088-42 - Provider product page

- Provider
- Invitrogen Antibodies
- Product name
- CD8a Monoclonal Antibody (RPA-T8), PE, eBioscience™
- Antibody type
- Monoclonal
- Antigen
- Other
- Description
- Description: The RPA-T8 monoclonal antibody reacts with the human CD8a molecule, an approximately 32-34 kDa cell surface receptor expressed either as a heterodimer with the CD8 beta chain (CD8 alpha/beta) or as a homodimer (CD8 alpha/alpha). A majority of thymocytes and a subpopulation of mature T cells and NK cells express CD8a. CD8 binds to MHC class I and through its association with protein tyrosine kinase p56lck plays a role in T-cell development and activation of mature T cells. Applications Reported:The RPA-T8 antibody been reported for use in flow cytometric analysis. Applications Tested: Has been pre-titrated and tested by flow cytometric analysis of normal human peripheral blood cells. This can be used at test size: 5 µL (0.125 µg) per test. A test is defined as the amount (µg) of antibody that will stain a cell sample in a final volume of 100 µL. Cell number should be determined empirically but can range from 10^5 to 10^8 cells/test. It is recommended that the antibody be carefully titrated for optimal performance in the assay of interest. The pre-titrated test size contains BSA and/or gelatin for protein stabilization. Excitation: 488-561 nm; Emission: 578 nm; Laser: Blue Laser, Green Laser, Yellow-Green Laser. Filtration: 0.2 µm post-manufacturing filtered.
- Reactivity
- Human
- Host
- Mouse
- Conjugate
- Yellow dye
- Isotype
- IgG
- Antibody clone number
- RPA-T8
- Vial size
- 100 Tests
- Concentration
- 5 µL/Test
- Storage
- 4°C, store in dark, DO NOT FREEZE!
No comments: Submit comment
Supportive validation
- Submitted by
- Invitrogen Antibodies (provider)
- Main image
- Experimental details
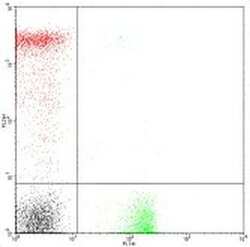
- Staining of normal human peripheral blood cells with Anti-Human CD4 FITC (Product # 11-0049-42) and Anti-Human CD8a PE.
- Submitted by
- Invitrogen Antibodies (provider)
- Main image

- Experimental details
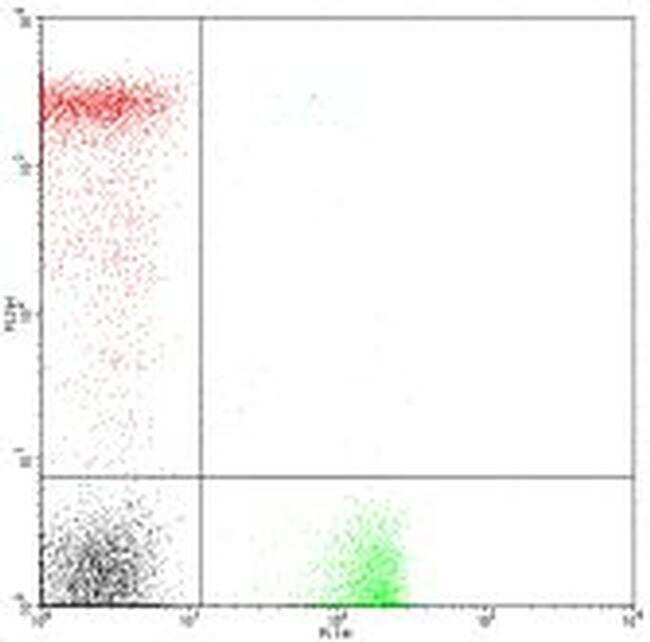
- Staining of human peripheral blood mononuclear cells with CD45 Pacific Blue, CD3 APC, CD8a PE and CD4 PerCP-Cy5.5. As expected based on known relative expression patterns, CD4 clone OKT4 (OKT-4) stains a subset of lymphocytes (pink), but not monocytes (orange) and granulocytes (blue).
- Conjugate
- Yellow dye
- Submitted by
- Invitrogen Antibodies (provider)
- Main image

- Experimental details
- Staining of human peripheral blood mononuclear cells with CD45 Pacific Blue, CD3 APC, CD8a PE and CD4 PerCP-Cy5.5. As expected based on known relative expression patterns, CD4 clone OKT4 (OKT-4) stains a subset of lymphocytes (pink), but not monocytes (orange) and granulocytes (blue).

Supportive validation
- Submitted by
- Invitrogen Antibodies (provider)
- Main image
- Experimental details
- NULL
- Conjugate
- Yellow dye
- Submitted by
- Invitrogen Antibodies (provider)
- Main image
- Experimental details
- NULL
- Conjugate
- Yellow dye
- Submitted by
- Invitrogen Antibodies (provider)
- Main image
- Experimental details
- NULL
- Conjugate
- Yellow dye
- Submitted by
- Invitrogen Antibodies (provider)
- Main image
- Experimental details
- NULL
- Conjugate
- Yellow dye
- Submitted by
- Invitrogen Antibodies (provider)
- Main image
- Experimental details
- NULL
- Conjugate
- Yellow dye

- Submitted by
- Invitrogen Antibodies (provider)
- Main image
- Experimental details
- NULL
- Conjugate
- Yellow dye

- Submitted by
- Invitrogen Antibodies (provider)
- Main image
- Experimental details
- NULL
- Conjugate
- Yellow dye
- Submitted by
- Invitrogen Antibodies (provider)
- Main image
- Experimental details
- NULL
- Conjugate
- Yellow dye
- Submitted by
- Invitrogen Antibodies (provider)
- Main image
- Experimental details
- NULL
- Conjugate
- Yellow dye
- Submitted by
- Invitrogen Antibodies (provider)
- Main image

- Experimental details
- NULL
- Conjugate
- Yellow dye
- Submitted by
- Invitrogen Antibodies (provider)
- Main image
- Experimental details
- NULL
- Conjugate
- Yellow dye
- Submitted by
- Invitrogen Antibodies (provider)
- Main image
- Experimental details
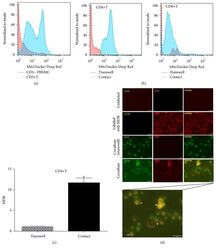
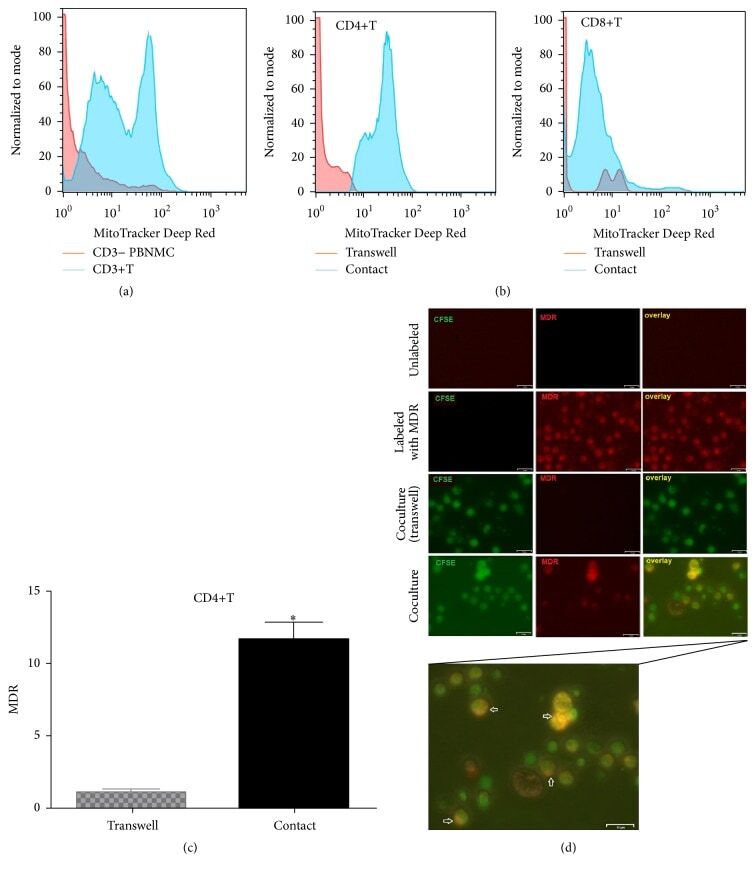
- Figure 7 UC-MSCs transferred mitochondria to activate T cells. PBMCs from SLE patients were labeled with carboxyfluorescein succinimidyl amino ester (CFSE) and treated with anti-CD3/CD28 antibodies for two days. Then they were cocultured with UC-MSCs for 12 h, which had been prelabeled with respiratory mitochondrion specific probe Mitotracker Deep Red (MDR). PBMCs were cultured with UC-MSCs through transwell as control. Then PBMCs were stained with anti-CD3, anti-CD4, or anti-CD8 dye and detected for MDR fluorescence with flow cytometry. Fluorescence microscopy was carried out similarly with anti-CD3/28 stimulation for 12 h and then cocultured for 6 h. All experiments were performed in triplicate. (a) T cells (CD3 positive) rather than non-T cells (CD3 negative) got MDR staining. (b-d) T cells cultured with UC-MSCs directly rather than through transwell got transferred mitochondria ( n = 3). Arrows indicated transferred mitochondria within lymphocytes. * p < 0.05.
- Conjugate
- Yellow dye
- Submitted by
- Invitrogen Antibodies (provider)
- Main image
- Experimental details
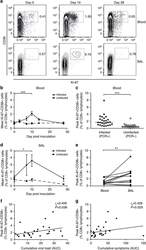
- Figure 3 RSV infection induces short-lived activation and proliferation of CD8+ T cells in peripheral blood. Forty-nine adult volunteers were inoculated with RSV Memphis 37, serial blood ( n =49) and BAL ( n =24) samples were stained with anti-CD3, CD8, Ki-67 and CD38, and analysed by flow cytometry. ( a ) Plots are gated on CD3+CD8+ lymphocytes. Numbers represent percentage of CD8+ T cells. One representative subject is shown. ( b ) Mean and s.e.m. of Ki-67+CD38+ CD8+ T-cell frequencies in the blood of infected (PCR+) and challenged but uninfected (PCR-) are shown. The P value for a two-tailed Wilcoxon matched pairs test is shown (*** P
- Conjugate
- Yellow dye
- Submitted by
- Invitrogen Antibodies (provider)
- Main image
- Experimental details
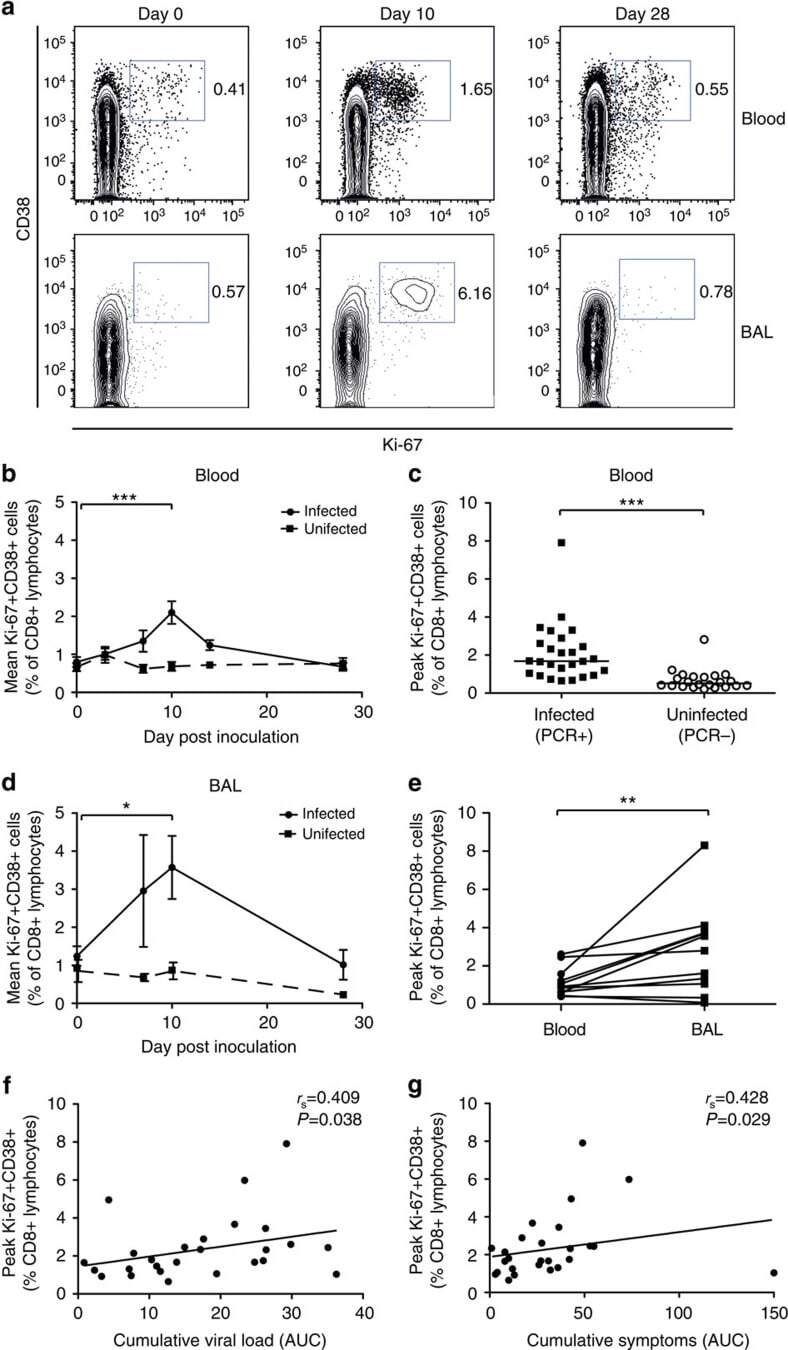
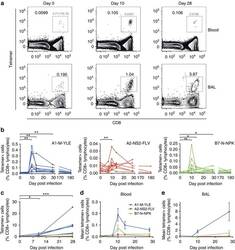
- Figure 5 RSV antigen-specific CD8+ T-cell kinetics diverge in BAL compared with blood. Whole blood/PBMCs and BAL from RSV-infected individuals were co-stained with anti-CD3, CD8 and tetramers, and then analysed by flow cytometry. ( a ) Numbers represent the percentage of A1-M-YLE+ CD8+ T cells as a proportion of CD3+ lymphocytes at day 0, 7, 10, 14 and 28 post inoculation. Representative plots for one subject gated on CD3+ lymphocytes are shown. ( b ) The frequencies of A1-M-YLE ( n =9), A2-NS2-FLV ( n =10) and B7-N-NPK ( n =8) tetramer-positive cells in blood as a proportion of CD8+ T cells are shown up to 6 months follow-up. P values for Wilcoxon matched pairs tests compared with day 0 are shown (A1-M-YLE day 10, P =0.0039; day 14, P =0.0039; day 28, P =0.0039; A2-NS2-FLV day 10, P =0.0488; B7-N-NPK day 10, P =0.0078; day 14, P =0.0223; and day 28, P =0.0207). ( c ) The frequencies of A1-YLE, A2-NS2-FLV and B7-N-NPK tetramer-positive cells in BAL as a proportion of CD8+ T cells are shown. P values for Wilcoxon matched pairs tests are shown comparing day 10 ( P =0.0156) and day 28 ( P =0.0002) frequencies with baseline. Abbreviated P values are shown: NS (not significant)= P >0.05, * P
- Conjugate
- Yellow dye
- Submitted by
- Invitrogen Antibodies (provider)
- Main image
- Experimental details
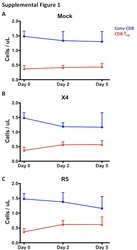
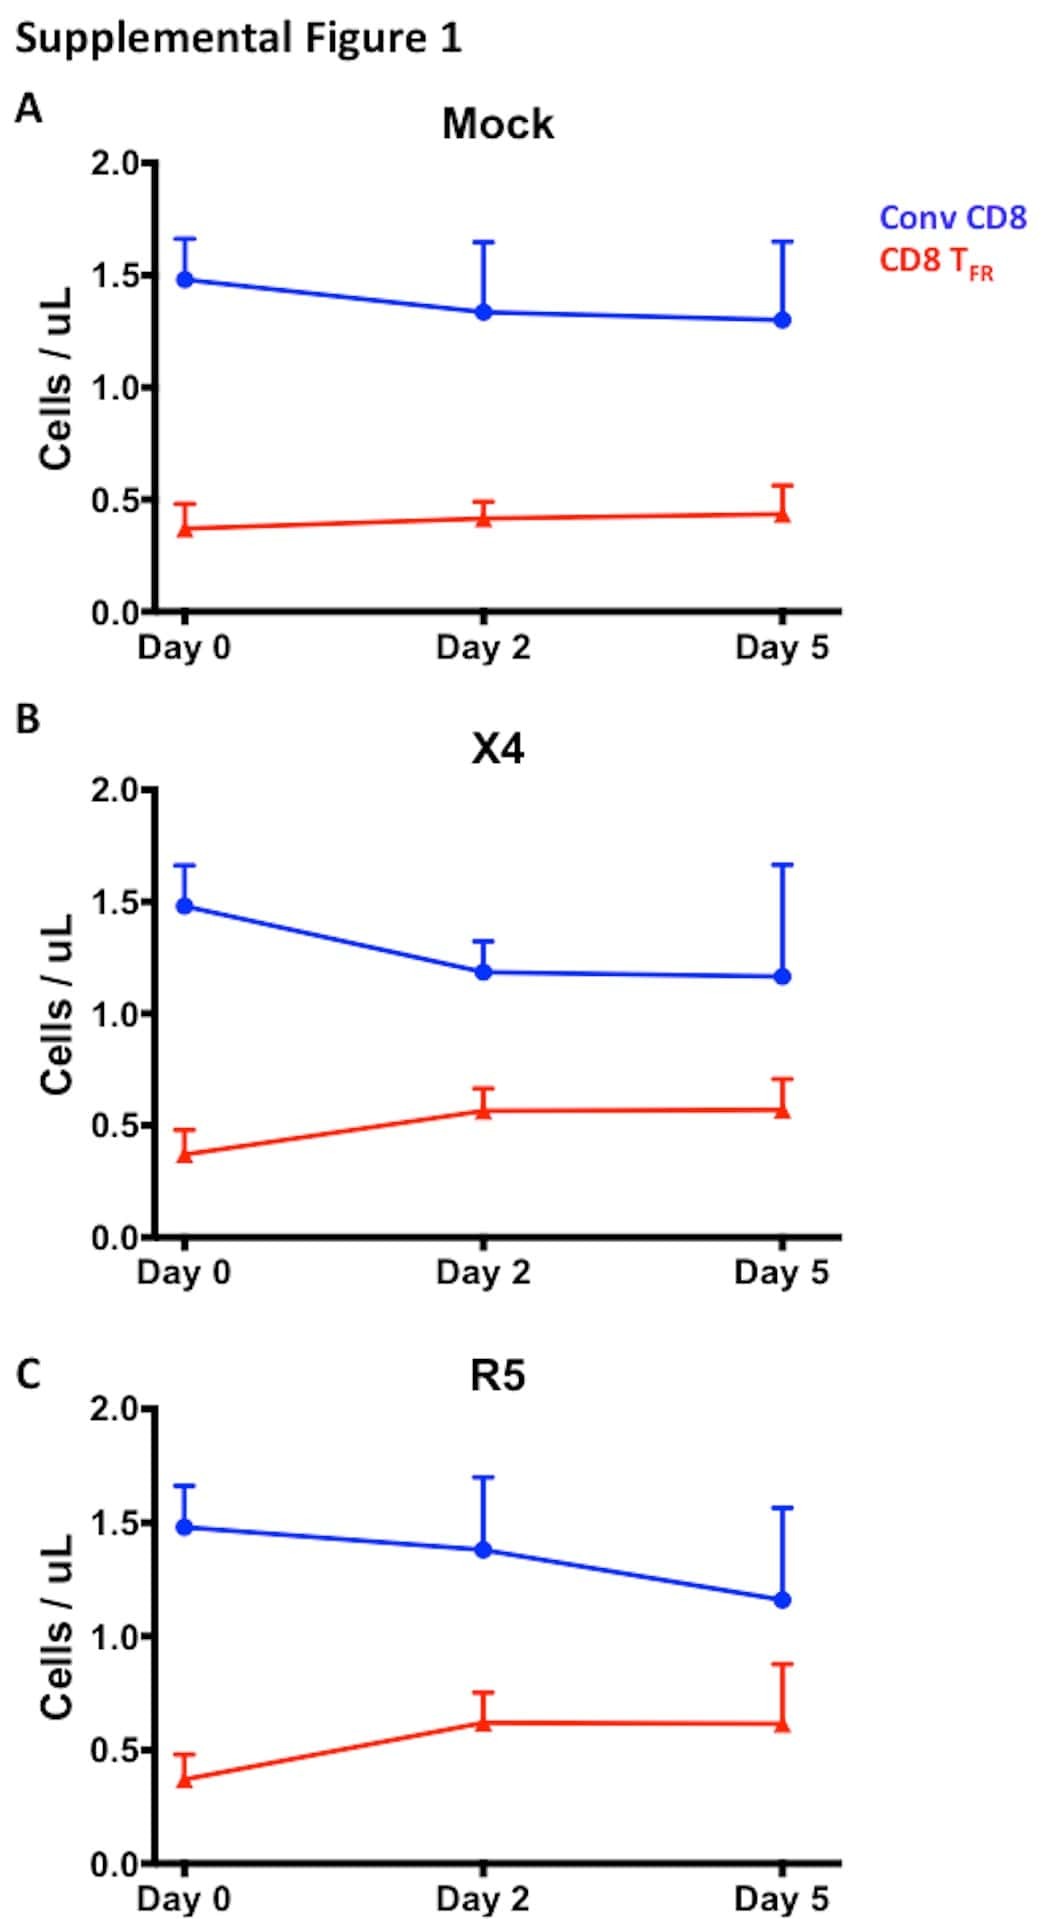
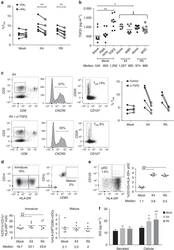
- Figure 4 Viral replication, TGF-beta signalling and regulatory dendritic cells promote T FR expansion. Tonsil cells were mock-spinoculated or spinoculated with X4 or R5 virus and cultured for 2 days under a variety of conditions. ( a ) Tonsil cells were treated with the integrase inhibitor raltegravir (RAL, 10 muM) during culture to allow viral entry but prevent integration and percentages of T FR determined ( n =5). ( b ) Tonsil cells were cultured under the conditions shown and TGF-beta-1 levels were measured in culture supernatant by ELISA ( n =8). ( c ) Tonsil cells were cultured in the presence of TGF-beta blocking antibodies (2 mug ml -1 ) and the percentages of T FR were measured ( n =4). Addition of anti-TGF-beta antibodies did not influence cell viability. ( d ) Tonsil cells were cultured under the conditions shown and then analysed for the presence of immature myeloid DCs (CD11c + CD1c + HLA-DRlo) and mature myeloid DCs (CD11c + CD1c + HLA-DR + CD83 + ; n =6). ( e ) Samples in d were also analysed for activated plasmacytoid DCs (CD123 + HLA-DR + , n =6). ( f ) Cell culture supernatants and lysates from d , e were analysed by ELISA to quantitate IDO production ( n =6). The horizontal bars of each graph indicate the median value and are listed where appropriate for clarity. Statistical analyses were performed using Wilcoxon matched-pairs tests ( a , c ) or Mann-Whitney ranked sums tests ( b , d - f ) and significance is denoted by asterisks where * P
- Conjugate
- Yellow dye
- Submitted by
- Invitrogen Antibodies (provider)
- Main image

- Experimental details
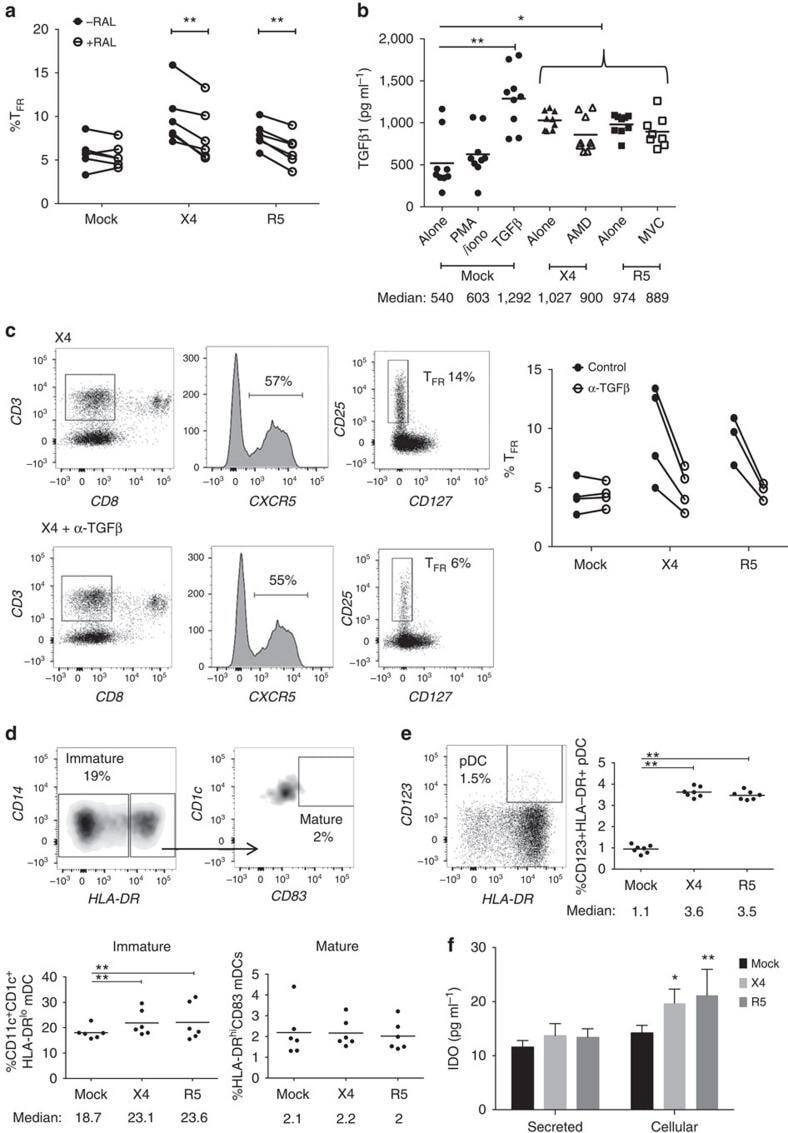
- Figure 5 Acquisition of CXCR5, enhanced proliferation and reduced apoptosis promote T FR expansion. ( a ) T FH and CXCR5 - T-cell populations were sorted and cultured without stimulation, or T FH were cultured in the presence of exogenous TGF-beta (100 ng ml -1 ). CXCR5 expression was analysed on sorted CXCR5 - cells after 2 days and cells expressing CXCR5 are labelled as 'new T FR '. The Foxp3 expression levels of T FH , T FH cultured with TGF-beta and 'new' T FR were determined ( n =3). ( b ) T FH and T FR were mock-, X4- or R5-spinoculated and cell proliferation measured by BrdU incorporation after 2 days of culture ( n =7). ( c , d ) A 5-day time course was performed to monitor T-cell population counts and rates of cell death with mock- or X4-spinoculated tonsil cells ( n =3). ( c ) Average counts of total (CD3 + CD8 - , circles), T FH (CXCR5 + CD25 lo/- , squares) and T FR (CXCR5 + CD25 hi CD127 - , triangles) are shown for the duration of culture ( n =3). ( d ) Stages of cell death are shown at day 5 and defined as early apoptosis (AnnexinV + ), late or advanced apoptosis (AnnexinV + PI + ) and necrotic death (PI + ; n =3). ( e ) Cell subsets from disaggregated lymphoid tissues of chronically SIV-infected ( n =6) and uninfected rhesus macaques ( n =8) were analysed for apoptosis by percent Annexin-V binding. Cell phenotypes were defined as total (CD3 + CD8 - ), Treg (CD3 + CD8-CD25 hi CD127 - ), T FH (CD3 + CD8-CXCR5 + CD25 lo/- ), T FR (CD3 + CD8-CX
- Conjugate
- Yellow dye
- Submitted by
- Invitrogen Antibodies (provider)
- Main image
- Experimental details
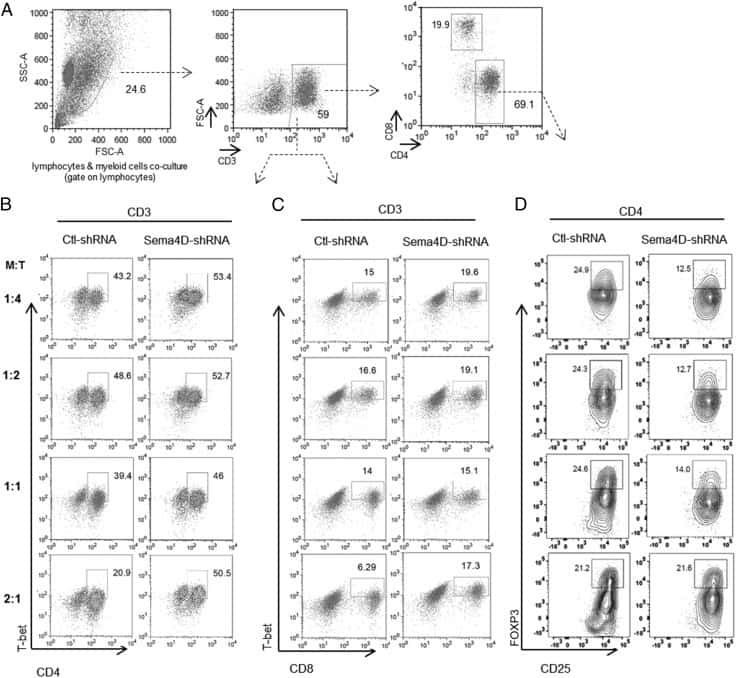
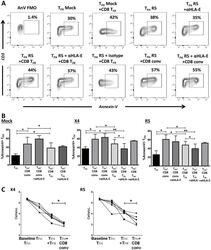
- Fig 4 Human tonsil CD8 T FR downregulate productive infection in T FH in a contact-dependent manner. Tonsil cells were spinoculated with X4- or R5-tropic GFP-reporter HIV. T FH were cultured alone or at a 1:1 ratio with CD8 T FR for 2 days and analyzed by flow cytometry (n = 10). (A) Percent GFP+ T FH and T FH GFP MFI. (B) The percent R5-GFP+ T FH when co-cultured with CD8 T FR and either isotype control antibody or HLA-E blocking antibody (500 ng/mul, n = 2). (C) The percent R5-GFP+ T FH when co-cultured with CD8 T FR and either isotype control antibody or IL-10 blocking antibody (ng/mul, n = 2). (D) The percent R5-GFP+ T FH when co-cultured in contact with or not in contact with CD8 T FR and conventional CD8 (n = 4). Statistical significance was determined by Wilcoxon matched-pairs tests and is displayed as * = p
- Conjugate
- Yellow dye

- Submitted by
- Invitrogen Antibodies (provider)
- Main image
- Experimental details
- Fig 5 CD8 T FR induces T FH apoptosis via HLA-E. Human tonsil cells were sorted to isolate CD8 T FR , CD8 conv, and T FH , spinoculated with R5-tropic HIV, and cultured for 2 days. (A) Representative flow plots showing the percent of Annexin-V+ T FH in co-culture at 1:1 ratio with CD8 T FR or CD8 conv 2 days after R5-spinoculatoin. (B) Results from a total of 6 tonsil for mock-, X4-, and R5-spinoculation (isotype n = 3) in A. Co-cultures were also performed with HLA-E blocking antibody or isotype controls (500 ng/mul). (C) Number of T FH per microliter on day 0 and day 2 when cultured alone (circle, triangle), 1:1 with CD8 T FR (square), or 1:1 with conventional CD8 T cells (upside down triangle) (n = 6). Statistical significance was determined by Wilcoxon matched-pairs tests and is displayed as * = p
- Conjugate
- Yellow dye
- Submitted by
- Invitrogen Antibodies (provider)
- Main image
- Experimental details
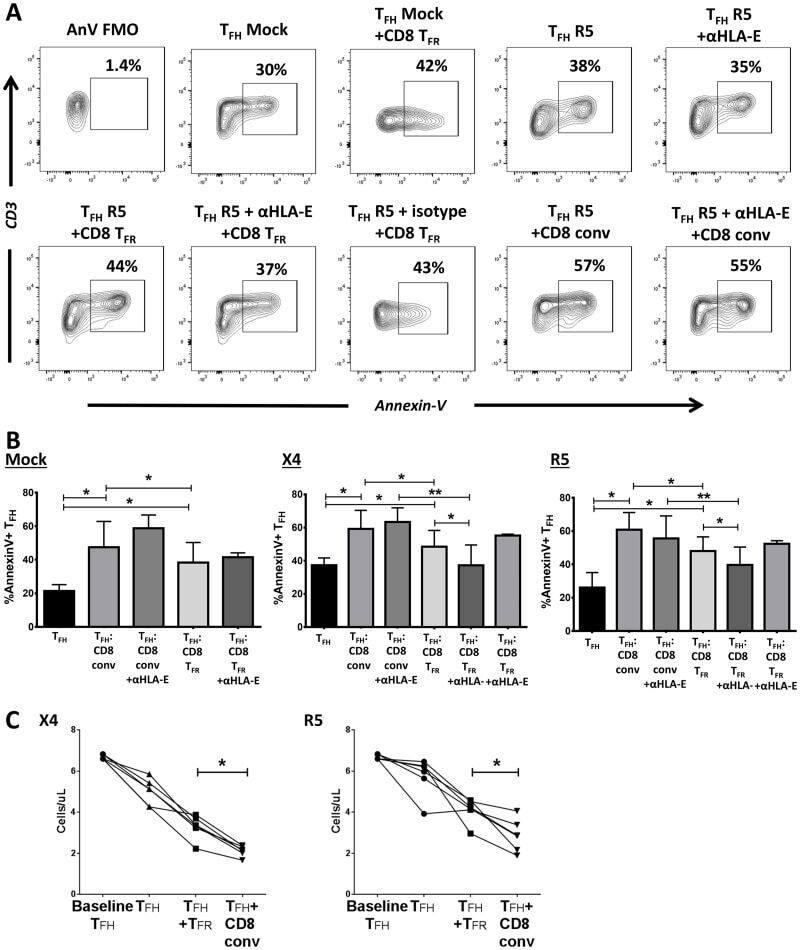
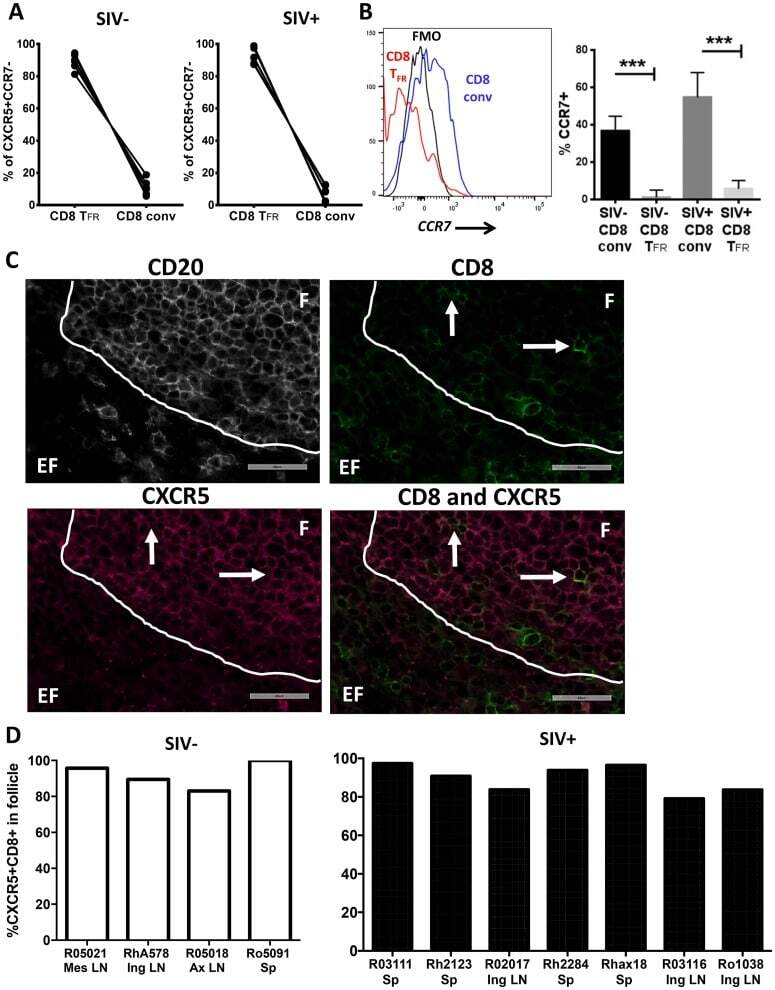
- Fig 7 Most rhesus macaque CXCR5+CCR7- CD8 T cells are CD8 T FR . Disaggregated cells from lymph node and spleen of SIV-uninfected (n = 6) and SIV-infected (n = 6) rhesus macaques were analyzed by flow cytometry. (A) Percentages of CD8 T FR and CD8 conv from all CD3+CD8+CXCR5+CCR7- are shown for SIV-uninfected and SIV-infected animals. (B) The percent CCR7+ cells in CD8 T FR and CD8 conv cell populations(C) Representative images of rhesus macaque spleen tissue staining. CD20 staining was performed to determine follicular (F) and extrafollicular (EF) regions. (D) The percentage of CXCR5+ CD8 T cells in follicular and extrafollicular regions as determined from images similar to C. Left plot (white bars) show uninfected rhesus macaques, right plot (black bars) show chronically infected rhesus macaques. LN = lymph node, Mes = mesenteric, Ing = inguinal, Ax = axial, and Sp = spleen. Graphs depict median and range. Statistical significance was determined by non-parametric one-way ANOVA (Friedman test) and is displayed as *** = p
- Conjugate
- Yellow dye
- Submitted by
- Invitrogen Antibodies (provider)
- Main image
- Experimental details
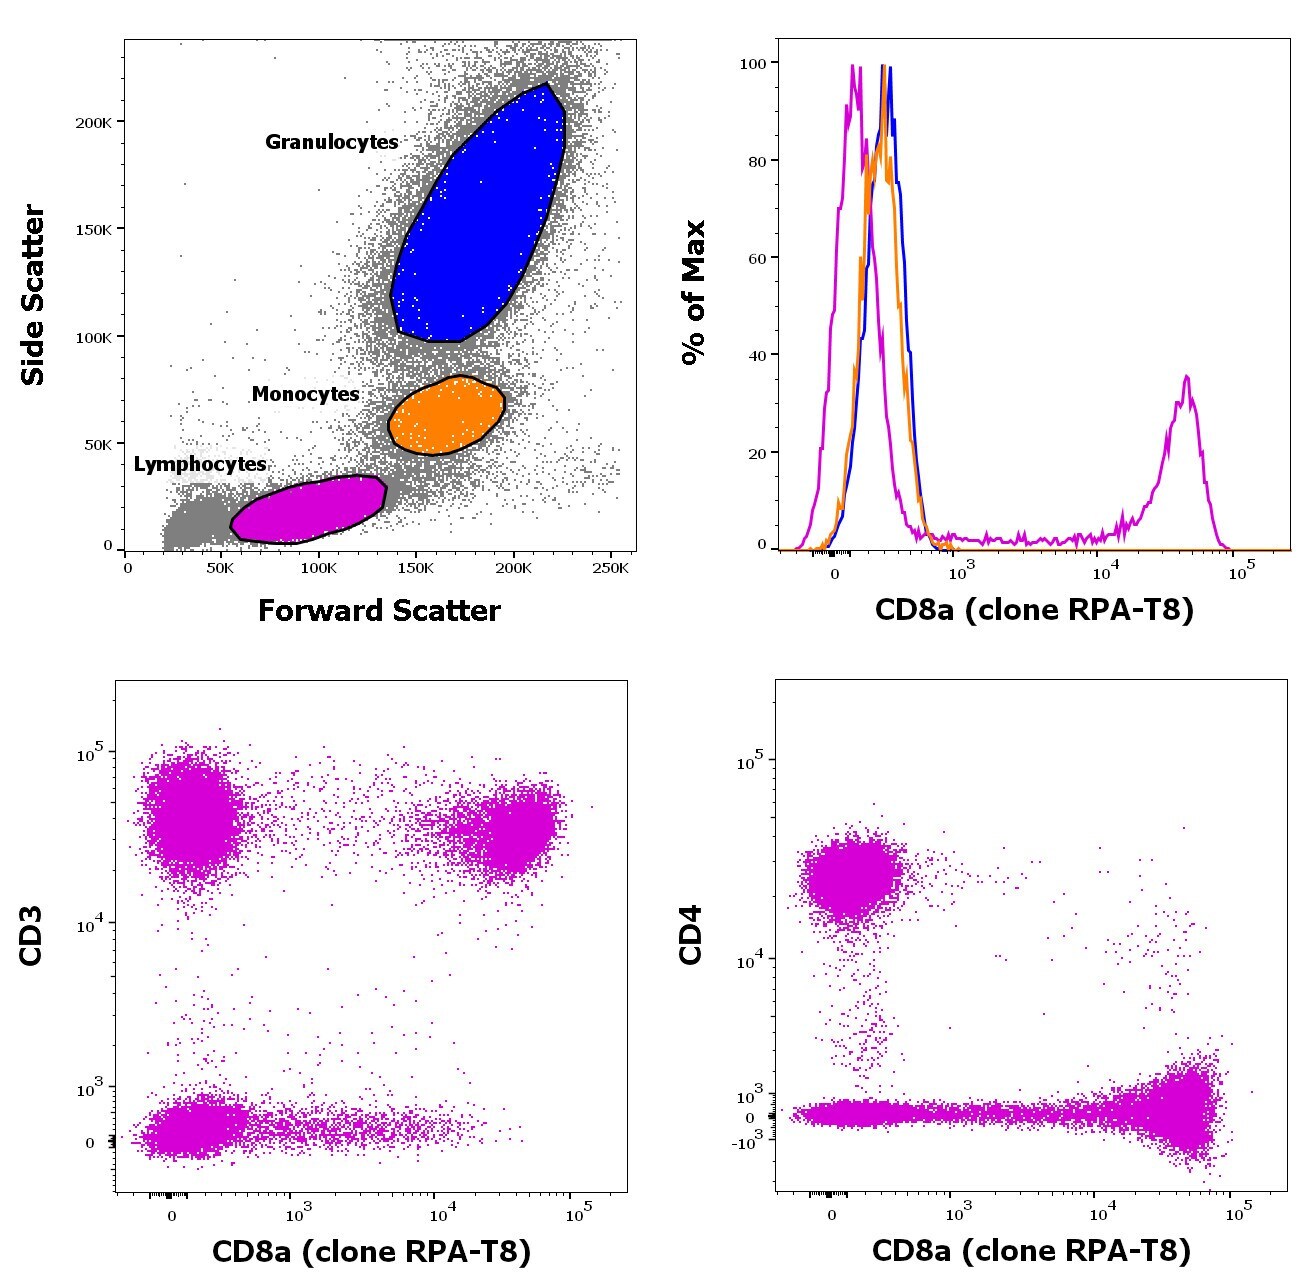
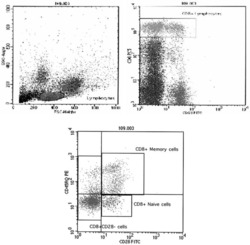
- Fig. 1 CD8+ lymphocyte subtypes in FACS. The lymphocytes (in FS/SS histogram) and CD8 bright cells (in lymphocytes) were gated. The percentage of CD8+ lymphocyte subtypes (%) was calculated in CD8+ lymphocyte gated CD28/ CD45RO histogram
- Conjugate
- Yellow dye

- Submitted by
- Invitrogen Antibodies (provider)
- Main image
- Experimental details
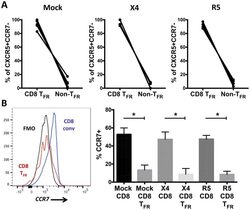
- Fig 2 Most human tonsil follicular homing CD8 T cells are CD8 T FR . Disaggregated tonsil cell cultures were mock-spinoculated or spinoculated with X4- or R5-tropic HIV and cultured for 2 days (n = 6). (A) Of the viable CD3+CD8+ population expressing the follicular phenotype CXCR5+CCR7-, the percent CD44 hi (CD8 T FR ) and all other CD3+CD8+ (CD8 conv) in mock- and HIV-spinoculated cultures is shown. (B) The percent CCR7 expression on CD8 T FR (red) and CD8 conv (blue) compared to an FMO control (black). Graphs depict median and range. Statistical significance was determined by non-parametric one-way ANOVA (Friedman test) and is displayed as * = p
- Conjugate
- Yellow dye
- Submitted by
- Invitrogen Antibodies (provider)
- Main image

- Experimental details
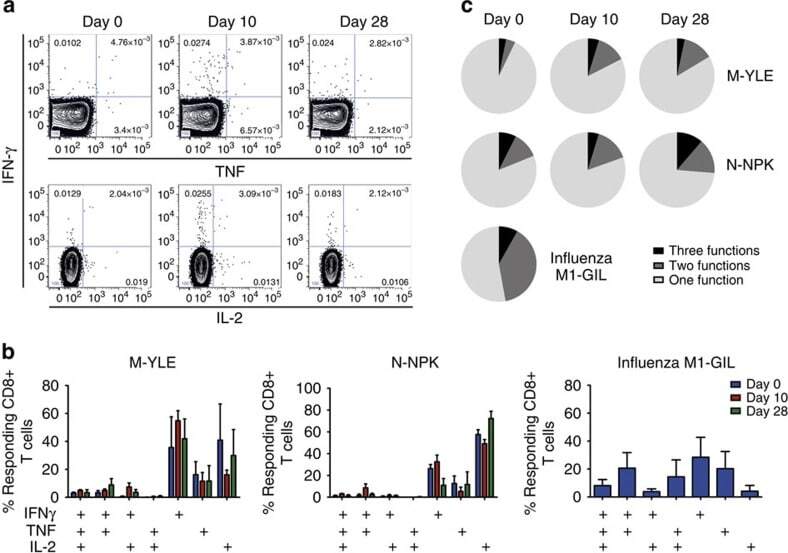
- Figure 8 RSV-specific CD8+ T cells in blood show limited polyfunctionality. PBMCs from individuals inoculated with RSV were stimulated with peptide epitopes (YLE, n =3; NPK, n =4; and influenza M1-GIL, n =6) and subsequently intracellularly stained for IFN-gamma, tumour necrosis factor (TNF) and interleukin-2 (IL-2) for analysis by flow cytometry. ( a ) Flow cytometric data gated on CD3+CD8+ lymphocytes from one representative donor are shown. Numbers represent percentage of CD8+ lymphocytes. ( b ) The mean (+-s.e.m.) frequencies of cytokine-producing CD8+ T cells as determined by Boolean gating are shown as percentages of total responding cells. ( c ) The proportion of single, double and triple cytokine producers is shown.
- Conjugate
- Yellow dye
- Submitted by
- Invitrogen Antibodies (provider)
- Main image
- Experimental details
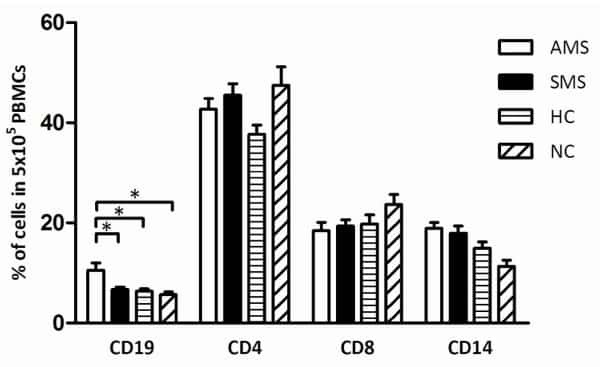
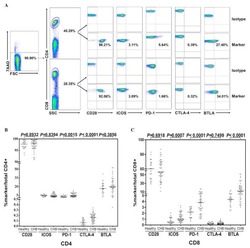
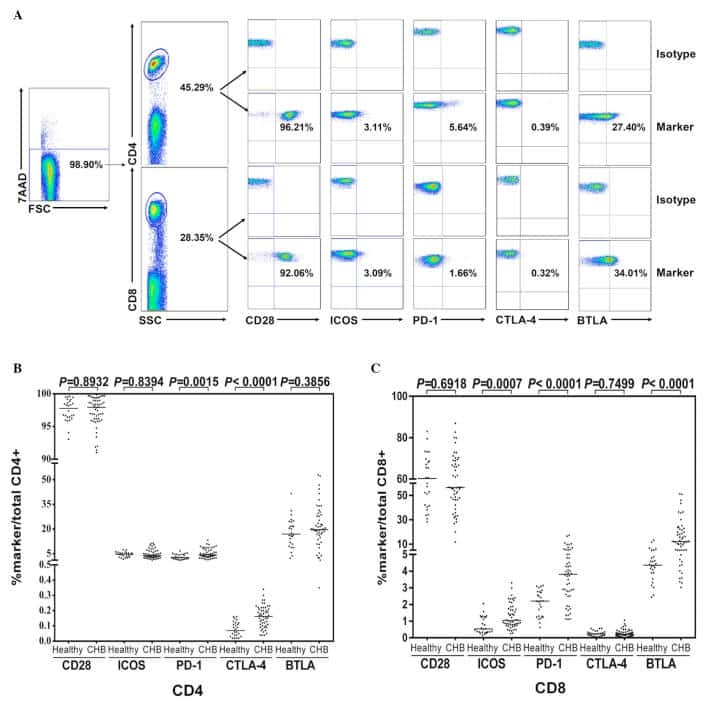
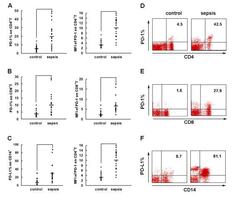
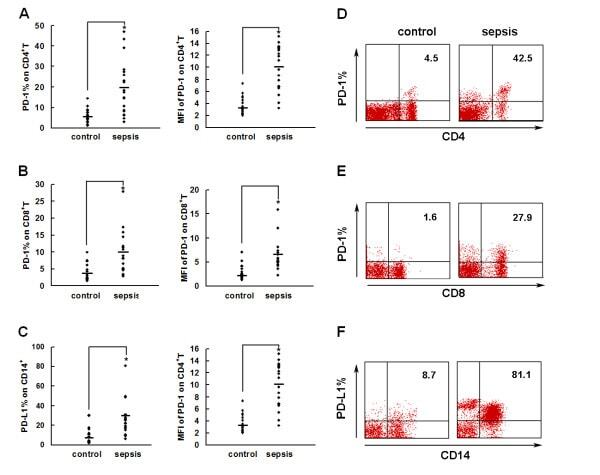
- Figure 2 PD-1 and PD-L1 were upregulated on T cells and monocytes in septic shock patients . Blood samples were obtained from 19 septic shock patients and 22 healthy controls and were stained for programmed death-1 (PD-1) and programmed death ligand-1 (PD-L1) gated on CD4 + T cells, CD8 + T cells, and CD14 + monocytes. (a) to (c) Percentage of PD-1 expression on (a) CD4 + T cells and (b) CD8 + T cells, and (c) percentage of PD-L1 expression on CD14 + monocytes. Each dot represents one individual. Data are mean +- standard error of the mean (SEM) of three independent experiments. ** P < 0.01 compared with healthy controls. (d) to (f) Mean fluorescence intensity (relative fluorescence units) of PD-1 expression on (d) CD4 + T cells, (e) PD-1 expression on CD8 + T cells, and (f) PD-L1 expression on CD14 + monocytes Each dot represents one individual. Data are mean +- SEM of three independent experiments. * P < 0.05 compared with healthy controls. (g) Representative PD-1 expression levels on CD4 + T cells and CD8 + T cells, and PD-L1 expression on CD14 + monocytes. Values in the upper-right quadrant indicate the percentage of cells that express PD-1 or PD-L1.
- Conjugate
- Yellow dye
- Submitted by
- Invitrogen Antibodies (provider)
- Main image

- Experimental details
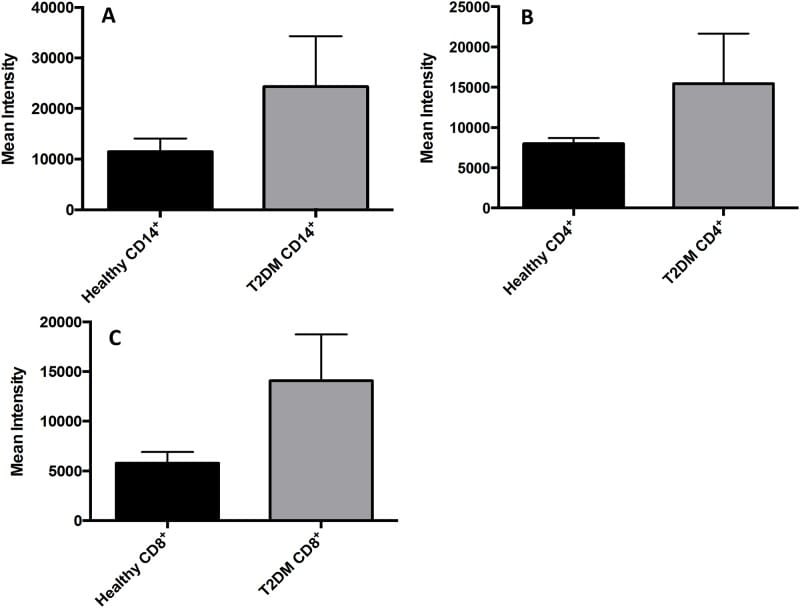
- Fig 7 Measurement of ROS in CD14 + cells, CD4 + T-cells, and CD8 + T-cells by cellROX stain mean intensity in T2DM patients compared to healthy. CD14 + cells were stained with cellROX green reagent, a marker of ROS, and a CD14 cell marker, CD14-PE. CD14 + -ROX + cells' mean intensity was analyzed by FLOW cytometry. There was an observable increase in ROX mean intensity in CD14 + cells isolated from individuals with T2DM compared to healthy volunteers (Fig. 7A). CD4 + cells were also stained with cellROX green reagent and a CD4 cell marker, CD4-Cy5. CD4 + -ROX + cells' mean intensity was analyzed by FLOW cytometry. There was an observable increase in ROX mean intensity in CD4 + T-cells isolated from individuals with T2DM compared to healthy volunteers (Fig. 7B). CD8 + cells were stained with cellROX green reagent and a CD8 cell marker, CD8-Cy5. CD8 + -ROX + cells' mean intensity was analyzed by FLOW cytometry. There was an observable increase in ROX mean intensity in CD8 + T-cells isolated from individuals with T2DM compared to healthy volunteers (Fig. 7C). Data represents mean +-SE from 5 healthy individuals and 5 individuals with T2DM.
- Conjugate
- Yellow dye
- Submitted by
- Invitrogen Antibodies (provider)
- Main image
- Experimental details
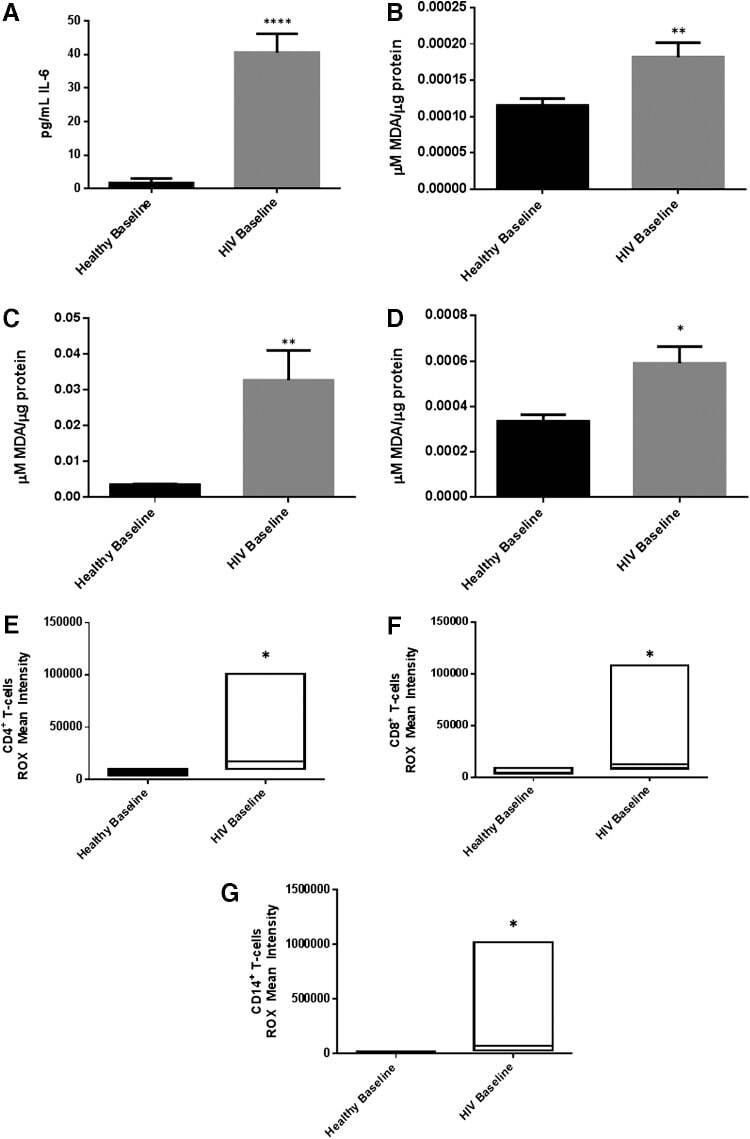
- FIG. 2. Baseline comparison of the interleukin-6 (IL-6) and reactive oxygen species (ROS) markers between healthy volunteers and HIV-positive individuals. We observed a significant increase in the levels of the proinflammatory cytokine, IL-6 in plasma samples collected from individuals with HIV infection compared to healthy individuals (A) . Data represent mean+-SE from comparing baseline levels of 10 healthy volunteers and 15 HIV-positive individuals, **** P
- Conjugate
- Yellow dye
- Submitted by
- Invitrogen Antibodies (provider)
- Main image
- Experimental details
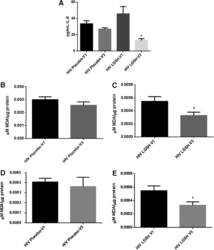
- FIG. 6. Difference in plasma IL-6 levels and ROS markers pre- and post-GSH supplementation. Sandwich ELISA was performed to compare the cytokine levels between pre-supplementation (V1) and post-supplementation (V3). Assay of cytokines showed a significant decrease in the levels of IL-6 in plasma samples collected from the lGSH-treatment group. There was no significant difference between the levels of IL-6 from the placebo group when comparing visit 1 and visit 3 (A) . Data represent mean+-SE, * P
- Conjugate
- Yellow dye

- Submitted by
- Invitrogen Antibodies (provider)
- Main image
- Experimental details
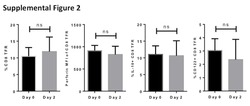
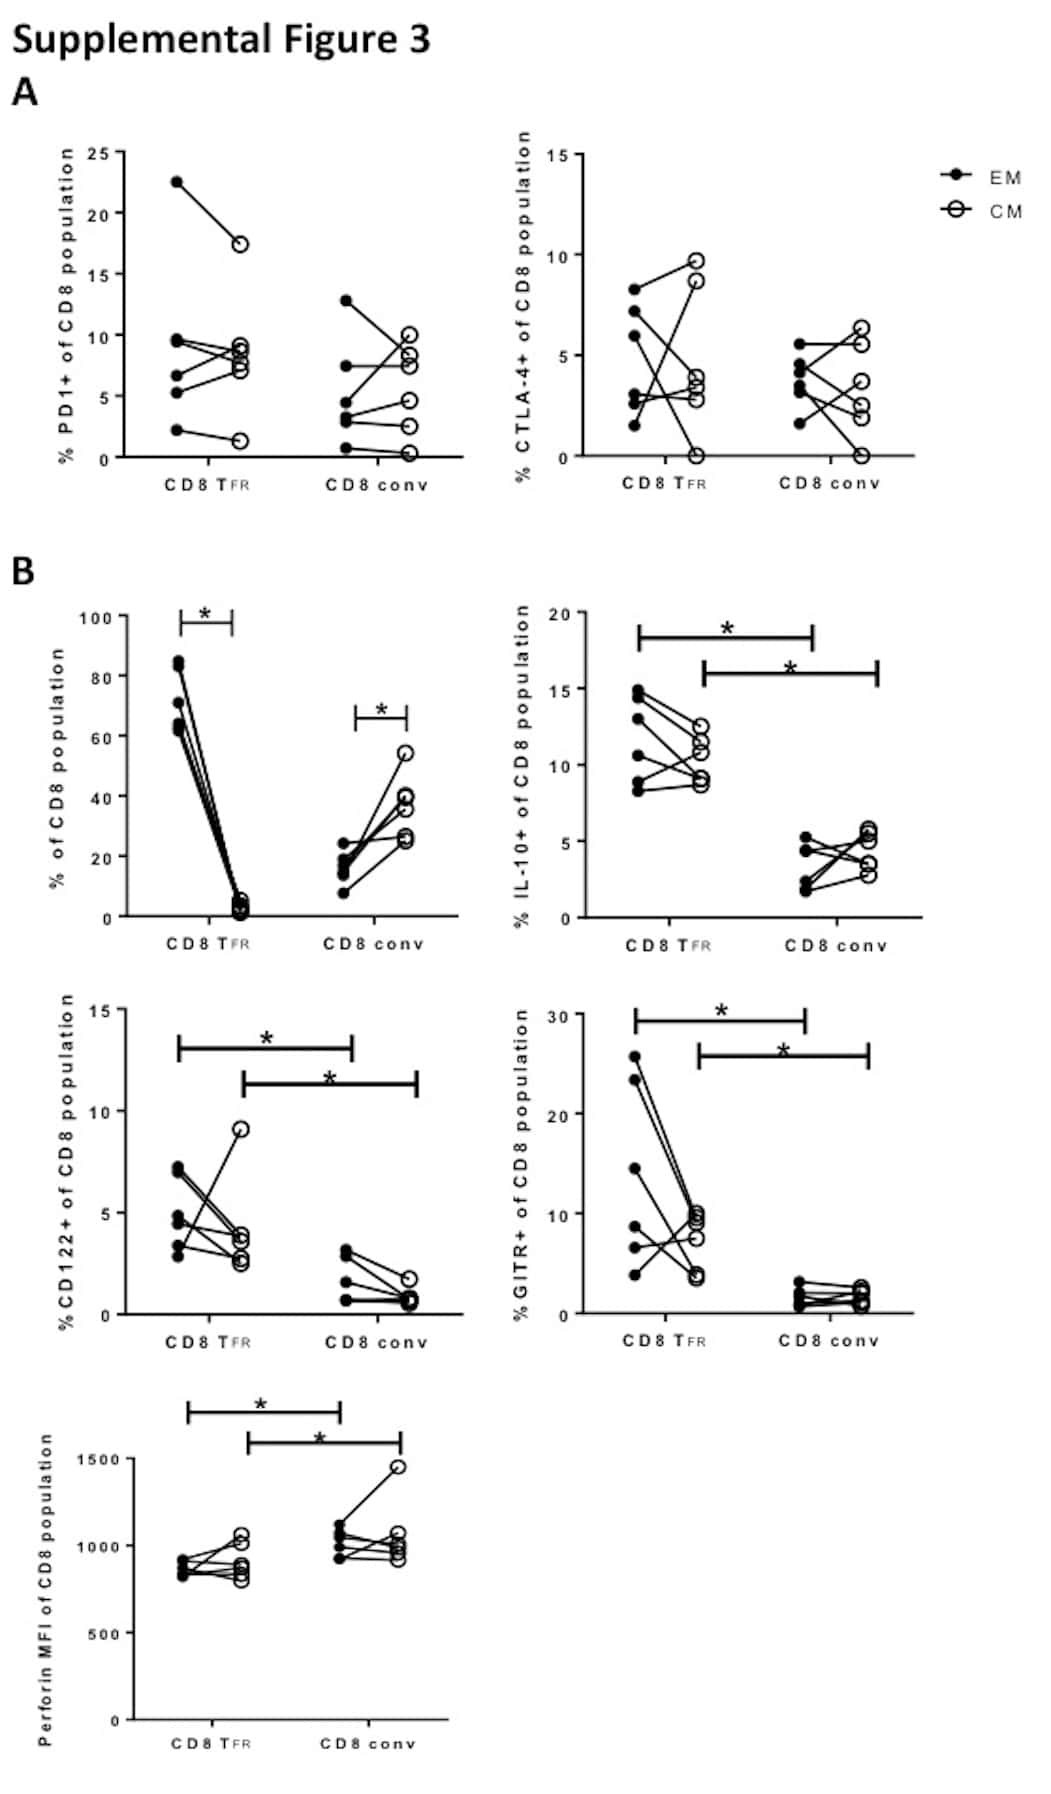
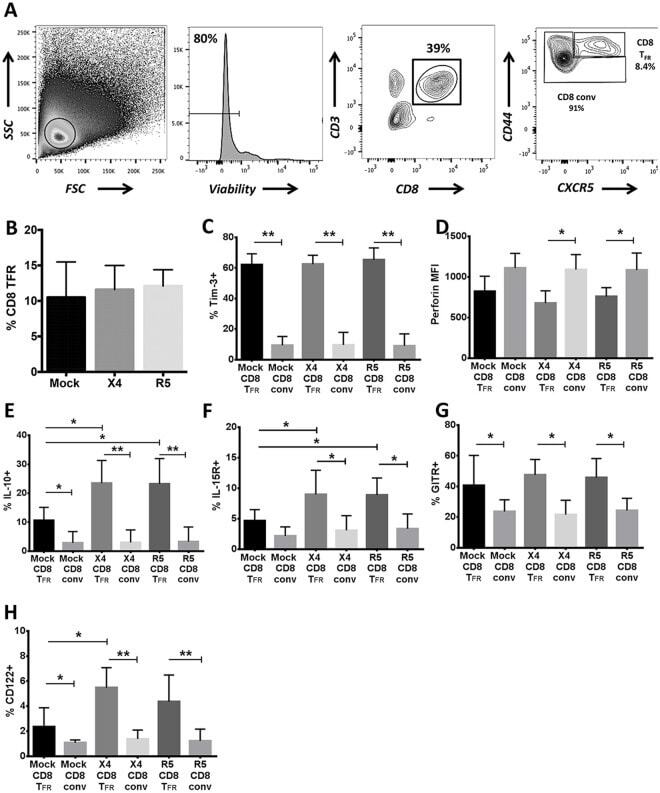
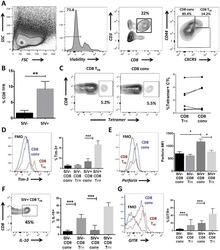
- Fig 1 Human tonsil CD8 T FR are distinct from conventional CD8 T cells. Disaggregated tonsil cell cultures were mock-spinoculated or spinoculated with X4- or R5-tropic HIV and cultured for 2 days (n = 8). (A) Flow gating strategy to determine viable, CD8 T FR (CD3+CD8+CXCR5 hi CD44 hi ) and all other CD3+CD8+ cells (CD8 conv). (B) The percentage of CD8 T FR in mock- or HIV-spinoculated samples. The percent or MFI of CD8 T FR and CD8 conv expressing (C) Tim-3, (D) perforin, (E) IL-10, (F) IL-15 receptor, (G) GITR, and (H) CD122 (IL-2Rbeta). Graphs depict median and range. Statistical significance was determined by non-parametric one-way ANOVA (Friedman test) and is displayed as * = p
- Conjugate
- Yellow dye
- Submitted by
- Invitrogen Antibodies (provider)
- Main image
- Experimental details
- Fig 6 CD8 T FR are higher in SIV-infected than uninfected rhesus macaques. Disaggregated cells from lymph nodes and spleen of SIV-uninfected (n = 6) and SIV-infected (n = 6) rhesus macaques were analyzed for CD8 T FR by flow cytometry. (A) Flow gating strategy to determine viable CD8 T FR (CD3+CD8+CXCR5 hi CD44 hi ) and CD8 conv. (B) Percent CD8 T FR in SIV-uninfected compared to SIV-infected rhesus macaques. (C) Percent of SIV-Gag tetramer+ CD8 T FR compared to CD8 conv. CD8 T FR and CD8 conv from SIV-uninfected and SIV-infected rhesus macaques were analyzed for percent or MFI expression of (D) Tim-3, (E) perforin, (F) IL-10, and (G) GITR. Graphs depict median and range. Statistical significance was determined by non-parametric one-way ANOVA (Friedman test) and is displayed as * = p
- Conjugate
- Yellow dye
- Submitted by
- Invitrogen Antibodies (provider)
- Main image
- Experimental details
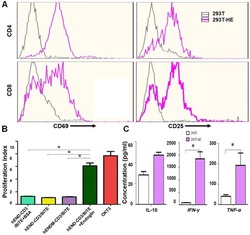
- Figure 3 hEND-CD3/BiTE activates T cells, stimulates T-cell proliferation, and increases secretion of Th1 cytokines. (A) PBMCs were co-cultured with 293T (grey signal) or 293T-hE (pink signal) cells in the presence of hEND-CD3/BiTE. The expression of T-cell activation markers CD69 (left panels) and CD25 (right panels) was detected in CD4 + (upper rows) and CD8 + (lower rows) by flow cytometry. (B) Proliferation of CFSE-labeled T cells in response to hEND-CD3/BiTE and other indicated reagents in the solid phase was measured using flow cytometry. The proliferation index was calculated using the ModFit LT software. (C) Supernatants were collected from the co-cultures of PBMCs with 293T (white bar) or 293T-hE cells (purple bar) in the presence of hEND-CD3/BiTE. The secretion of Th1 cytokines, including IFN-gamma, and TNF-alpha, and Th2 cytokine IL10 was measured using ELISA assays. * P < 0.001.
- Conjugate
- Yellow dye

- Submitted by
- Invitrogen Antibodies (provider)
- Main image
- Experimental details
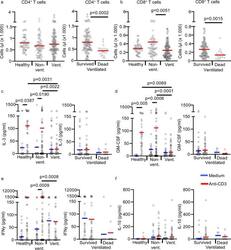
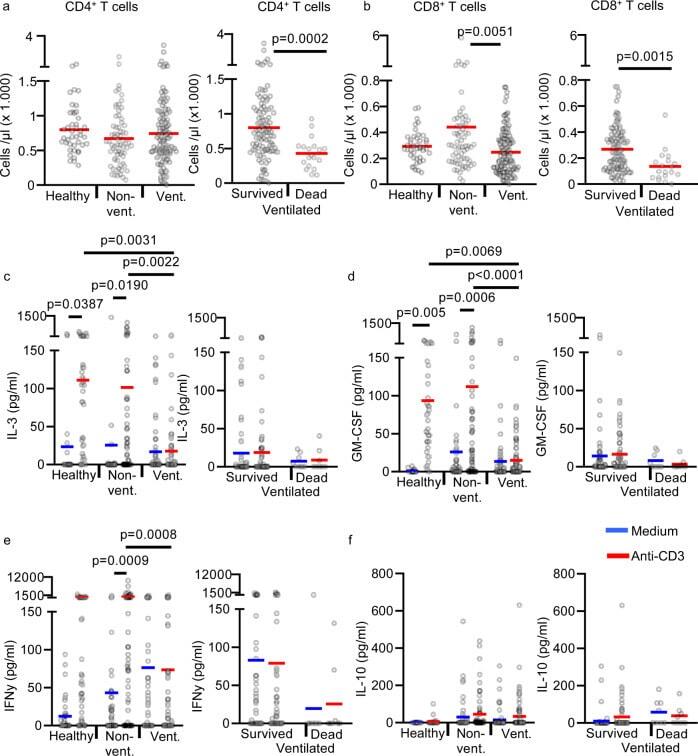
- Fig. 2 T-cell counts and cytokine release in anti-CD3 activated whole-blood samples. a , b Absolute CD4 + and CD8 + T-cell counts in non-cultured fresh blood of 42 healthy controls (healthy; n = 42 biologically independent samples), 39 non-ventilated COVID-19 patients (non-vent. ; n = 68 biologically independent samples) and 30 ventilated COVID-19 patients (vent. ; n = 120 biologically independent samples). Ventilated patients were stratified into ""survived"" (23 patients, n = 101 biologically independent samples) and ""dead"" (7 patients, n = 19 biologically independent samples). Each sample is represented by one dot, and the mean is marked in red. c - e Whole blood from 38 healthy controls (healthy; n = 38 biologically independent samples), 33 non-ventilated (non-vent. ; n = 58 biologically independent samples) and 21 mechanically ventilated (vent. ; n = 77 biologically independent samples) COVID-19 patients was cultured with or without immobilized anti-CD3 for 24 h. Ventilated patients were stratified into ""survived"" (17 patients, n = 69 biologically independent samples) and ""dead"" (4 patients, n = 8 biologically independent samples). Concentrations of IL-3 ( c ), GM-CSF ( d ), IFN-gamma ( e ), and IL-10 ( f ) were measured in the culture supernatant by ELISA. Each sample is represented by one dot, and the mean is marked in blue (medium) or red (anti-CD3). One-way ANOVA with Bonferroni multiple comparison test was used. Two-tailed unpaired t test was used for the anal
- Conjugate
- Yellow dye
- Submitted by
- Invitrogen Antibodies (provider)
- Main image
- Experimental details
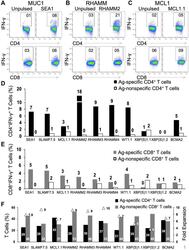
- Figure 1 Natural CD4 + and CD8 + T cells from unfractionated healthy donor PBMCs are activated and readily propagated by peptides in an Ag-specific manner. Freshly thawed PBMCs from healthy donors were exposed to single peptides (50 mug/ml) in the presence of GM-CSF and Toll-like receptor agonists (resiquimod and LPS) followed by gamma c cytokine IL-7. Representative dot-plots for CD4 + IFN-gamma + (top panel) and CD8 + IFN-gamma + (bottom panel) following secondary stimulation of T cells generated against ( A ) SEA1 (designed from MUC1 Ag), ( B ) RHAMM2 and ( C ) MCL1.1 with either unpulsed or the specific peptide-pulsed PBMCs. Values shown for unpulsed cells are typical and have been subtracted in subsequent figures. ( D ) Bar graph depicting the percentage of Ag-specific and Ag non-specific CD4 + IFN-gamma + and ( E ) CD8 + IFN-gamma + T cells. ( F ) Graph depicting percentages of CD4 + and CD8 + T cells and fold expansion (triangles) observed for T cells generated following primary stimulation with SEA1, SLAMF7.5, MCL1.1, RHAMM2, RHAMM3, RHAMM4, WT1.1, XBP(S)1.1, XBP(S)1.2 or BCMA2. Data from two experiments.
- Conjugate
- Yellow dye
- Submitted by
- Invitrogen Antibodies (provider)
- Main image
- Experimental details
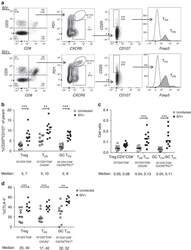
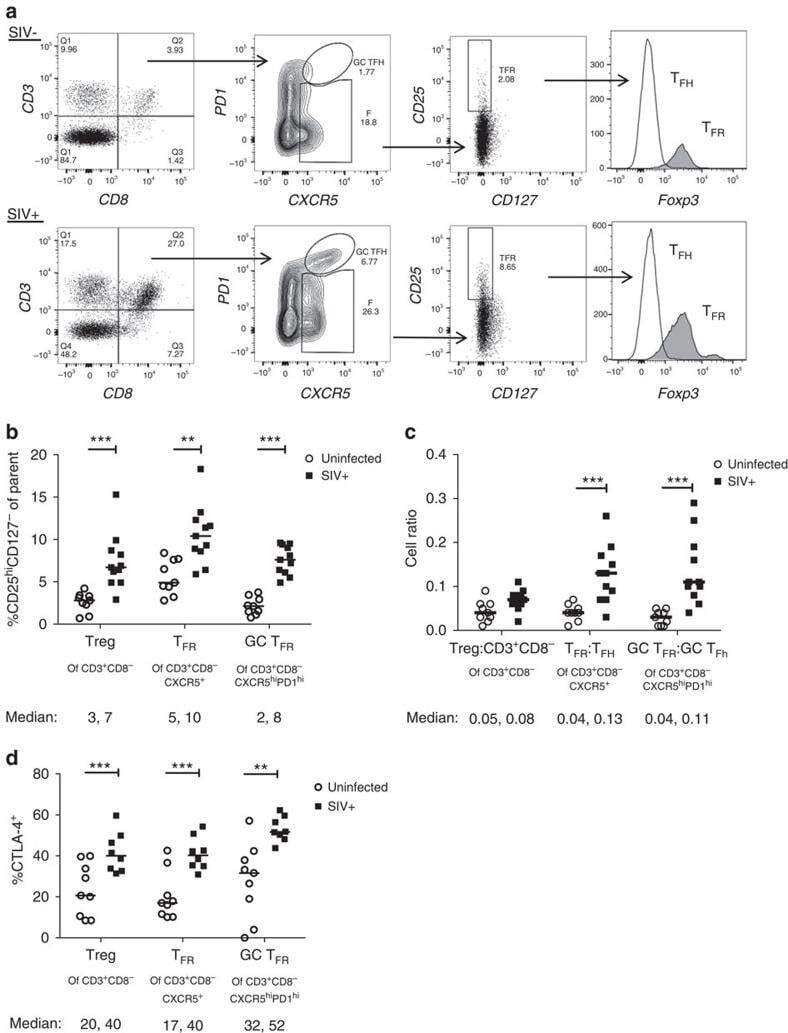
- Figure 2 T FR expansion in lymphoid tissues during chronic SIV infection. ( a ) Disaggregated lymph node and spleen cells from SIV uninfected ( n =9) or chronically SIV-infected rhesus macaques ( n =11) were analysed by flow cytometry. Representative examples of flow cytometry gating are shown. Of viable CD3 + CD8 - cells, follicular subsets were defined as CXCR5 + cells (F) and germinal centre subsets were defined as CXCR5 hi PD-1 hi cells (GC). Of these subsets, regulatory cells were defined as CD25 hi CD127 - . T FR (CXCR5 + CD25 hi CD127 - ) were Foxp3 + , whereas T FH (CXCR5 + CD25 lo/- ) were Foxp3 - . ( b ) The percentages of each rhesus macaque regulatory subset, as analysed in a are shown. ( c ) The ratios of each regulatory cell population to its non-regulatory cell counterpart are shown. ( d ) The percentage of total CTLA-4 expression is shown in SIV-uninfected ( n =9) and chronically SIV-infected ( n =8) rhesus macaques. The horizontal bars of each graph indicate the median value and are listed where appropriate for clarity. Statistical analyses were performed by Mann-Whitney (Wilcoxon) tests to compare unpaired, nonparametric values and significance is denoted by asterisks where * P
- Conjugate
- Yellow dye
- Submitted by
- Invitrogen Antibodies (provider)
- Main image
- Experimental details
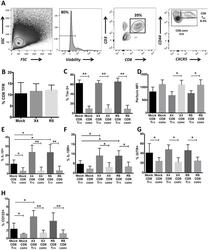
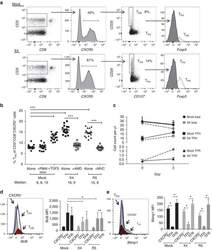
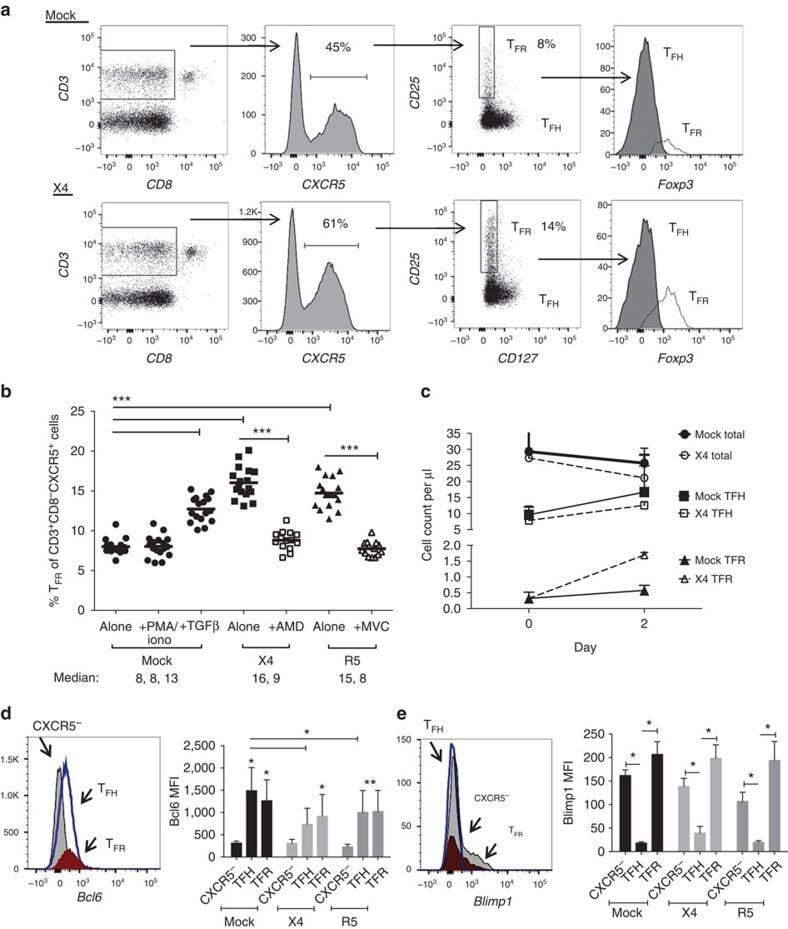
- Figure 3 HIV entry and replication promote T FR expansion. Disaggregated tonsil cells were spinoculated with X4 or R5 HIV and T FR populations were analysed by flow cytometry ( n =15). ( a ) A representative example of tonsil cell flow gating. From viable CD3 + CD8 - cells, T FR are defined as CXCR5 + and CD25 hi CD127 - . T FR cells contain Foxp3 + cells, whereas remaining T FH (CXCR5 + CD25 lo/- ) cells are Foxp3 - . ( b ) Percentages of T FR determined by gating strategies in a are shown. Experimental conditions include mock-spinoculated cells cultured with PMA (50 ng ml -1 ) and ionomycin (1 mug ml -1 ) or exogenous TGF-beta (100 ng ml -1 ) for 24 h and cells pretreated to block CXCR4 (AMD, 200 muM) and CCR5 (MVC, 2 muM). ( c ) Using flow cytometry counting beads, the number of cells per mul were determined for total (CD3 + CD8 - ), T FH (CXCR5 + CD25 lo/- ) and T FR (CXCR5 + CD25 hi CD127 - ) subsets in mock- and X4-spinoculated samples ( n =3). ( d ) Bcl-6 expression is shown in CXCR5- (grey), T FH (blue) and T FR (red) populations after mock-, X4- or R5-spinoculation ( n =5). ( e ) Blimp-1 expression was also determined as in d . The horizontal bars of each graph indicate the median value and are listed where appropriate for clarity. Statistical analyses were performed by Friedman nonparametric tests ( b , d , e ) and significance is denoted by asterisks where * P
- Conjugate
- Yellow dye
- Submitted by
- Invitrogen Antibodies (provider)
- Main image
- Experimental details
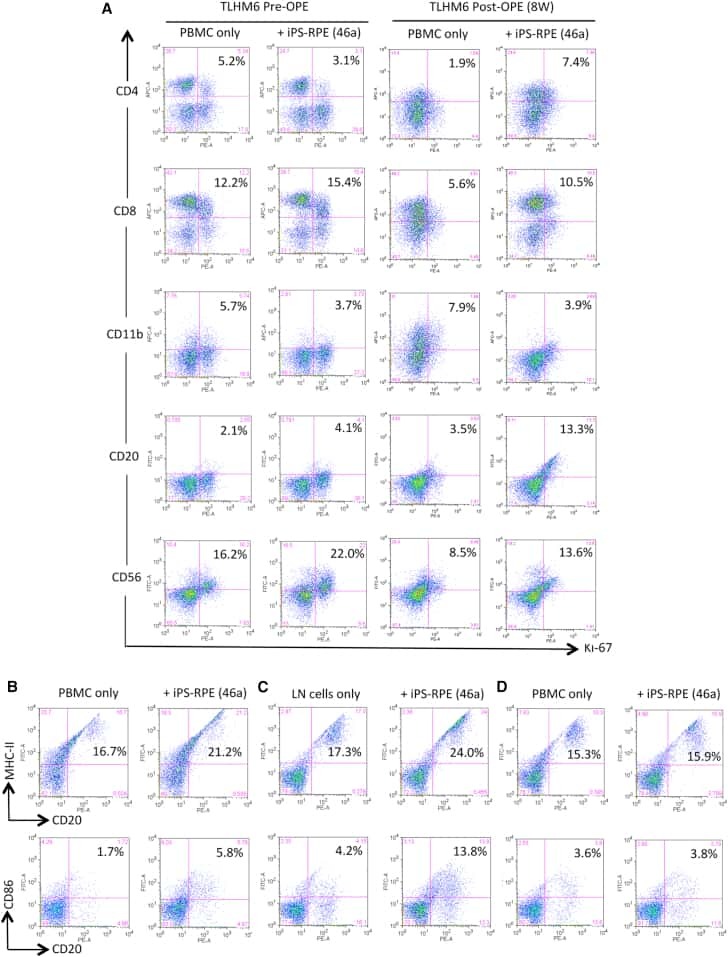
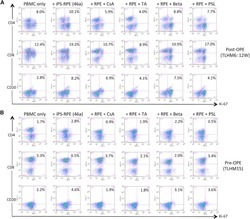
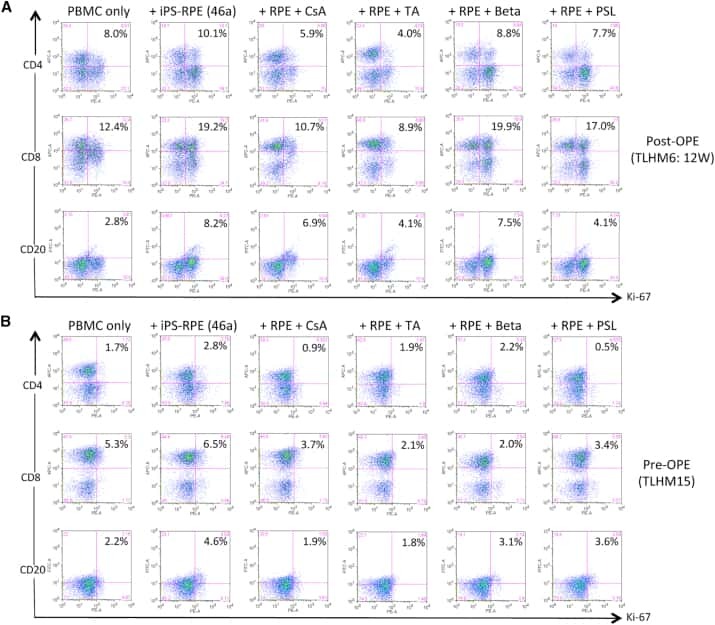
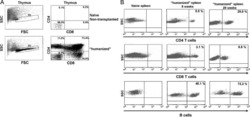
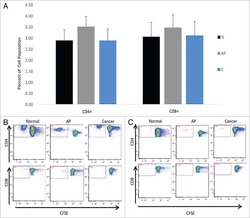
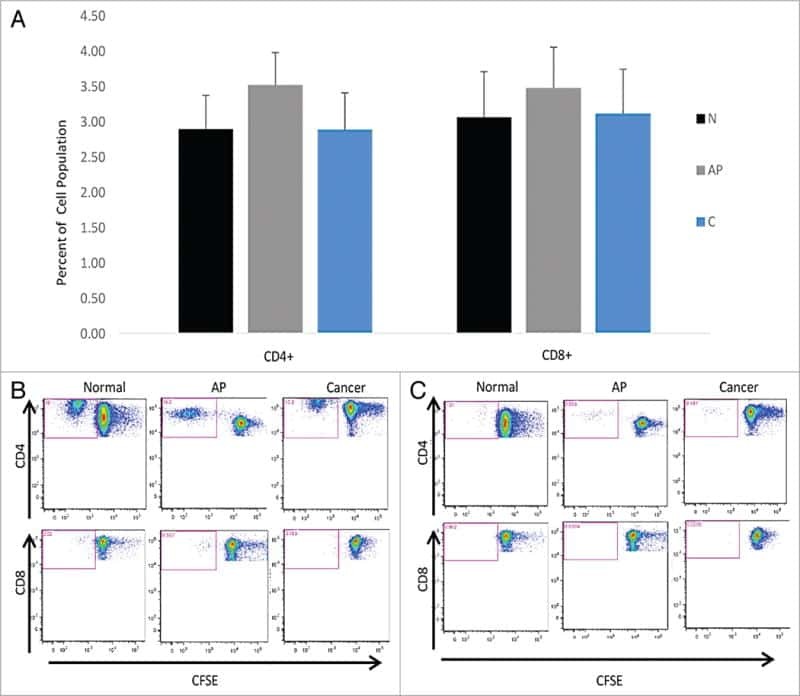
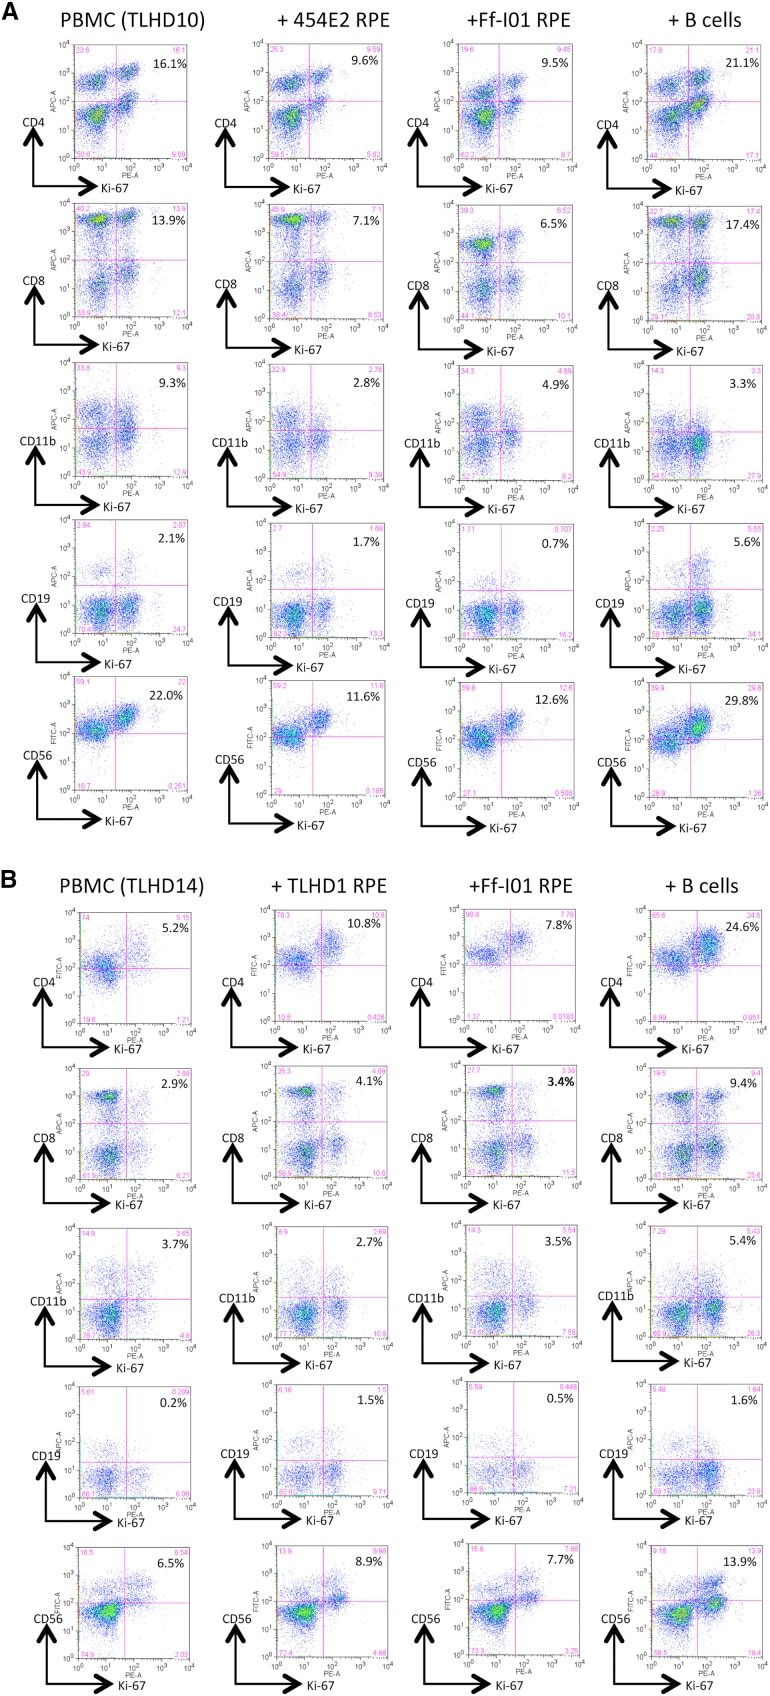
- Figure 3 Another PBMC-RPE MLR Assay with Allogeneic iPS-RPE Cells by Ki-67 Proliferation To evaluate the PBMC-RPE MLR assay with allogeneic HLA homozygote iPS-RPE cells (454E2, 453F2, and Ff-I01) and B cells as positive control cells, we used Ki-67 proliferation by FACS analysis using antibodies against CD4 + cells (helper T cells), CD8 + cells (cytotoxic T cells), CD11b + cells (macrophages/monocytes), CD19 + cells (B cells), and CD56 + (NK cells). (A) TLHD10 PBMCs versus both 454E2 and Ff-I01 iPS-RPE cells = HLA-A, -B, -DRB1 matched. (B) TLHD14 PBMCs versus TLHD1 iPS-RPE cells = HLA-A, -B, -DRB1 mismatched, and Ff-I01 iPS-RPE cells = HLA-A matched, and HLA-B and -DRB1 mismatched. Figure 3
- Conjugate
- Yellow dye
- Submitted by
- Invitrogen Antibodies (provider)
- Main image
- Experimental details
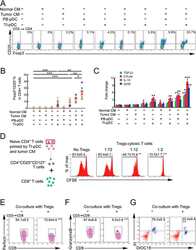
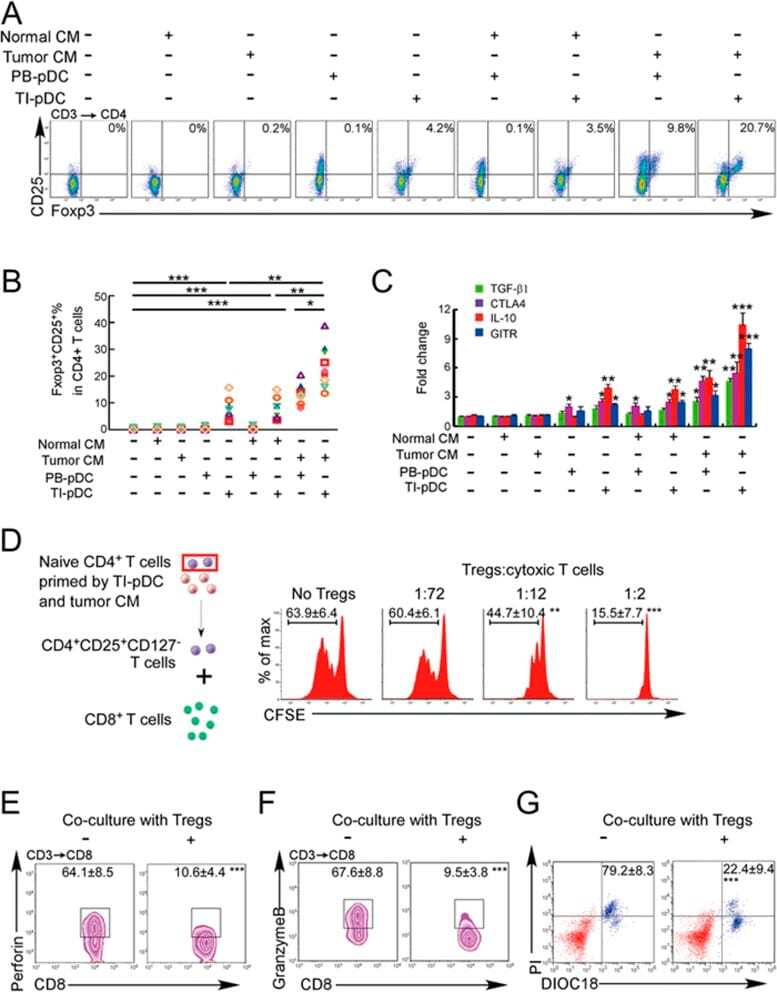
- Figure 3 Naive CD4 + T cells are converted to functional Tregs by tumor-infiltrating DCs and tumor conditioned medium (CM). (A-C) Naive CD4 + T cells from peripheral blood of patients with invasive breast carcinoma were co-cultured with or without autologous pDCs isolated from tumor (TI) or peripheral blood (PB) for 9 days in the presence or absence of 30% CM from autologous tumor slices or adjacent normal tissue slices. (A , B) Non-adherent cells from co-cultures were stained for CD3, CD4, CD25 and intracellular Foxp3, and analyzed by flow cytometry. Representative plots of gated CD3 + CD4 + cells (A) and quantification of percentage of Foxp3 + CD25 + cells among CD3 + CD4 + cells (B) are shown (mean +- SEM, n = 19; * P < 0.05, ** P < 0.01, *** P < 0.001 by Student's t -test). (C) Expression of Treg-associated genes, assessed by qRT-PCR normalized to GAPDH , in sorted CD4 + T cells, relative to expression in cultures without DCs or CM (mean +- SEM, n = 19; * P < 0.05, ** P < 0.01, *** P < 0.001 compared with naive CD4 + T cells cultured alone by Student's t -test). (D-G) Effect of naive CD4 + T cell-derived Tregs, obtained by co-culture with TI pDCs and tumor CM as above, on function of autologous tumor-specific CD8 + T cells. Tumor-specific CD8 + T cells were generated for each subject by stimulating autologous PB CD8 + T cells with autologous tumor lysate-pulsed autologous DCs. Tregs were recovered from co-cultures by magnetic sorting. (D) CFSE-labeled CD8 + T ce
- Conjugate
- Yellow dye
- Submitted by
- Invitrogen Antibodies (provider)
- Main image
- Experimental details
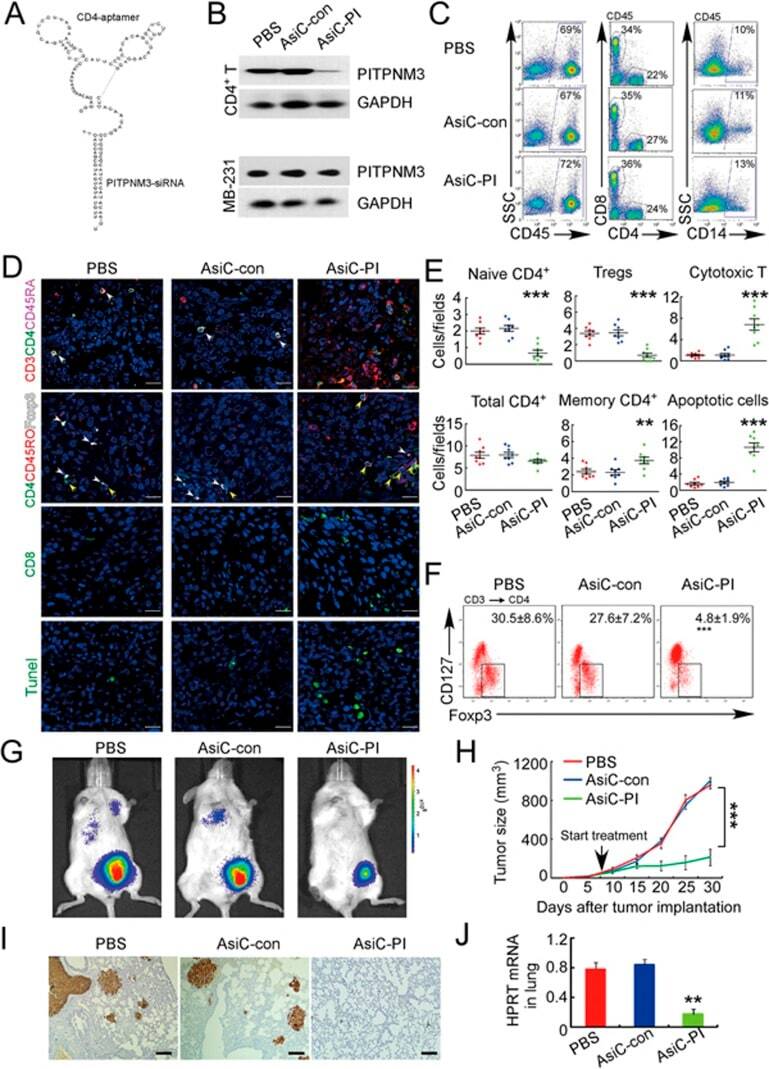
- Figure 6 In vivo knockdown of PITPNM3 in CD4 + T cells reverses immunosuppression and inhibits tumor progression in humanized mice. (A) Humanized mice bearing palpable MDA-MB-231 orthotopic xenografts were intraperitoneally injected daily for 14 days with PBS, 1 nmol CD4-aptamer-control siRNA (AsiC-con) or CD4-aptamer-siRNA targeting PITPNM3 (sequence in A , AsiC-PI) to assess the role of PITPNM3 in TI Tregs, and other T cells and tumor control. Experimental schematic is provided in Supplementary information, Figure S9A . (B) Representative immunoblots showing selective knockdown of PITPNM3 protein in PB CD4 + T cells, but not tumor xenografts ( n = 3). (C) PITPNM3 knockdown did not affect the distribution of human CD45 + hematopoietic cells, CD4 + and CD8 + T cells, and CD14 + monocytes in the peripheral blood of humanized mice. Representative flow plots are shown ( n = 3). (D , E) Effect of PITPNM3 knockdown on TI naive CD4 + , Tregs and CD8 + T cell numbers, and apoptosis by TUNEL assay in xenografts. D shows representative immunofluorescence microscopy images. Top row indicates CD4 + naive T cells by arrows; the second row indicates CD4 + CD45RO + Foxp3 - CD4 + memory T cells (yellow arrows) and Foxp3 + Tregs (white arrows). Scale bar, 50 mum. E shows number of cells of each subtype/high power field in eight mice ( ** P < 0.01, *** P < 0.001 compared to PBS group by Student's t -test). (F) Flow cytometry analysis of gated human CD3 + CD4 + cells isolated from xenogra
- Conjugate
- Yellow dye
- Submitted by
- Invitrogen Antibodies (provider)
- Main image
- Experimental details
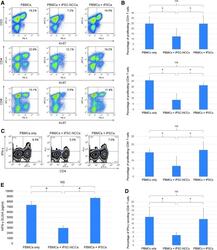
- FIG. 4. Capacity of iPSC-NCCs to suppress activation of T cells. (A) PBMCs (a healthy donor) in the presence of anti-CD3 and anti-CD28 antibodies were cocultured with iPSC-NCCs for 3 days. After 3 days, the PBMCs exposed to iPSC-NCCs were harvested for Ki-67 FACS analysis. Numbers in the FACS dot plots indicate double-positive cells (eg, CD3-Ki-67). These data are representative of three experiments. (B) Percentages of the proliferating T cells ( double-positive cells in A) were also examined. Data are the mean +- SD of three experiments. * P < 0.05, compared to the two groups. NS, not significant. (C) FACS density plots represent the expression of IFN-gamma on CD4 + T cells in the presence of iPSC-NCCs or control iPSCs. PBMCs were stained with anti-CD4 and anti-IFN-gamma. Numbers in the density plots indicate the percentage of cells double positive for CD4/IFN-gamma. These data are representative of three experiments. (D) Percentages of the IFN-gamma secreting CD4 + T cells ( double-positive cells in C) were also examined. Data are the mean +- SD of 3 experiments. * P < 0.05, compared to the two groups. NS, not significant. (E) Concentrations of IFN-gamma in supernatant (MLR plus iPSC-NCCs) were examined by human IFN-gamma ELISA. We also collected control samples: MLR without iPSC-NCCs and MLR plus iPSCs. Data are the mean +- SD of three ELISA determinations. * P < 0.01, compared to the two groups. NS, not significant.
- Conjugate
- Yellow dye
- Submitted by
- Invitrogen Antibodies (provider)
- Main image
- Experimental details
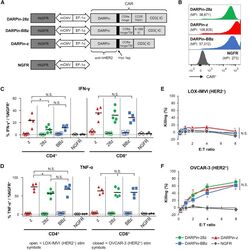
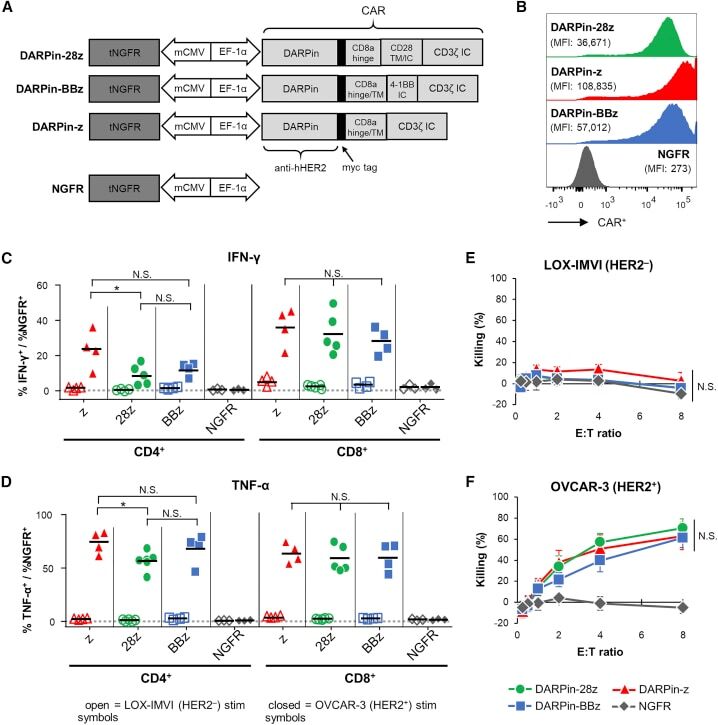
- Figure 1 Anti-HER2 DARPin-Targeted CAR-T Cells Demonstrated Similarl Efficacy In Vitro (A) Schematics of the dual-promoter lentiviral (LV) gene cassettes used to generate anti-HER2 DARPin-targeted first- or second-generation CAR-T cells (structural details are as indicated; TM, transmembrane; IC, intracellular) or CAR-negative control NGFR-T cells. In all cases, truncated NGFR (tNGFR) is included as a transduction marker. (B) Expression of CARs on the surface of engineered (NGFR + ) T cells as determined by flow cytometry (upstream gating strategy: lymphocytes - singlets - NGFR + ). Mean fluorescence intensity (MFI) for CAR expression is indicated in brackets. Representative results have been replicated in 2-4 additional independent experiments. (C and D) Production of IFN-gamma (C) and TNF-alpha (D) upon CAR-T cell stimulation with HER2 + (OVCAR-3; closed symbols) or HER2 - (LOX-IMVI; open symbols) human tumor cell lines was measured by intracellular cytokine staining (ICS) and subsequent flow cytometry (upstream gating strategy: lymphocytes - singlets - CD4 + or CD8 + T cells). Percent cytokine production was normalized for transduction (transduction ranges observed: DARPin-28z, 39%-60%; DARPin-BBz, 33%-52%; DARPin-z, 25%-63%; NGFR, 63%-86%). Each point indicates data from a single independent experiment (n = 3-5 per LV construct); black lines indicate mean values. (E and F) Cytotoxicity across various effector:target (E:T) ratios with LOX-IMVI (E) or OVCAR-3 (F) tumor cell
- Conjugate
- Yellow dye
- Submitted by
- Invitrogen Antibodies (provider)
- Main image
- Experimental details
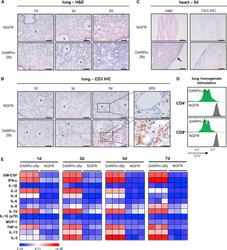
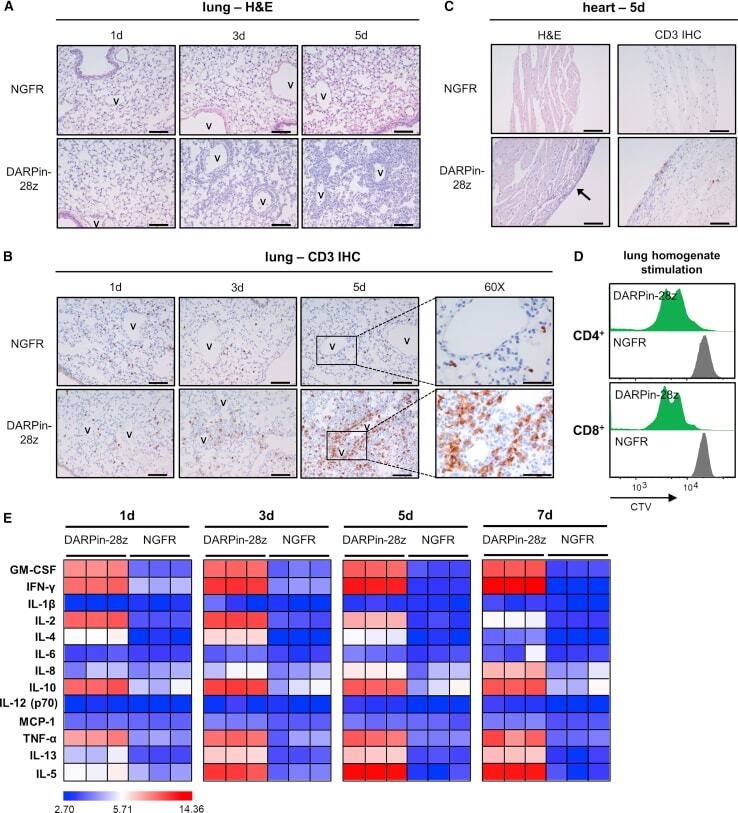
- Figure 3 DAPRin-28z-T Cells Activated in the Lungs and Heart, Resulting in a Systemic Cytokine Storm OVCAR-3 tumor-bearing NRG mice were treated with 6 x 10 6 effective DARPin-28z-T cells or a matched number of NGFR-T cells. (A-C) Mice were sacrificed at 1, 3, or 5 days post-ACT1 for total body perfusion, fixation, necropsy, and histological analysis. (A) Hematoxylin and eosin (H&E) staining of the lungs at 20x magnification (scale bars, 100 mum). V, vasculature. (B) Immunohistochemistry (IHC) for human CD3 in the lungs at 20x magnification (scale bars, 100 mum) or 60x magnification (zoom-in; scale bars, 50 mum). (C) H&E or CD3 IHC staining of the heart at 20x magnification (scale bars, 100 mum); arrow indicates aberrant region of inflammation along the right heart wall. Representative images from n = 2-3 mice are shown. Findings have been recapitulated in 1-2 additional independent experiments. (D) DARPin-28z- or NGFR-T cells were co-cultured with tumor-free NRG mouse lung homogenates ex vivo . T cell proliferation was measured by flow cytometry using CellTrace Violet (CTV) dye. Data are representative of two independent experiments. (E) Mice were bled at 1, 3, 5, or 7 days post-ACT1 for multiplex analysis of human serum cytokine content; a globally normalized heatmap of log2-transformed human cytokine fluorescence readings is shown. Each square represents data from one mouse. Colorimetric scale bar indicates minimum, average, and maximum values on map. Absolute values are d
- Conjugate
- Yellow dye
- Submitted by
- Invitrogen Antibodies (provider)
- Main image
- Experimental details
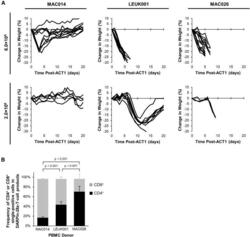
- Figure 4 Differential In Vivo Toxicity of DARPin-28z-T Cells Manufactured from Unique PBMC Donors Correlated with the Frequency of CD4+ T Cells in the Adoptive Transfer Product (A) OVCAR-3 tumor-bearing NRG mice were treated with 6.0 x 10 6 or 1.7-2.0 x 10 6 DARPin-28z-T cells produced from MAC026, LEUK001, or MAC014 PBMCs. Mice were monitored over time for changes in weight. Data were pooled from n = x independent experiments. For 6.0 x 10 6 cells, MAC014, 2; LEUK001, 3; and MAC026, 4. For 2.0 x 10 6 cells, MAC014, 1; LEUK001, 2; and MAC026, 1. Each line indicates data from one animal; curves end, indicating when mice succumbed to toxicity. (B) Composition of CD4 + or CD8 + cells in DARPin-28z-T cell products (days 13-14 post-activation) manufactured using starting PBMCs from donors as indicated and determined using flow cytometry (upstream gating strategy: lymphocytes - singlets - NGFR + ). Error bars represent SD. Data from n = x independent experiments; MAC014, 5 (2 unique PBMC preparations); LEUK001, 6 (1 PBMC preparation); and MAC026, 12 (5 unique PBMC preparations).
- Conjugate
- Yellow dye
