Explore
 Validate
 Learn
 Flow cytometry
Antibody data
- Antibody Data
- Antigen structure
- References [0]
- Comments [0]
- Validations
- Flow cytometry [2]
- Other assay [14]
Submit
Validation data
Reference
Comment
Report error
- Product number
- 47-0086-42 - Provider product page

- Provider
- Invitrogen Antibodies
- Product name
- CD8a Monoclonal Antibody (OKT8 (OKT-8)), APC-eFluor™ 780, eBioscience™
- Antibody type
- Monoclonal
- Antigen
- Other
- Description
- Description: The OKT8 monoclonal antibody reacts with the human CD8a molecule, an approximately 32-34 kDa cell surface receptor expressed either as a heterodimer with the CD8 beta chain (CD8 alpha beta) or as a homodimer (CD8 alpha alpha). A majority of thymocytes and a subpopulation of mature T cells and NK cells express CD8a. CD8 binds to MHC class I and through its association with protein tyrosine kinase p56lck plays a role in T-cell development and activation of mature T cells. Preliminary testing indicates that OKT8 and two other mouse anti-human CD8 antibodies (clone RPA-T8, Product # 14-0088 and clone HIT8a, Product # 14-0089) do not compete with each other for binding to human peripheral blood leukocytes by flow cytometric analysis, suggesting that they do not bind to similar epitopes or block each other by steric hindrance. Applications Reported: This OKT8 (OKT-8) antibody has been reported for use in flow cytometric analysis. Applications Tested: This OKT8 (OKT-8) antibody has been pre-titrated and tested by flow cytometric analysis of normal human peripheral blood cells. This can be used at 5 µL (0.25 µg) per test. A test is defined as the amount (µg) of antibody that will stain a cell sample in a final volume of 100 µL. Cell number should be determined empirically but can range from 10^5 to 10^8 cells/test. APC-eFluor® 780 emits at 780 nm and is excited with the Red laser (633 nm). Please make sure that your instrument is capable of detecting this fluorochome. Light sensitivity: This tandem dye is sensitive to photo-induced oxidation. Please protect this vial and stained samples from light. Fixation: Samples can be stored in IC Fixation Buffer (Product # 00-8222) (100 µL of cell sample + 100 µL of IC Fixation Buffer) or 1-step Fix/Lyse Solution (Product # 00-5333) for up to 3 days in the dark at 4°C with minimal impact on brightness and FRET efficiency/compensation. Some generalizations regarding fluorophore performance after fixation can be made, but clone specific performance should be determined empirically. Excitation: 633-647 nm; Emission: 780 nm; Laser: Red Laser. Filtration: 0.2 µm post-manufacturing filtered.
- Reactivity
- Human
- Host
- Mouse
- Isotype
- IgG
- Antibody clone number
- OKT8 (OKT-8)
- Vial size
- 100 Tests
- Concentration
- 5 μL/Test
- Storage
- 4°C, store in dark, DO NOT FREEZE!
No comments: Submit comment
Supportive validation
- Submitted by
- Invitrogen Antibodies (provider)
- Main image
- Experimental details
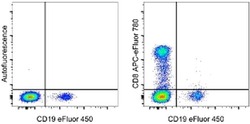
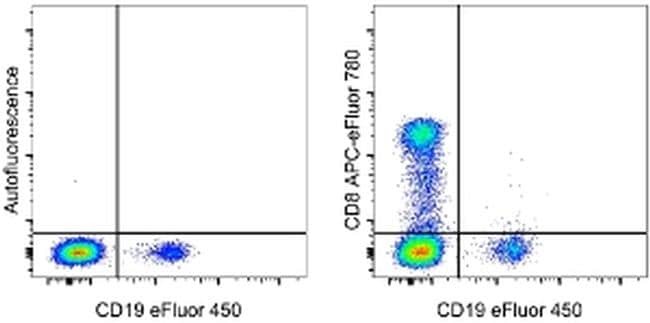
- Staining of normal human peripheral blood cells with Anti-Human CD19 eFluor® 450 (Product # 48-0198-42) and staining buffer (autofluorescence) (left) or Anti-Human CD8a APC-eFluor® 780 (right). Cells in the lymphocyte gate were used for analysis.
- Submitted by
- Invitrogen Antibodies (provider)
- Main image
- Experimental details
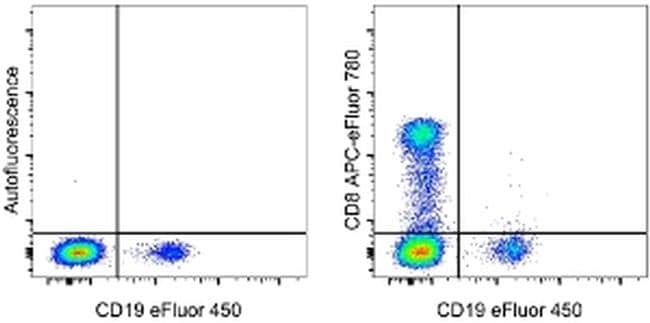
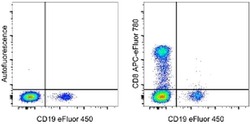
- Staining of normal human peripheral blood cells with Anti-Human CD19 eFluor® 450 (Product # 48-0198-42) and staining buffer (autofluorescence) (left) or Anti-Human CD8a APC-eFluor® 780 (right). Cells in the lymphocyte gate were used for analysis.
Supportive validation
- Submitted by
- Invitrogen Antibodies (provider)
- Main image
- Experimental details
- NULL
- Submitted by
- Invitrogen Antibodies (provider)
- Main image
- Experimental details
- NULL
- Submitted by
- Invitrogen Antibodies (provider)
- Main image
- Experimental details
- NULL
- Submitted by
- Invitrogen Antibodies (provider)
- Main image

- Experimental details
- NULL

- Submitted by
- Invitrogen Antibodies (provider)
- Main image
- Experimental details
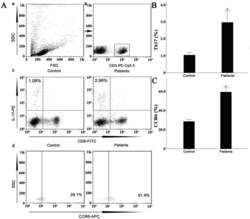
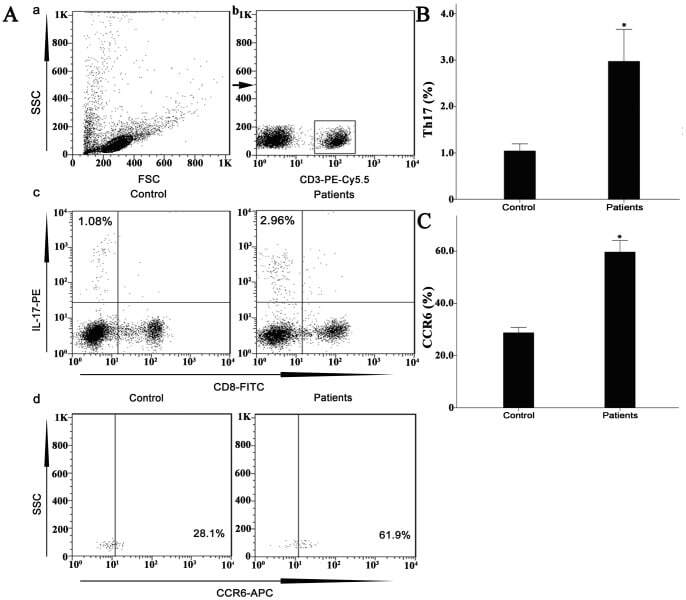
- Figure 7 Circulating percentages of Th17 cells and CCR6-positive cells in peripheral blood are increased in IVD degenerated patients when compared with controls. Heparinized peripheral whole blood cells from 20 patients and 15 healthy controls were stimulated with phorbol myristate acetate (PMA), ionomycin, and monensin for 4 h and subsequently stained with fluorochrome-labeled antibodies as described in Materials and Methods. A(a) Lymphocytes were gated by flow cytometry. A(b) CD3 + T subsets were gated by flow cytometry; the plots in the inset box represent the CD3 + T cells. A(c) Representative IL-17 expression levels in the CD3 + CD8 - T subsets (CD4 + T subsets) from each group are shown. The percentages of positive cells are shown in the upper left panels. A(d) Representative surface CCR6 expression levels on the CD3 + CD8 - IL-17 + subsets from each group are shown. The percentages of positive cells are shown in the right panel. (B) The percentage of circulating Th17 cells was significantly higher in IVD degenerated patients (2.973+-0.689%) than in the control group (1.039+-0.156%; *, p
- Submitted by
- Invitrogen Antibodies (provider)
- Main image
- Experimental details
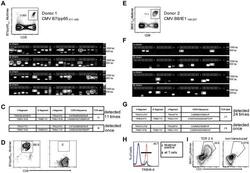
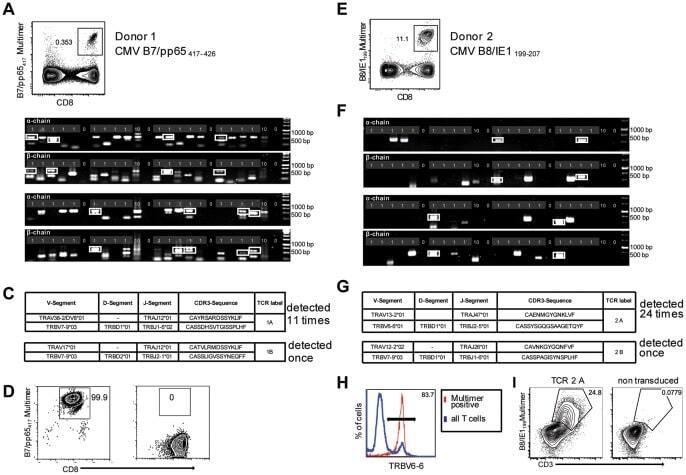
- Figure 2 Single-cell PCR delivers sequences of functional CMV-specific TCRs. (A) PBMCs from Donor 1 were recovered and stained with HLA-B7/pp65 417-426 multimers. Dot plot shows the further analyzed CD8 and MHC multimer double-positive cell population. Cells were pre-gated on live lymphocytes (propidium iodide-negative, and CD3-positive). (B) TCR SCAN as described in Figure 1 and agarose gel electrophoresis of the resulting PCR products was performed. The photography shows the agarose gel. Upper row shows alpha-chain products matched with the respective beta-chains in the lower row. White boxes indicate alpha- and matched beta-chain-products derived from identical single cell samples. (C) The table summarizes the V- D- J- segment type and amino acid sequences of TCRs identified from CMV-multimer positive T cells in Figure 2A . TCR1A was identified 11 times and TCR 1B was detected once. (D) MHC multimer-positive T cells from the same donor were in vitro expanded and six T cell clones were successfully maintained. All clones contained TCR1A as confirmed by PCR and sequencing. The left FACS plot shows HLA-B7/pp65 417-426 staining and the right FACS plot shows staining with an irrelevant MHC multimer. (E) PBMCs from donor 2 were recovered and stained with HLA-B8/IE-1 199-207 multimers. The dot plot shows the further analyzed CD8 and MHC multimer double-positive cell population. Cells were pre-gated on living lymphocytes (propidium iodide negative and CD3 positive). (F) TCR SCAN a
- Submitted by
- Invitrogen Antibodies (provider)
- Main image
- Experimental details
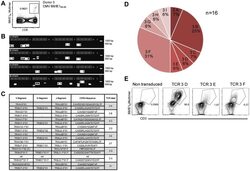
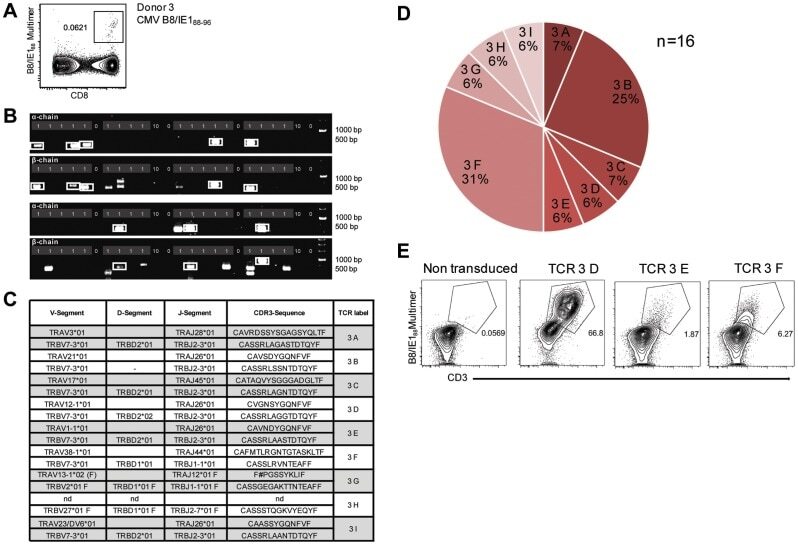
- Figure 3 Characterization of a small diverse T cell repertoire and transgenic expression of detected TCRs. (A) PBMCs from donor 3 were stained with HLA-B8/IE-1 88-96 multimers. Dot plot shows the further analyzed CD8 and MHC multimer double-positive cell population. Cells were pre-gated on living lymphocytes (propidium iodide-negative and CD3-positive). (B) A PCR slide with single antigen-specific T cells from Figure 3A were FACS-isolated. TCR SCAN as described in Figure 1 and agarose gel electrophoresis of the resulting PCR products was performed. Upper row shows alpha-chain products matched with the respective beta-chains in the lower row. White boxes indicate samples alpha- and matched beta-chain-products derived from identical single cell samples. (C) The table summarizes the V- D- J- segment type and amino acid sequences of TCRs identified from CMV-multimer positive T cells in Figure 3A . In three independent experiments we identified nine different TCRs (TCR 3A-I) (D) Pie chart indicates the prevalence of identified TCRs from donor 3. Percentages represent incidence of respective TCR divided by total number of positive samples. (E) Sequences from TCR 3D, 3E and 3G were expressed in Jurkat76 T cells by retroviral gene transfer. Non-transduced (left FACS plot) and transduced Jurkat76 T cells were analyzed for expression of CD3 and MHC multimer binding.
- Submitted by
- Invitrogen Antibodies (provider)
- Main image
- Experimental details
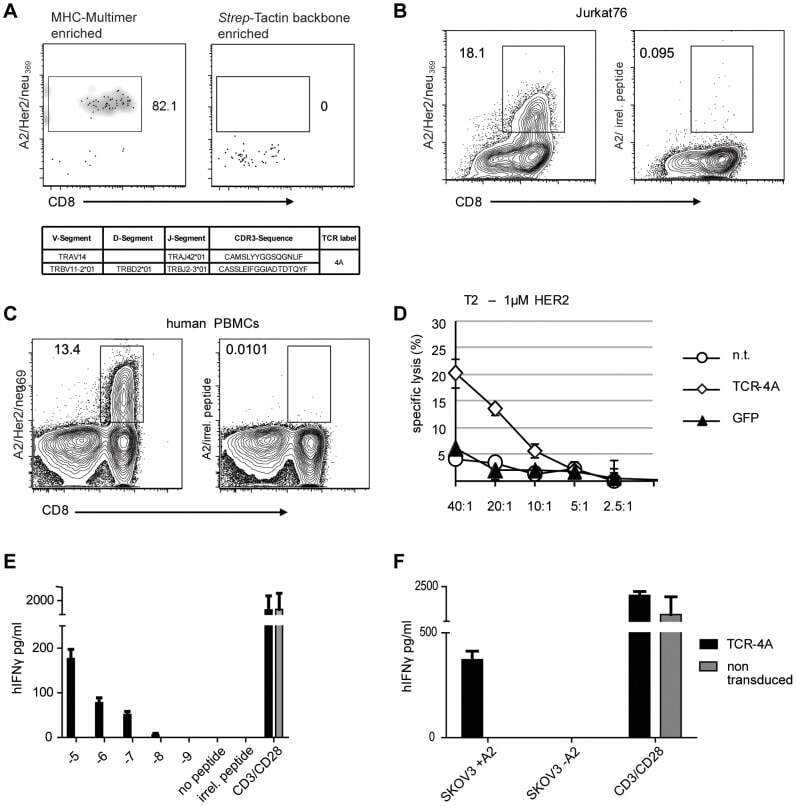
- Figure 4 Characterization of functionality of a TCR isolated from rare antigen specific T cells. (A) Cells double-positive for HLA-A2/Her2neu 369-377 PE- and BV421-conjugated multimers were FACS sorted. The left FACS plot shows CD8 and MHC multimer staining of the cell fraction enriched with Her2/neu specific MHC-multimer. The right FACS plot serves as a negative control that was stained in the same way, but for MACS enrichment only Strep-Tactin backbone was used. Ten single-cell samples were prepared and processed for TCR sequencing. Full-length variable domain sequences of alpha- and beta-chain full-length variable domain sequences from one specific TCR was identified and is shown in the table. (B) Sequence from TCR 4A was expressed in Jurkat76 T cells by retroviral gene transfer. Left FACS plot shows A2/Her2/neu 369-377 staining and right FACS plot shows staining with an irrelevant MHC multimer. (C) Sequence from TCR 4A was expressed in human PBMCs by retroviral gene transfer. Left FACS plot shows A2/Her2/neu 369-377 staining and right FACS plot shows staining with an irrelevant MHC multimer. (D) For functional testing 2x10 3 peptide-loaded T2 cells (1 uM) labeled with 51 Cr were incubated for 4 h with TCR-4A modified PBLs at different effector/target ratios (E/T ratios). After 4 h free 51 chrome was quantified in the supernatant. TCR-specificity was controlled by co-incubation with GFP-transduced and non transduced (n.t.) PBMCs. All conditions were tested in duplicates. (
- Submitted by
- Invitrogen Antibodies (provider)
- Main image
- Experimental details
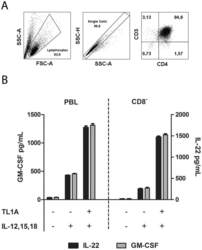
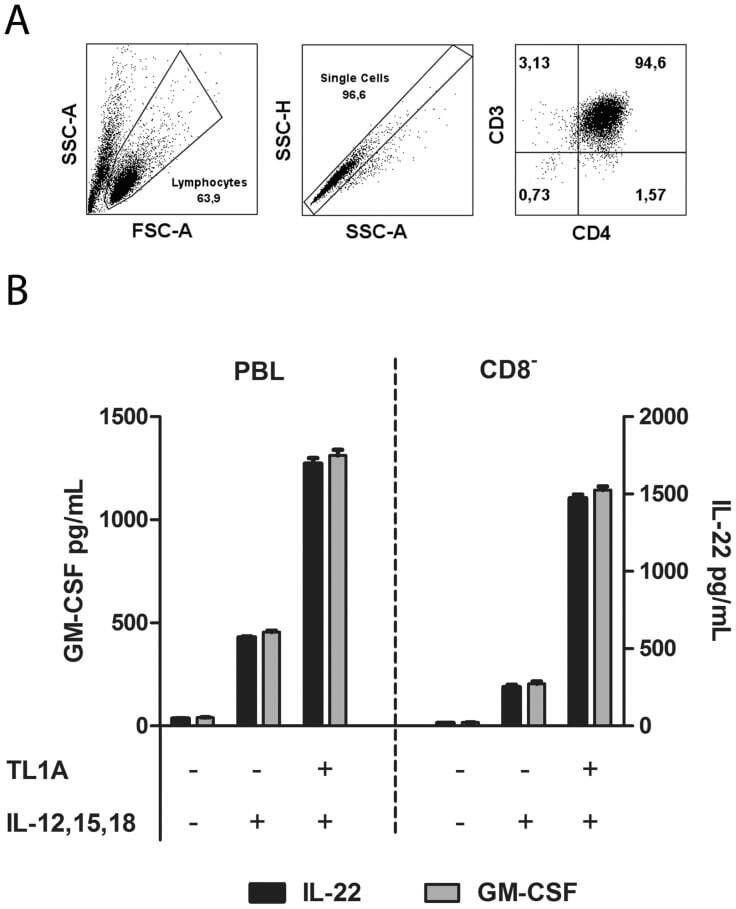
- Figure 6 IL-22 and GM-CSF is produced by CD8 - T-cells. Purified PBLs were stimulated for 12 days with CD3/CD28 beads. After 12 days, beads were removed and the cells set up as PBLs or CD8 depleted PBLs in new media. A. Left panel: Gating strategy for lymphocytes. Middle panel: Single cells. Right panel: Verification of CD8 depletion by staining for CD4/CD3 (~95% were CD3 + CD4 + ). B. IL-22 and GM-CSF production by PBLs and CD8 depleted cells from A. Supernatant was collected seven days after stimulation and cytokines measured by ELISA as described in Materials and Methods. Cytokines/inhibitors were added in the following concentrations IL-12: 4 ng/mL, IL-15: 10 ng/mL, IL-18: 40 ng/mL, TL1A: 100 ng/mL. Mean +/- SEM on two measurements is shown. Data are representative of results obtained with cells from two different donors.
- Submitted by
- Invitrogen Antibodies (provider)
- Main image
- Experimental details
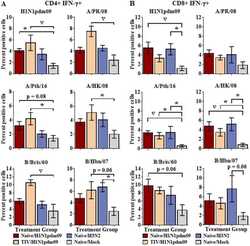
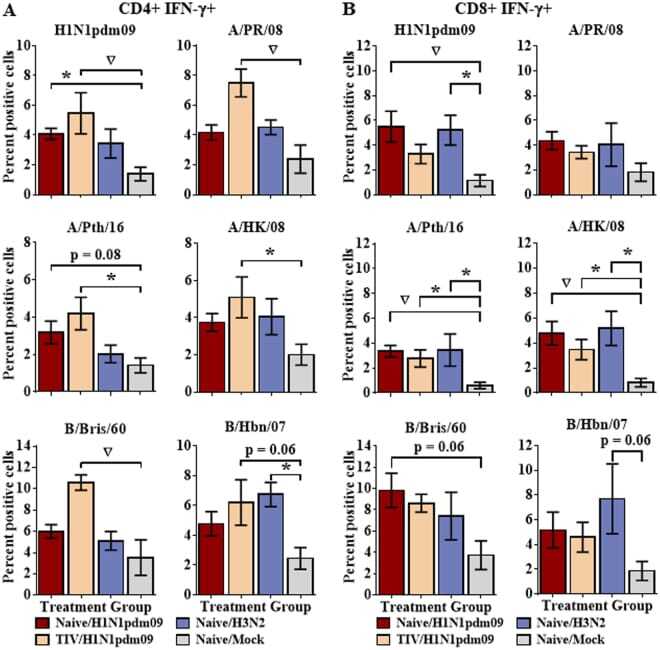
- Figure 1 Extensive T cell cross-reactivity between a diverse selection of influenza strains. Naive ferrets were infected intranasally with H1N1pdm09 strain, A/NY/21/2009 (Naive/H1N1pdm09, n = 8), the seasonal H3N2 strain, A/Perth/16/2009 (Naive/H3N2, n = 4), or were mock infected (Naive/Mock, n = 8). An additional group of ferrets was vaccinated with a commercially available 2011-2012 trivalent inactivated influenza vaccine prior to challenge with A/NY/21/2009 (TIV/H1N1pdm09, n = 8). Splenocytes were collected from ferrets 14d post-infection and stimulated with a diverse array of contemporary and historical influenza strains from each of the currently circulating influenza subtypes. IFN-gamma production was assessed by flow cytometry for CD4+ ( A ) and CD8+ ( B ) T cell populations. Significance from the mock infected group is indicated by *p < 0.05, p < 0.01. Error bars represent SEM.
- Submitted by
- Invitrogen Antibodies (provider)
- Main image
- Experimental details
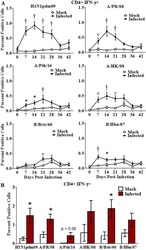
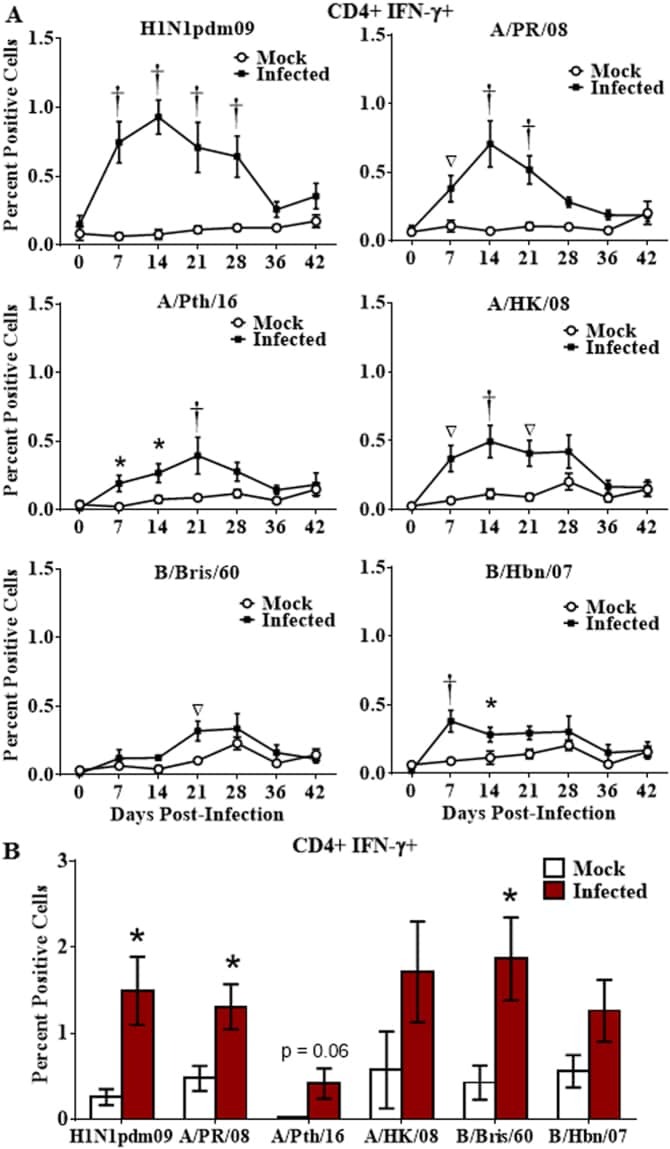
- Figure 2 Longevity of the cross-reactive CD4 T cell response. Naive ferrets were infected intranasally with H1N1pdm09 strain, A/NY/21/2009 (H1N1pdm09, n = 7), or were mock infected (Mock; n = 6). Peripheral blood leukocytes were purified weekly for 6 weeks, and T cell responses assessed by stimulation with a panel of live influenza strains ( A ). Splenocytes were collected 6 weeks post-infection and stimulated with the panel of live influenza strains ( B ). Responding CD4 T cells were assessed for IFN-gamma production by flow cytometry. Significance from the mock infected group is indicated by *p < 0.05, p < 0.01, + p < 0.001. Error bars represent SEM.
- Submitted by
- Invitrogen Antibodies (provider)
- Main image
- Experimental details
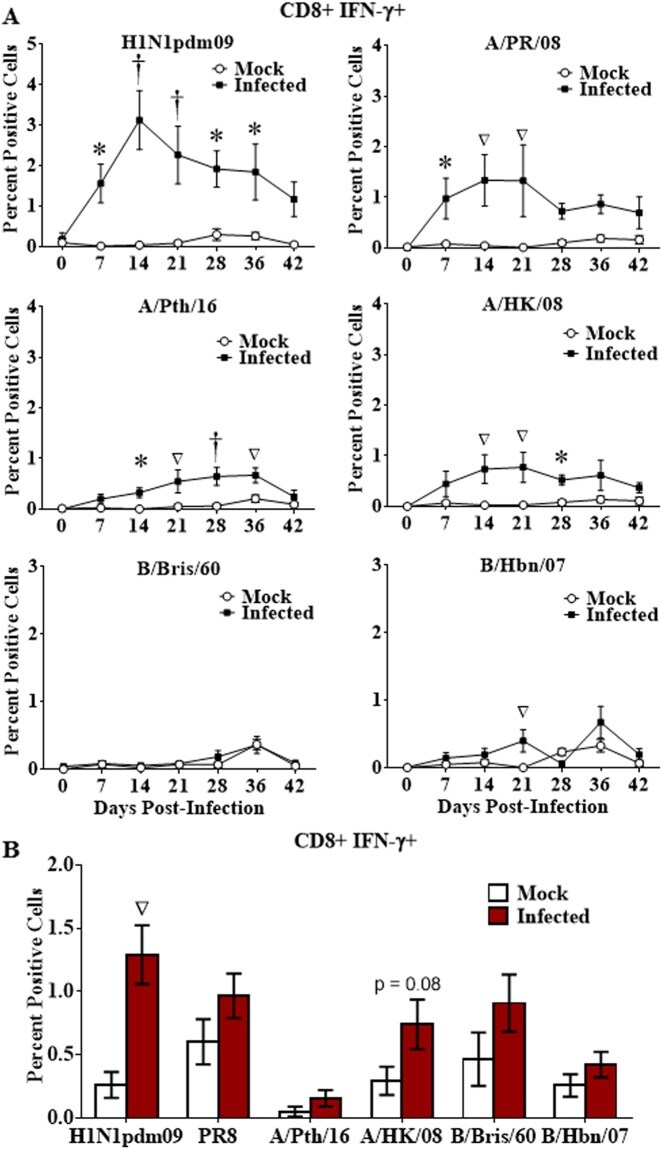
- Figure 3 Longevity of the cross-reactive CD8 T cell response. Naive ferrets were infected intranasally with H1N1pdm09 (H1N1pdm09, n = 7), or mock infected (Mock; n = 6). Peripheral blood leukocytes were purified weekly for 6 weeks, and CD8 T cell responses assessed by stimulation with live virus consisting of a panel of contemporary and historical influenza strains ( A ). Splenocytes were collected 6 weeks post-infection and stimulated with the panel of influenza strains ( B ). Responding CD8 + IFN-gamma + T cells were assessed by flow cytometry. Significance from the mock infected group is indicated by *p < 0.05, p < 0.01, + p < 0.001. Error bars represent SEM.
- Submitted by
- Invitrogen Antibodies (provider)
- Main image

- Experimental details
- FIGURE 5 Effects of disruption of PD-1 on cytotoxicity, cytokines production, and phenotype of GPC3-CAR T cells in vitro . (A) Cytotoxic activities of UTD and GPC3-CAR T cells with intact or deficient PD-1 against GPC3-positive (PLC/PRF/5 and SK-HEP-1/GPC3) and GPC3-negative (SK-HEP-1) HCC cells at an effector:target ratio of 1:1. (B,C) The production of IL-2 (B) and IFN-gamma (C) by the UTD and GPC3-CAR T cells with intact or deficient PD-1 cocultured with GPC3-positive (PLC/PRF/5 and SK-HEP-1/GPC3) or GPC3-negative (SK-HEP-1) HCC cells at an effector:target ratio of 1:1. (D) CD4 and CD8 subsets constitution of wild-type and PD-1-deficient GPC3-CAR T cells. The expressions of CD4 and CD8 on CAR T cells were measured by flow cytometry. (E) The expressions of early (CD69), and intermediate or late (CD25) activation markers on cell surface of wild-type and PD-1-deficient GPC3-CAR T cells. The expressions of CD25 and CD69 were determined by flow cytometry. Data shown were mean +- SD from triplicates. Bars, SD. * P < 0.05, ** P < 0.01, and *** P < 0.001 by one way ANOVA with Turkey post hoc test.

- Submitted by
- Invitrogen Antibodies (provider)
- Main image
- Experimental details
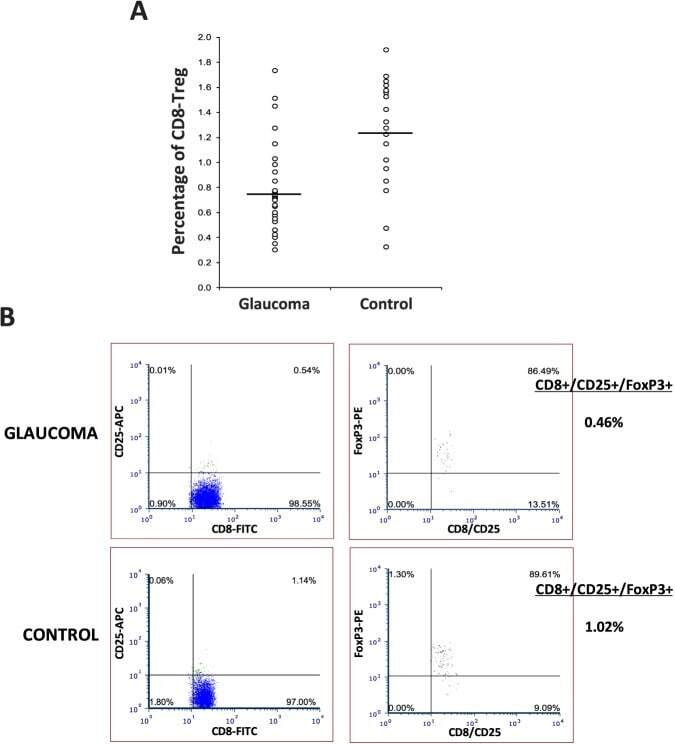
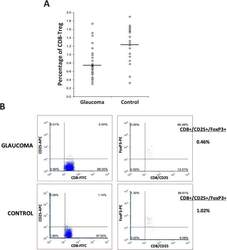
- Figure 3 T-lymphocyte subset distribution in glaucoma. Mononuclear cells isolated from peripheral blood samples from glaucoma (n = 32) and control (n = 21) groups were analyzed by multicolor flow cytometry for T-cell subset markers. (A) Similar to CD4+ Tregs, the percentage of CD8+/CD25+/FoxP3+ Tregs (CD8-Tregs) was also significantly lower in glaucomatous samples than nonglaucomatous controls (ANOVA, P < 0.001). (B) Shown are representative flow cytometry images after CD8/CD25/FoxP3 immunostaining for Tregs.