 Explore
 Validate
 Learn
Learn Immunohistochemistry
Antibody data
- Antibody Data
- Antigen structure
- References [0]
- Comments [0]
- Validations
- Immunohistochemistry [1]
- Flow cytometry [2]
- Other assay [11]
Submit
Validation data
Reference
Comment
Report error
- Product number
- MA5-14548 - Provider product page

- Provider
- Invitrogen Antibodies
- Product name
- CD8 Monoclonal Antibody (SP16)
- Antibody type
- Monoclonal
- Antigen
- Synthetic peptide
- Description
- MA5-14548 targets CD8 in IHC (P), and FACS applications and shows reactivity with Human samples. The MA5-14548 immunogen is synthetic peptide sequence comprising the 13 C-terminal amino acids of the cytoplasmic domain of alpha chain of the CD8 molecule.
- Reactivity
- Human
- Host
- Rabbit
- Isotype
- IgG
- Antibody clone number
- SP16
- Vial size
- 500 µL
- Concentration
- 0.022 mg/mL
- Storage
- -20° C, Avoid Freeze/Thaw Cycles
No comments: Submit comment
Supportive validation
- Submitted by
- Invitrogen Antibodies (provider)
- Main image

- Experimental details
- Formalin-fixed, paraffin-embedded human tonsil stained with CD8 and AEC chromogen.

Supportive validation
- Submitted by
- Invitrogen Antibodies (provider)
- Main image
- Experimental details
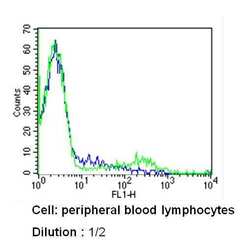
- Flow cytometry analysis of CD8 in PBMC cells (green) compared to an isotype control (blue). Human blood was collected, combined with a hydrophilic polysaccharide, centrifuged, transferred to a conical tube and washed with PBS. 50 µL of cell solution was added to each tube at a dilution of 2x10^7 cells/mL, followed by the addition of 50 µL of isotype control and primary antibody (Product # MA5-14548) at a dilution of 1:2. Cells were incubated for 30 min at 4ºC and washed with a cell buffer, followed by incubation with a DyLight 488-conjugated secondary antibody for 30 min at 4ºC in the dark. FACS analysis was performed using 400 µL of cell buffer.

- Submitted by
- Invitrogen Antibodies (provider)
- Main image

- Experimental details
- Flow cytometry analysis of CD8 in Jurkat cells (green) compared to an isotype control (blue). Cells were harvested, adjusted to a concentration of 1-5x10^6 cells/mL, fixed with 2% paraformaldehyde and washed with PBS. Cells were blocked with a 2% solution of BSA-PBS for 30 min at room temperature and incubated with a CD8 monoclonal antibody (Product # MA5-14548) at a dilution of 1:2 for 60 min at room temperature. Cells were then incubated for 40 min at room temperature in the dark using a Dylight 488-conjugated secondary antibody and re-suspended in PBS for FACS analysis.

Supportive validation
- Submitted by
- Invitrogen Antibodies (provider)
- Main image

- Experimental details
- NULL

- Submitted by
- Invitrogen Antibodies (provider)
- Main image

- Experimental details
- NULL

- Submitted by
- Invitrogen Antibodies (provider)
- Main image

- Experimental details
- NULL

- Submitted by
- Invitrogen Antibodies (provider)
- Main image

- Experimental details
- NULL

- Submitted by
- Invitrogen Antibodies (provider)
- Main image

- Experimental details
- Figure 2 CD4 + and CD8 + T cells accumulate in the CSF in GABA B receptor antibody-associated LE Multiparameter flow cytometry analysis of absolute numbers of CD4 + T cells (A) and CD8 + T cells (C), activated HLADR + CD4 + T cells (B), and HLADR + CD8 + T cells (D) within PB and CSF in 4 patients with GABA B receptor antibody-associated LE and controls. Data are given as whisker plots. Levels of significance are indicated by n.s. (not significant) for all p > 0.05, * for all p < 0.05, and ** for all p < 0.01. For details, refer to the main text and table 1 . GABA B = gamma-aminobutyric acid B; LE = limbic encephalitis; PB = peripheral blood; Pt. = patient.

- Submitted by
- Invitrogen Antibodies (provider)
- Main image

- Experimental details
- Figure 3 A pathogenic role for CD8 + T cells in addition to plasma cell-derived autoantibodies in GABA B receptor antibody-associated limbic encephalitis Histologic specimen of one patient with GABA B receptor antibody-associated limbic encephalitis following selective amygdalohippocampectomy revealed perivascular infiltrates of CD138 + plasma cells (A) and CD3 + T cells (B). CD8 + T cells (C) were predominantly detected within the brain parenchyma in close contact to neurons but not in perivascular regions, suggesting that perivascular CD3 + T cells are mainly CD4 + T cells (scale bar represents 50 mum in A-C; insets show magnification of 2 representative neurons in close contact with CD8 + T cells). Representative confocal triple staining (D) for DAPI, CD8 (red), and granzyme B (green) revealed expression of granzyme B (white arrow) in parenchymal CD8 + T cells (scale bar represents 10 mum in D). DAPI = 4'6-diamidino-2-phenylindole*2HCl; GABA B = gamma-aminobutyric acid B.

- Submitted by
- Invitrogen Antibodies (provider)
- Main image

- Experimental details
- Figure 4 HE and immunohistochemical staining of infiltrating cells in decellularized corneal matrix after 4 weeks of implantation in the WT mice and GTKO mice. Figures of ( A ) HE staining, ( C ) CD68 + , ( E ) CD3 + , ( F ) CD4 + , and ( G ) CD8 + were obtained from WT mice; ( B ) HE staining, ( D ) CD68 + , ( H ) CD3 + , ( I ) CD4 + , and ( J ) CD8 + were images from GTKO mice. The black arrows showed the positive staining cells. DCM: decellularized corneal matrix.

- Submitted by
- Invitrogen Antibodies (provider)
- Main image

- Experimental details
- FIGURE 7 Low-oxygen within 3D-O matrices reduces lymphocyte infiltration. (A) tSNE plot of pre-processed, single, live cells, down-sampled to 10.000 events and concatenated showing major immune clusters (CD3-FITC+, CD4-PE-Cy5+, CD8-APC-Cy7+, CD19-APC+ and CD45-BV510+). (B) Quantification of the number of infiltrated lymphocytes into 3D-O physiological and 3D-O tumorous matrices embedded with either MDA-MB-231 cells or MCF-7 cells by manual gating. Infiltration data shown represents PBMCs obtained from 3 individual healthy subjects and the average of infiltrated CD3+ T cells, CD3+CD8+ T cells, CD3+CD4+ T cells, and CD19+ B cells (data normalized to counting beads x10 3 ), * p < 0.05, data were analyzed using unpaired two-tailed Student''s t -test. (C) Representative confocal microscopy images of rotated and top views of BCa (green) cells and CD8+ (red) cells in 3D-O physiological and 3D-O tumorous matrices on day 7, co-localization is seen in yellow. Scale bar = 200 mum.

- Submitted by
- Invitrogen Antibodies (provider)
- Main image

- Experimental details
- FIGURE 8 Sensitization of BCa cells to cytotoxic CD8+ T cells within 3D-O matrices. (A) CD8+ infiltration into 3D-O physiological and 3D-O tumorous matrices seeded with MDA-MB-231 and MCF-7 cells on day 7 after treatment with PX-478 at 5 muM concentration (i) and Durvalumab at 5 muM concentration (ii) for the first 4 days. (B) Representative IHC results representing CD8+ infiltration into 3D-physiological and 3D-tumorous scaffolds seeded with MDA-MB-231 and MCF-7 cells on day 7 after treatment with PX-478 and Durvalumab, Scale bar = 300 mum. * p < 0.05, (n.s.) not significant, data were analyzed using unpaired two-tailed Student's t -test.

- Submitted by
- Invitrogen Antibodies (provider)
- Main image
- Experimental details
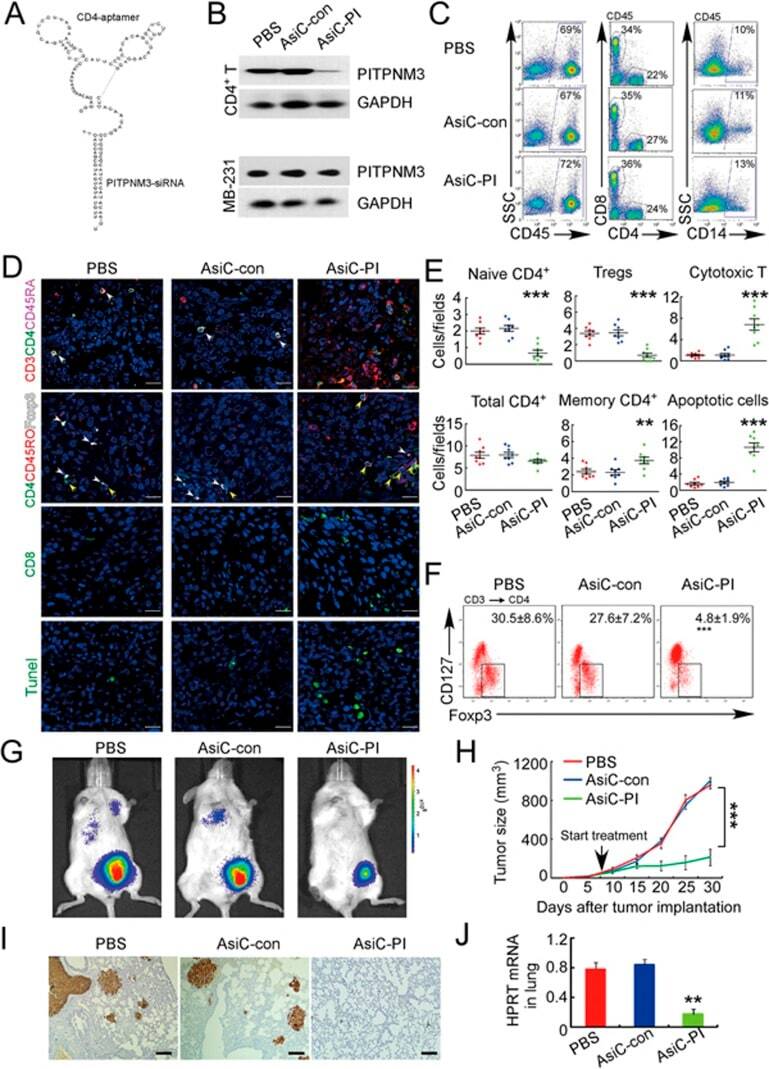
- Figure 6 In vivo knockdown of PITPNM3 in CD4 + T cells reverses immunosuppression and inhibits tumor progression in humanized mice. (A) Humanized mice bearing palpable MDA-MB-231 orthotopic xenografts were intraperitoneally injected daily for 14 days with PBS, 1 nmol CD4-aptamer-control siRNA (AsiC-con) or CD4-aptamer-siRNA targeting PITPNM3 (sequence in A , AsiC-PI) to assess the role of PITPNM3 in TI Tregs, and other T cells and tumor control. Experimental schematic is provided in Supplementary information, Figure S9A . (B) Representative immunoblots showing selective knockdown of PITPNM3 protein in PB CD4 + T cells, but not tumor xenografts ( n = 3). (C) PITPNM3 knockdown did not affect the distribution of human CD45 + hematopoietic cells, CD4 + and CD8 + T cells, and CD14 + monocytes in the peripheral blood of humanized mice. Representative flow plots are shown ( n = 3). (D , E) Effect of PITPNM3 knockdown on TI naive CD4 + , Tregs and CD8 + T cell numbers, and apoptosis by TUNEL assay in xenografts. D shows representative immunofluorescence microscopy images. Top row indicates CD4 + naive T cells by arrows; the second row indicates CD4 + CD45RO + Foxp3 - CD4 + memory T cells (yellow arrows) and Foxp3 + Tregs (white arrows). Scale bar, 50 mum. E shows number of cells of each subtype/high power field in eight mice ( ** P < 0.01, *** P < 0.001 compared to PBS group by Student's t -test). (F) Flow cytometry analysis of gated human CD3 + CD4 + cells isolated from xenogra
- Submitted by
- Invitrogen Antibodies (provider)
- Main image

- Experimental details
- Figure 2 Cellular source of CD103 + cells in ESCC tissues. (A) Double immunofluorescence staining shows CD103 (green), CD3 (red), CD11c (red), CD4 (red), and CD8 (red) expression and co-localization of double-positive cells (yellow) in ESCC tissue. (B) The percentages of CD11c + CD103 + cells identified as CD11c and CD103 double-positive cells and calculated in total numbers of CD103 + cells in the ANT and IT regions. Scale bar = 25 mum. (C, D) The percentages of CD3 + CD103 + cells identified as double-positive cells and calculated in total numbers of CD103 + or CD3 + cells in the ANT and IT regions ( n = 7). (E, F) The percentages of CD4 + CD103 + and CD8 + CD103 + cells identified as double-positive cells and compared to the total numbers of CD103 + cells in the ANT (E) and IT regions (F), respectively ( n = 10). Results are the means +- SEM (bars); ** P < 0.01; *** P < 0.001.
