Explore
 Validate
 Learn
Learn Western blot
 Immunocytochemistry
Antibody data
- Antibody Data
- Antigen structure
- References [1]
- Comments [0]
- Validations
- Immunocytochemistry [2]
- Immunoprecipitation [1]
- Other assay [2]
Submit
Validation data
Reference
Comment
Report error
- Product number
- PA5-81175 - Provider product page

- Provider
- Invitrogen Antibodies
- Product name
- Fra1 Polyclonal Antibody
- Antibody type
- Polyclonal
- Antigen
- Synthetic peptide
- Description
- This product is preservative free. It is recommended to add sodium azide to avoid contamination (final concentration 0.05%-0.1%). This antibody has specificity for Human FRA1/Fosl1.
- Reactivity
- Human
- Host
- Rabbit
- Isotype
- IgG
- Vial size
- 100 μL
- Concentration
- 1 mg/mL
- Storage
- Store at 4°C short term. For long term storage, store at -20°C, avoiding freeze/thaw cycles.
Submitted references The Transcription Factor FRA-1/AP-1 Controls Lipocalin-2 Expression and Inflammation in Sepsis Model.
Cao S, Schnelzer A, Hannemann N, Schett G, Soulat D, Bozec A
Frontiers in immunology 2021;12:701675
Frontiers in immunology 2021;12:701675
No comments: Submit comment
Supportive validation
- Submitted by
- Invitrogen Antibodies (provider)
- Main image

- Experimental details
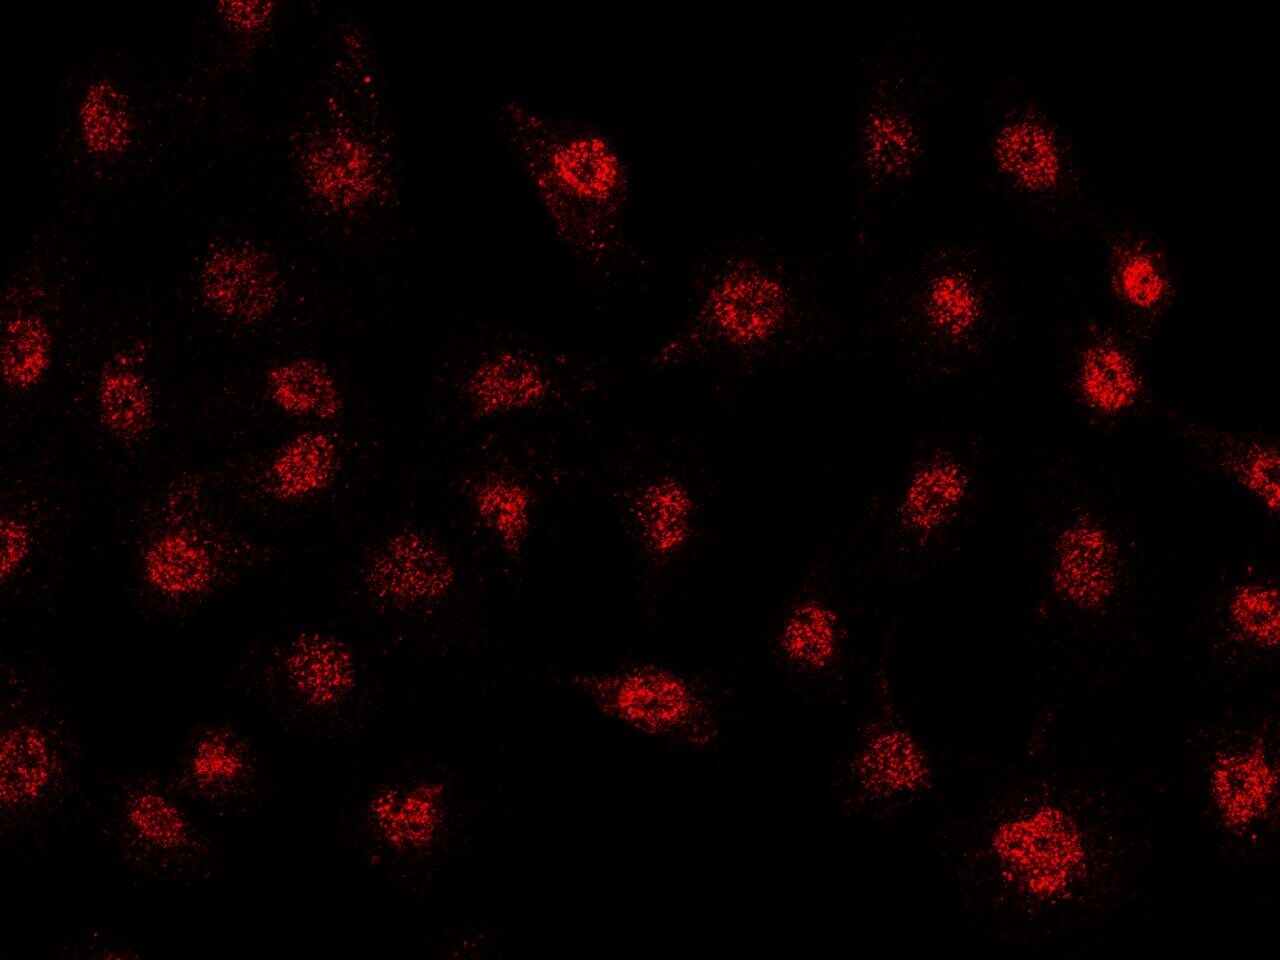
- Immunofluorescence staining of FOSL1 in A431 cells. Cells were fixed with 4% PFA, blocked with 10% serum, and incubated with Fra1 Polyclonal Antibody (Product # PA5-81175) (1 µg/mL) at 4°C overnight. Then cells were stained with the Alexa Fluor®594-conjugated Goat Anti-rabbit IgG secondary antibody (red). Positive staining was localized to nucleus.

- Submitted by
- Invitrogen Antibodies (provider)
- Main image

- Experimental details
- Immunofluorescence staining of FOSL1 in A431 cells. Cells were fixed with 4% PFA, blocked with 10% serum, and incubated with Fra1 Polyclonal Antibody (Product # PA5-81175) (1 µg/mL) at 4°C overnight. Then cells were stained with the Alexa Fluor®594-conjugated Goat Anti-rabbit IgG secondary antibody (red). Positive staining was localized to nucleus.
Supportive validation
- Submitted by
- Invitrogen Antibodies (provider)
- Main image

- Experimental details
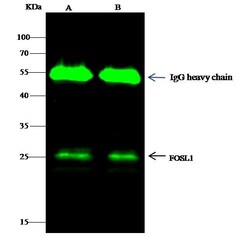
- Fra1 Immunoprecipitation using: Lane A: 0.5 mg HepG2 Whole Cell Lysate, Lane B: 0.5 mg Jurkat Whole Cell Lysate 0.5 µL with Fra1 Polyclonal Antibody (Product # PA5-81175) and 60 μg of Immunomagnetic beads Protein G. Primary antibody: Fra1 Polyclonal Antibody, at 1:500 dilution. Secondary antibody: Dylight 800-labeled antibody to rabbit IgG (H+L), at 1:5,000 dilution. Developed using the Odyssey technique. Performed under reducing conditions. Predicted band size: 29 kDa. Observed band size: 26 kDa.

Supportive validation
- Submitted by
- Invitrogen Antibodies (provider)
- Main image
- Experimental details
- Fra1 Immunoprecipitation using: Lane A: 0.5 mg HepG2 Whole Cell Lysate, Lane B: 0.5 mg Jurkat Whole Cell Lysate 0.5 µL with Fra1 Polyclonal Antibody (Product # PA5-81175) and 60 μg of Immunomagnetic beads Protein G. Primary antibody: Fra1 Polyclonal Antibody, at 1:500 dilution. Secondary antibody: Dylight 800-labeled antibody to rabbit IgG (H+L), at 1:5,000 dilution. Developed using the Odyssey technique. Performed under reducing conditions. Predicted band size: 29 kDa. Observed band size: 26 kDa.

- Submitted by
- Invitrogen Antibodies (provider)
- Main image
- Experimental details
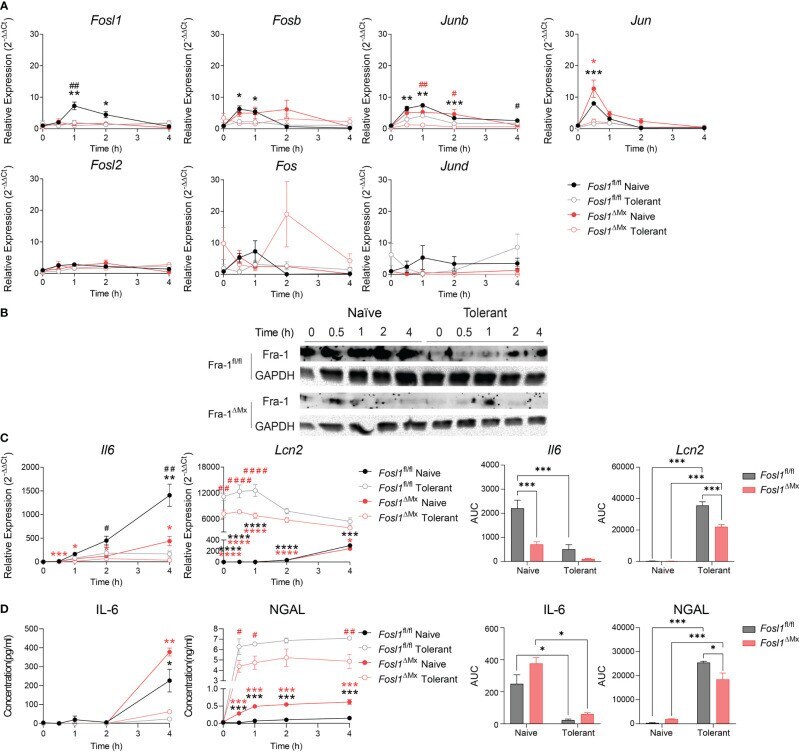
- Figure 3 Increased expression of Lcn2 after induction of endotoxin tolerance is reduced in Fosl1 knockout murine macrophages. (A) Quantitative RT-PCR analysis of AP-1 transcription factor gene expression in littermate control and Fra-1 deficient BMDM after LPS stimulation in both naive and tolerant state, normalized to the expression of Actb . (B) Western blot detection of FRA-1 protein after LPS stimulation in littermate control and FRA-1 deficient BMDM in both naive and tolerant state. GAPDH was used as loading control. (C) Quantitative RT-PCR analysis of Il6 and Lcn2 in littermate control and FRA-1 deficient BMDM after LPS stimulation in both naive and tolerant state. Left panels represent the kinetic of gene expression normalized to the expression of Actb and right panels represent the area under curve (AUC) for the respective genes. (D) IL-6 and NGAL protein levels in the supernatant of wild type and FRA-1 deficient BMDM after LPS stimulation in both naive and tolerant state. Left panels represent the kinetic of protein secretion and right panels represent the area under curve (AUC) for the respective protein. The data shown are from one experiment representative of three independent biological replicates and they are shown as mean +- s.e.m. *p < 0.05; **p < 0.01; ***p < 0.001; ****p < 0.0001 by two-way RM ANOVA with Tukey's multiple comparisons test. Black asterisks indicated significant difference between naive (n=6) versus tolerant (n=9) state in littermate control mi