Explore
 Validate
 Learn
Learn Western blot
 Chromatin Immunoprecipitation
 Other assay
Antibody data
- Antibody Data
- Antigen structure
- References [1]
- Comments [0]
- Validations
- Other assay [1]
Submit
Validation data
Reference
Comment
Report error
- Product number
- PA5-78327 - Provider product page

- Provider
- Invitrogen Antibodies
- Product name
- HOXB13 Polyclonal Antibody
- Antibody type
- Polyclonal
- Antigen
- Recombinant full-length protein
- Description
- Positive Control: PC3 WCE, NE Predicted Reactivity: Mouse (91%), Rat (92%) Store product as a concentrated solution. Centrifuge briefly prior to opening the vial.
- Reactivity
- Human, Mouse
- Host
- Rabbit
- Isotype
- IgG
- Vial size
- 100 μL
- Concentration
- 1 mg/mL
- Storage
- Store at 4°C short term. For long term storage, store at -20°C, avoiding freeze/thaw cycles.
Submitted references Long Noncoding RNA HOXA11-AS and Transcription Factor HOXB13 Modulate the Expression of Bone Metastasis-Related Genes in Prostate Cancer.
Misawa A, Kondo Y, Takei H, Takizawa T
Genes 2021 Jan 27;12(2)
Genes 2021 Jan 27;12(2)
No comments: Submit comment
Supportive validation
- Submitted by
- Invitrogen Antibodies (provider)
- Main image
- Experimental details
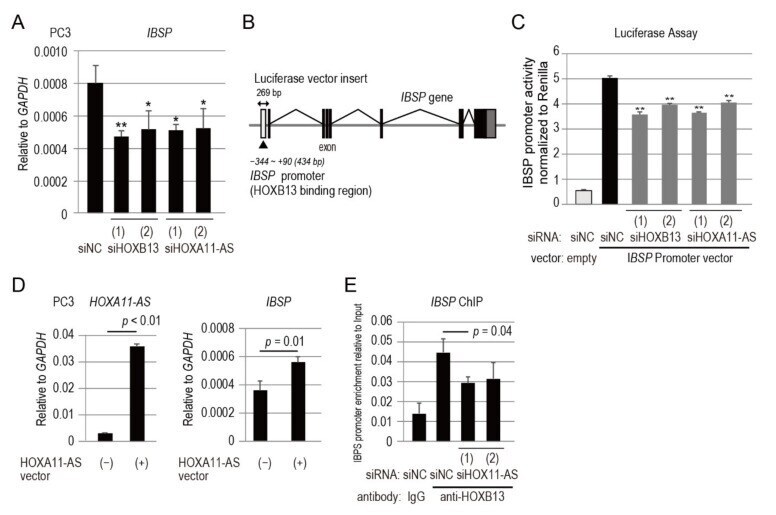
- Figure 4 IBSP promoter is directly regulated by HOXB13 in combination with HOXA11-AS . ( A ) IBSP expression analysis by qPCR in PC3 cells transfected for 48 h with siHOXB13 or siHOXA11-AS. ( B ) IBSP exons, promoter region with HOXB13 binding site, and luciferase vector insert are shown. ( C ) Luciferase assay of PC3 cells co-transfected with siHOXB13 or siHOXA11-AS and luciferase vector. Vectors with negative control siRNA (siNC) were used as controls. Values were normalized to Renilla luciferase activity. Data represent mean +- standard deviation. ( D ) Expression analysis of HOXA11-AS and IBSP by qPCR in PC3 cells transfected for 48 h with or without HOXA11-AS expression vector. ( E ) ChIP analysis of HOXB13 in IBSP promoter region in PC3 cells transfected for 24 h with siHOXA11-AS. IBSP promoter enrichment relative to input was measured by qPCR. qPCR analyses were performed in triplicate ( n = 3). Expression levels are presented relative to values of GAPDH , used as a reference gene. Values represent mean +- standard deviation. Statistical significance was determined by unpaired t -tests. *, p < 0.05. **, p < 0.01.