Explore
 Validate
 Learn
Learn Western blot
 Immunohistochemistry
Antibody data
- Antibody Data
- Antigen structure
- References [1]
- Comments [0]
- Validations
- Immunohistochemistry [2]
- Other assay [2]
Submit
Validation data
Reference
Comment
Report error
- Product number
- PA5-79629 - Provider product page

- Provider
- Invitrogen Antibodies
- Product name
- MEKK1 Polyclonal Antibody
- Antibody type
- Polyclonal
- Antigen
- Synthetic peptide
- Description
- Reconstitute with 0.2 mL of distilled water to yield a concentration of 500 µg/mL. Positive Control - WB: MCF-7 whole cell. IHC: Human Intestinal Cancer Tissue.
- Reactivity
- Human, Mouse, Rat
- Host
- Rabbit
- Isotype
- IgG
- Vial size
- 100 μg
- Concentration
- 500 μg/mL
- Storage
- -20°C
Submitted references The Integrated "Multiomics" Landscape at Peak Injury and Resolution From Alcohol-Associated Liver Disease.
Das S, Ge X, Han H, Desert R, Song Z, Athavale D, Chen W, Gaskell H, Lantvit D, Guzman G, Nieto N
Hepatology communications 2022 Jan;6(1):133-160
Hepatology communications 2022 Jan;6(1):133-160
No comments: Submit comment
Supportive validation
- Submitted by
- Invitrogen Antibodies (provider)
- Main image

- Experimental details
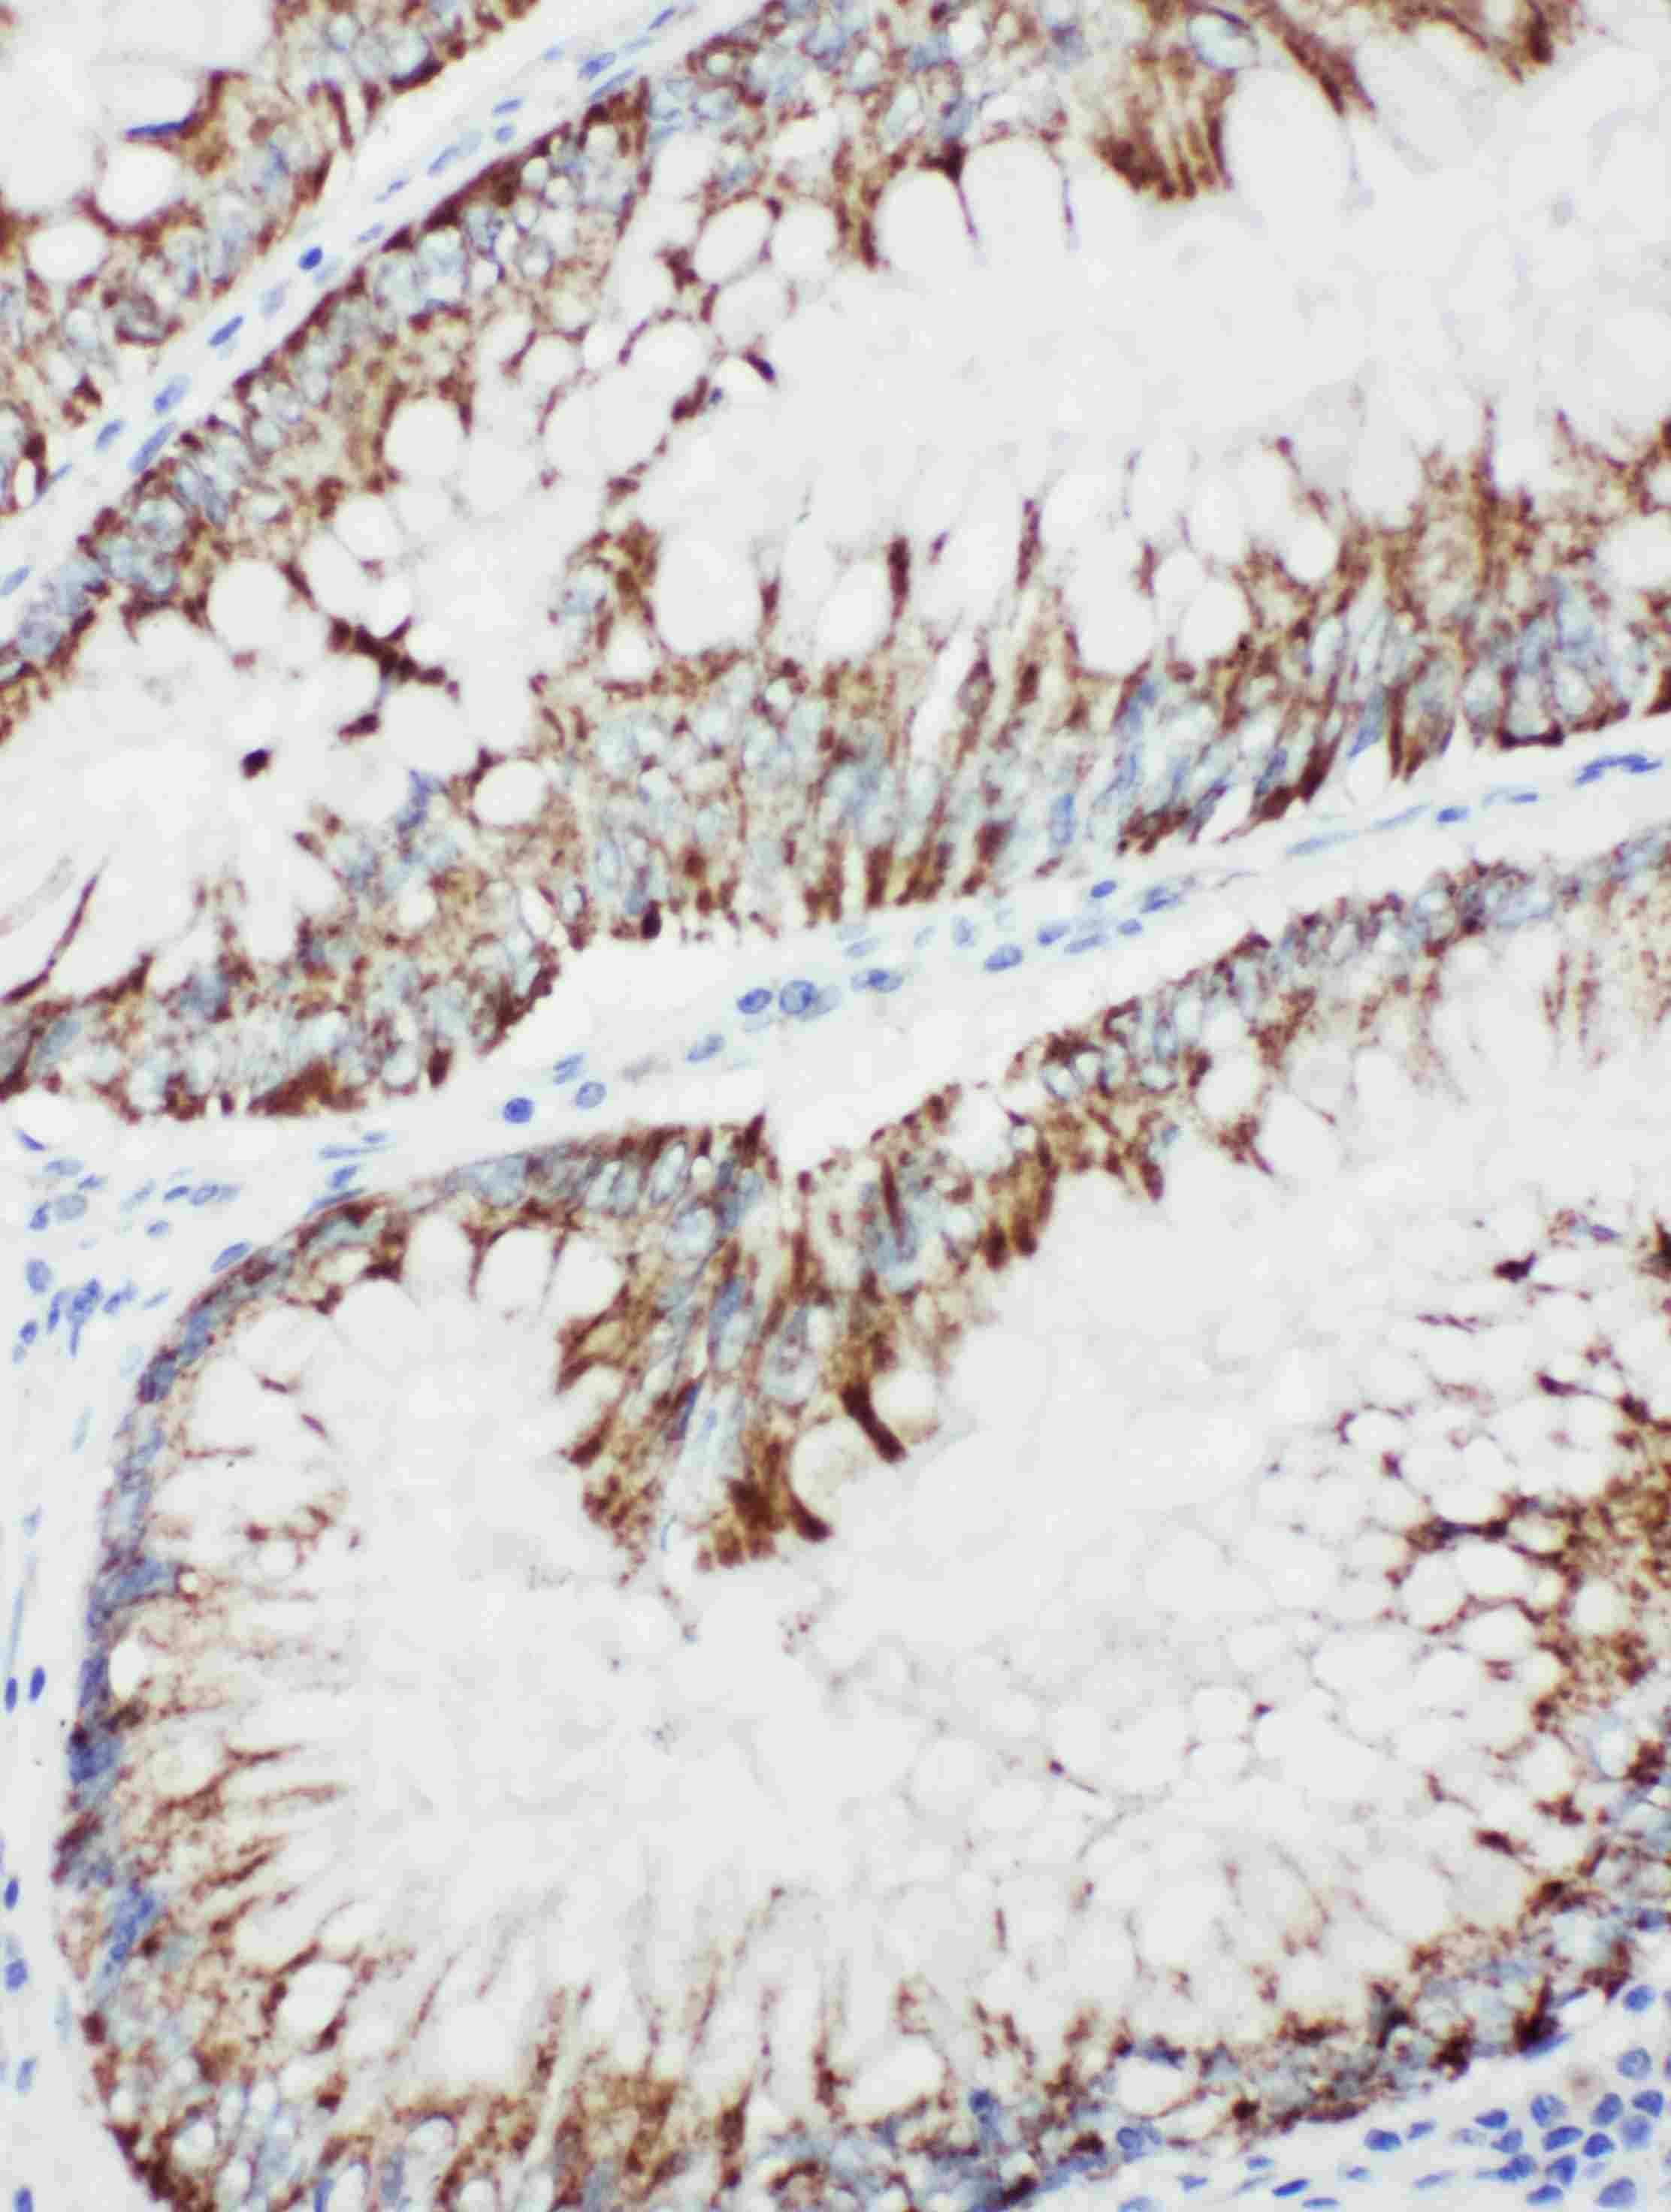
- Immunohistochemistry analysis of MEKK1 on paraffin-embedded human intestinal cancer tissue. Sample was incubated with MEKK1 polyclonal antibody (Product# PA5-79629).
- Submitted by
- Invitrogen Antibodies (provider)
- Main image

- Experimental details
- Immunohistochemistry analysis of MEKK1 on paraffin-embedded human intestinal cancer tissue. Sample was incubated with MEKK1 polyclonal antibody (Product# PA5-79629).

Supportive validation
- Submitted by
- Invitrogen Antibodies (provider)
- Main image
- Experimental details
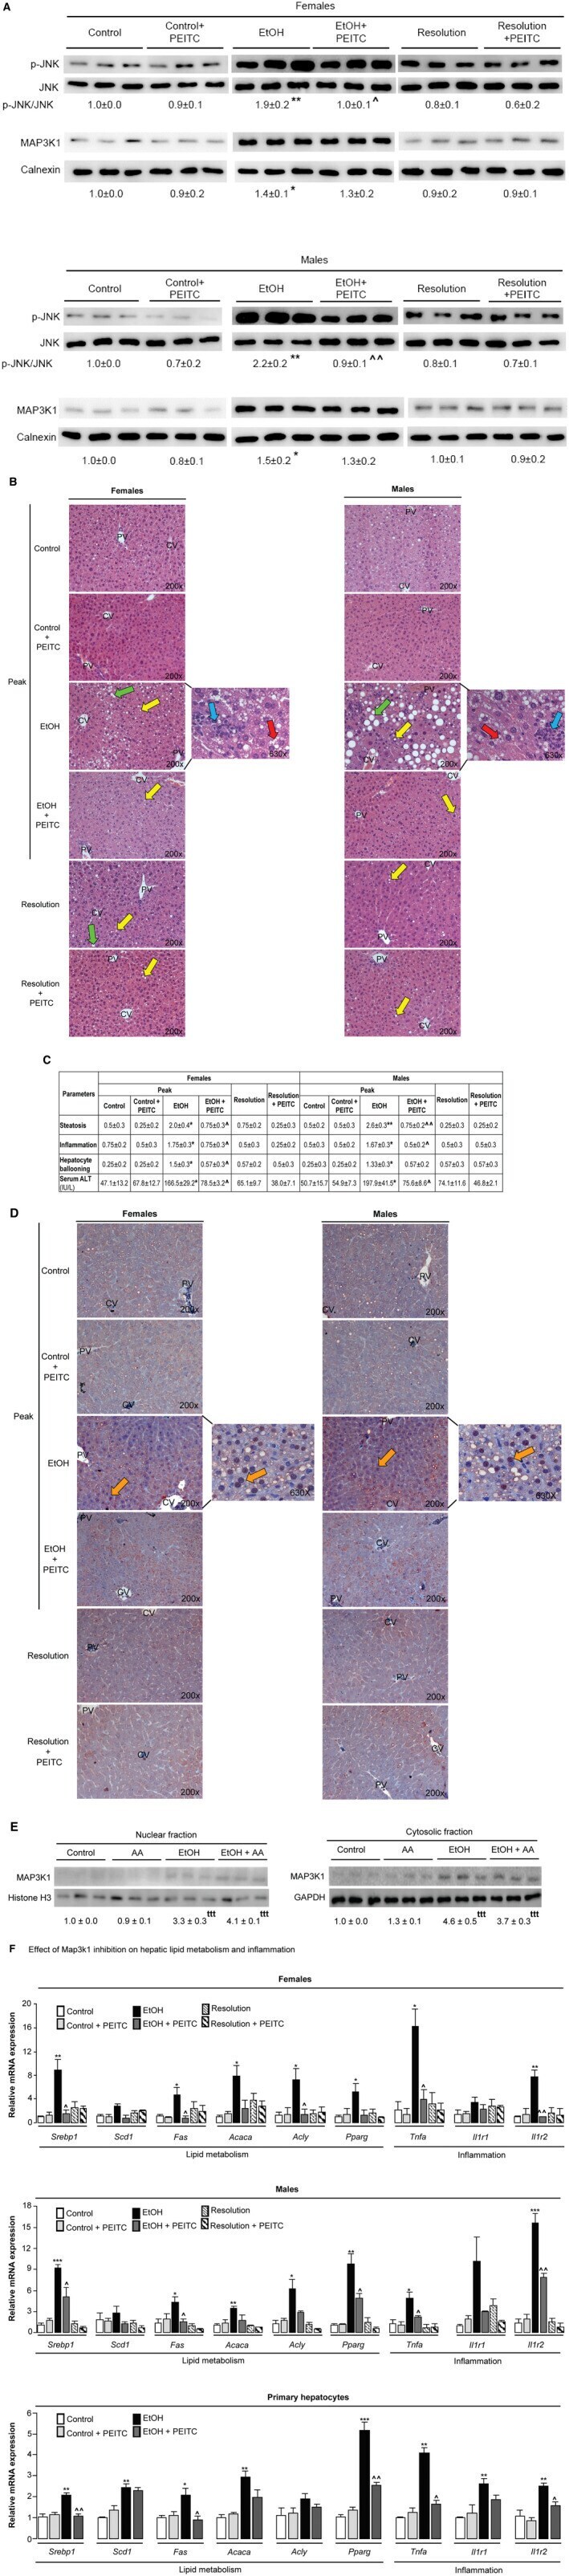
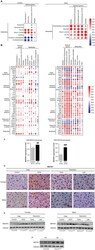
- FIG. 8 Inhibition of MAP3K1 protects from ALD. Female and male WT mice were fed the control or ethanol LDC diets with or without PEITC for 6 weeks (peak injury). To achieve early resolution from ALD, mice were switched to control diet with or without PEITC for 3 days. Western blot of p-JNK, total JNK, and MAP3K1 in livers from females and males (n = 3 mice/group/gender) (A). Liver H&E staining from females and males (green arrows, macrovesicular steatosis; yellow arrows, microvesicular steatosis; red arrows, hepatocyte ballooning degeneration; and blue arrows, inflammatory foci) (B). Scores for steatosis, inflammation, hepatocyte ballooning degeneration, and serum ALT activity (C). IHC for MAP3K1 in livers from female and male mice (orange arrows, MAP3K1-positive nuclear staining in hepatocytes) (D). Western blot of MAP3K1 in the nuclear (E, left) and cytosolic fractions (E, right) from primary hepatocytes treated with AA, EtOH, or both (n = 3/treatment). Relative expression of lipogenic and pro-inflammatory genes in livers from female and male mice at peak and resolution from ALD with and without PEITC (F, top and middle, respectively) and in primary hepatocytes (F, bottom). Data are expressed as mean +- SEM (n = 4 mice/group/gender or n = 3 hepatocyte replicates/treatment). * P < 0.05, ** P < 0.01, and *** P < 0.001 for control versus EtOH; ^ P < 0.05 and ^^ P < 0.01 for EtOH versus EtOH + PEITC; and ttt P < 0.001 for control versus EtOH or EtOH + AA. Abbreviations: CV, cen
- Submitted by
- Invitrogen Antibodies (provider)
- Main image
- Experimental details
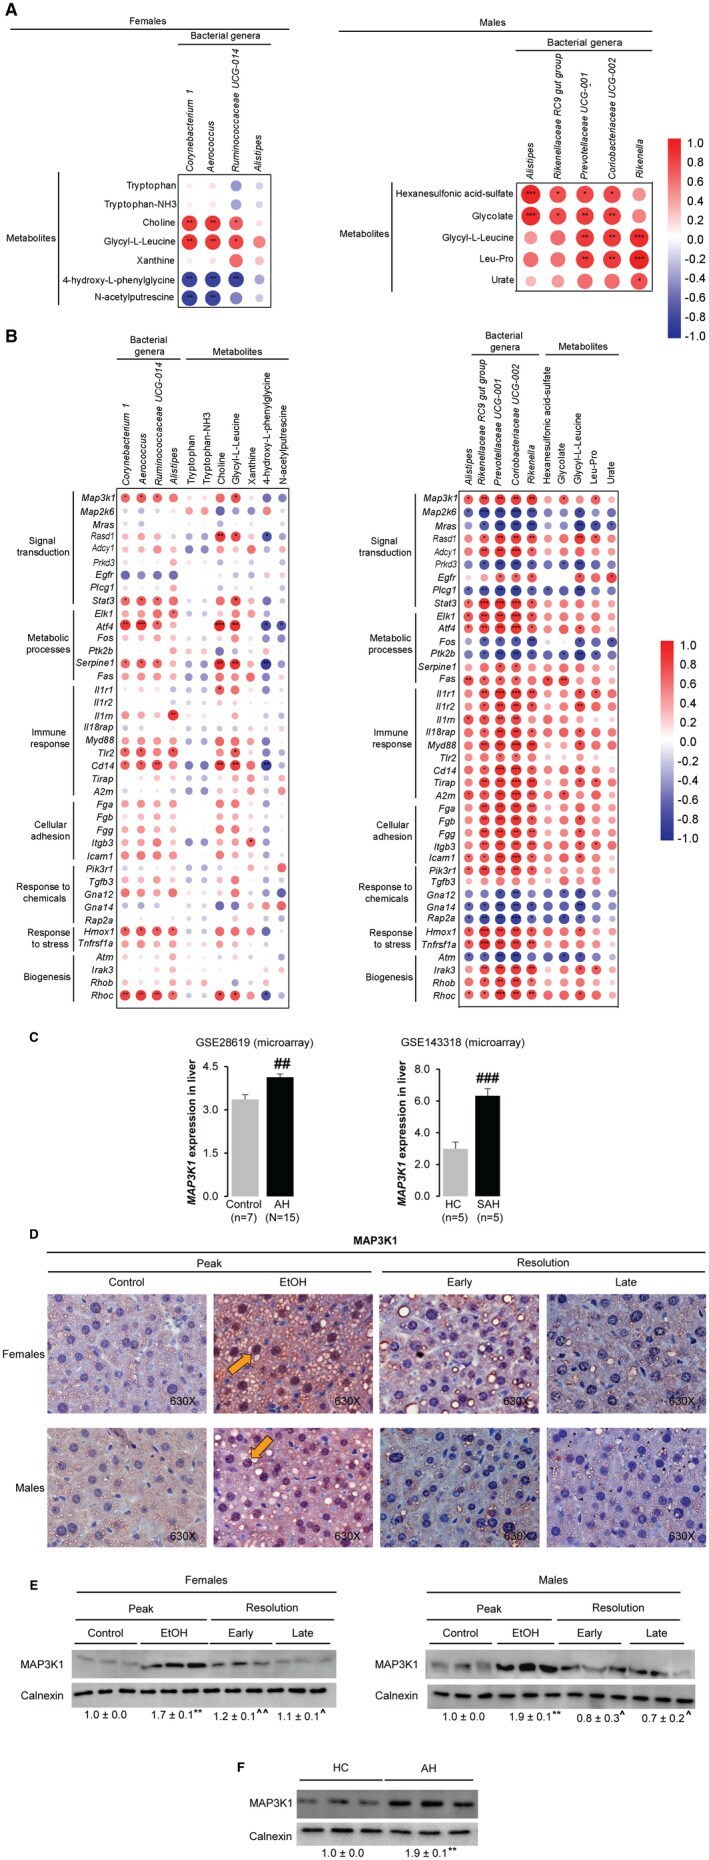
- FIG. 7 Integration among the gut microbiome, portal serum metabolome, and liver transcriptome. Female and male WT mice were fed the control or ethanol LDC diets for 6 weeks (peak injury). To achieve resolution from ALD mice were switched to control diet for 3 or 14 days (early or late resolution, respectively). Spearman's rank correlation plot depicting the correlation between metabolites and bacteria in females and males (A). Spearman's rank correlation plot depicting the correlation between genes and bacteria or metabolites in females and males. Color intensity and circle size represent the magnitude of the correlation. Asterisks indicate the significance of the correlation (* P < 0.05, ** P < 0.01, and *** P < 0.001) (B). MAP3K1 mRNA expression in publicly available liver microarray data sets ( GSE28619 : n = 15 patients with AH and n = 7 HC [n = 3 cadaveric liver donors plus four resections of liver metastases]; GSE143318 : n = 5 patients with severe AH and 5 HC) (C). IHC for MAP3K1 in liver sections from females and males (orange arrow = MAP3K1-positive nucleus in hepatocytes) (D). Western blot of MAP3K1 in livers from females and males (n = 3 mice/group/gender) (E) and in patients with AH (n = 3) and HC (n = 3) (F) normalized to Calnexin. Data are expressed as mean +- SEM. ** P < 0.01 for control versus alcohol; ^ P < 0.05 and ^^ P < 0.01 for peak ALD versus early or late resolution; ## P < 0.01 and ### P < 0.001 for patients with AH or severe AH (SAH) versus HC or cont