 Explore
 Validate
 Learn
LearnPA1-870
antibody from Invitrogen Antibodies
Targeting: SIN3A
DKFZP434K2235, KIAA0700
 Western blot
 Immunocytochemistry
 Immunoprecipitation Immunohistochemistry Chromatin Immunoprecipitation Other assay
Antibody data
- Antibody Data
- Antigen structure
- References [7]
- Comments [0]
- Validations
- Immunocytochemistry [6]
- Immunohistochemistry [1]
- Chromatin Immunoprecipitation [2]
- Other assay [2]
Submit
Validation data
Reference
Comment
Report error
- Product number
- PA1-870 - Provider product page

- Provider
- Invitrogen Antibodies
- Product name
- SIN3A Polyclonal Antibody
- Antibody type
- Polyclonal
- Antigen
- Synthetic peptide
- Description
- PA1-870 detects mSin3A from human and mouse tissues and cells. PA1-870 has been successfully used in Western blot, ICC/IF ChIP, IHC-P and immunoprecipitation procedures. By Western blot, this antibody detects an ~150 kDa protein representing mSin3A from T47D cell extract. PA1-870 immunogen is a synthetic peptide corresponding to residues M(1) K R R L D D Q E S P V Y A A Q Q R R(19) of mouse mSin3A.
- Reactivity
- Human, Mouse
- Host
- Rabbit
- Isotype
- IgG
- Vial size
- 100 μg
- Concentration
- 1 mg/mL
- Storage
- -20°C, Avoid Freeze/Thaw Cycles
Submitted references An Epigenetic Mechanism Underlying Chromosome 17p Deletion-Driven Tumorigenesis.
Biotin tagging of MeCP2 in mice reveals contextual insights into the Rett syndrome transcriptome.
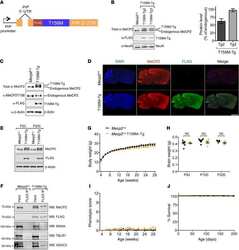
Elevating expression of MeCP2 T158M rescues DNA binding and Rett syndrome-like phenotypes.
RNA-dependent dynamic histone acetylation regulates MCL1 alternative splicing.
Protein kinase CK2 regulates the dimerization of histone deacetylase 1 (HDAC1) and HDAC2 during mitosis.
Dynamic distribution of HDAC1 and HDAC2 during mitosis: association with F-actin.
Differential requirement of histone acetylase and deacetylase activities for IRF5-mediated proinflammatory cytokine expression.
Chen M, Chen X, Li S, Pan X, Gong Y, Zheng J, Xu J, Zhao C, Zhang Q, Zhang S, Qi L, Wang Z, Shi K, Ding BS, Xue Z, Chen L, Yang S, Wang Y, Niu T, Dai L, Lowe SW, Chen C, Liu Y
Cancer discovery 2021 Jan;11(1):194-207
Cancer discovery 2021 Jan;11(1):194-207
Biotin tagging of MeCP2 in mice reveals contextual insights into the Rett syndrome transcriptome.
Johnson BS, Zhao YT, Fasolino M, Lamonica JM, Kim YJ, Georgakilas G, Wood KH, Bu D, Cui Y, Goffin D, Vahedi G, Kim TH, Zhou Z
Nature medicine 2017 Oct;23(10):1203-1214
Nature medicine 2017 Oct;23(10):1203-1214
Elevating expression of MeCP2 T158M rescues DNA binding and Rett syndrome-like phenotypes.
Lamonica JM, Kwon DY, Goffin D, Fenik P, Johnson BS, Cui Y, Guo H, Veasey S, Zhou Z
The Journal of clinical investigation 2017 May 1;127(5):1889-1904
The Journal of clinical investigation 2017 May 1;127(5):1889-1904
RNA-dependent dynamic histone acetylation regulates MCL1 alternative splicing.
Khan DH, Gonzalez C, Cooper C, Sun JM, Chen HY, Healy S, Xu W, Smith KT, Workman JL, Leygue E, Davie JR
Nucleic acids research 2014 Feb;42(3):1656-70
Nucleic acids research 2014 Feb;42(3):1656-70
Protein kinase CK2 regulates the dimerization of histone deacetylase 1 (HDAC1) and HDAC2 during mitosis.
Khan DH, He S, Yu J, Winter S, Cao W, Seiser C, Davie JR
The Journal of biological chemistry 2013 Jun 7;288(23):16518-16528
The Journal of biological chemistry 2013 Jun 7;288(23):16518-16528
Dynamic distribution of HDAC1 and HDAC2 during mitosis: association with F-actin.
He S, Khan DH, Winter S, Seiser C, Davie JR
Journal of cellular physiology 2013 Jul;228(7):1525-35
Journal of cellular physiology 2013 Jul;228(7):1525-35
Differential requirement of histone acetylase and deacetylase activities for IRF5-mediated proinflammatory cytokine expression.
Feng D, Sangster-Guity N, Stone R, Korczeniewska J, Mancl ME, Fitzgerald-Bocarsly P, Barnes BJ
Journal of immunology (Baltimore, Md. : 1950) 2010 Nov 15;185(10):6003-12
Journal of immunology (Baltimore, Md. : 1950) 2010 Nov 15;185(10):6003-12
No comments: Submit comment
Supportive validation
- Submitted by
- Invitrogen Antibodies (provider)
- Main image

- Experimental details
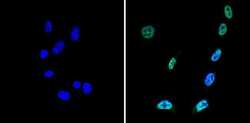
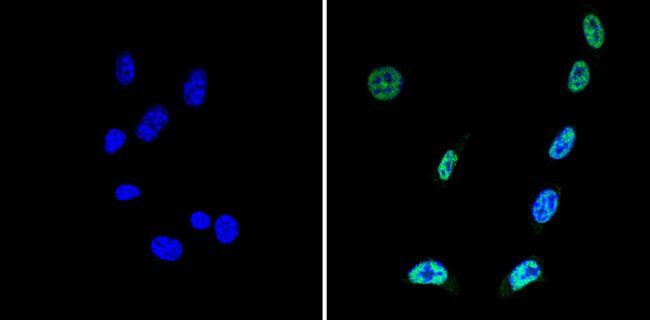
- Immunofluorescent analysis of Sin3A (green) showing staining in the nucleus of A431 cells (right) compared to a negative control without primary antibody (left). Formalin-fixed cells were permeabilized with 0.1% Triton X-100 in TBS for 5-10 minutes and blocked with 3% BSA-PBS for 30 minutes at room temperature. Cells were probed with a Sin3A polyclonal antibody (Product # PA1-870) in 3% BSA-PBS at a dilution of 1:100 and incubated overnight at 4ºC in a humidified chamber. Cells were washed with PBST and incubated with a DyLight-conjugated secondary antibody in PBS at room temperature in the dark. Actin was stained using Alexa Fluor 554 (red) and nuclei were stained with Hoechst or DAPI (blue). Images were taken at a magnification of 60x.

- Submitted by
- Invitrogen Antibodies (provider)
- Main image
- Experimental details
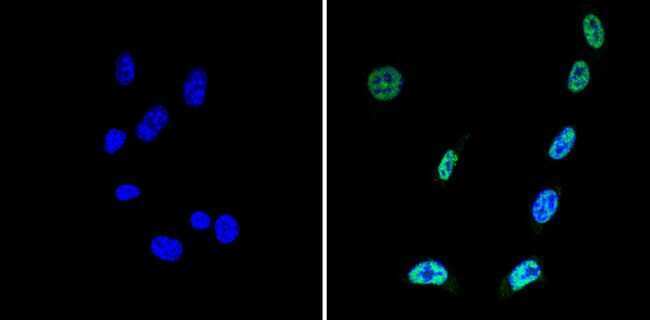
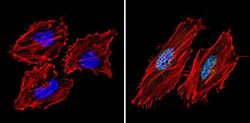
- Immunofluorescent analysis of Sin3A (green) showing staining in the nucleus of NIH-3T3 cells (right) compared to a negative control without primary antibody (left). Formalin-fixed cells were permeabilized with 0.1% Triton X-100 in TBS for 5-10 minutes and blocked with 3% BSA-PBS for 30 minutes at room temperature. Cells were probed with a Sin3A polyclonal antibody (Product # PA1-870) in 3% BSA-PBS at a dilution of 1:100 and incubated overnight at 4ºC in a humidified chamber. Cells were washed with PBST and incubated with a DyLight-conjugated secondary antibody in PBS at room temperature in the dark. Nuclei (blue) were stained with Hoechst or DAPI. Images were taken at a magnification of 60x.
- Submitted by
- Invitrogen Antibodies (provider)
- Main image
- Experimental details
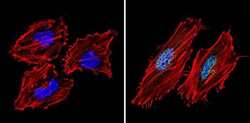
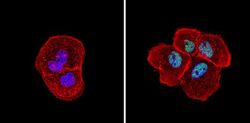
- Immunofluorescent analysis of Sin3A (green) showing staining in the nucleus of Hela cells (right) compared to a negative control without primary antibody (left). Formalin-fixed cells were permeabilized with 0.1% Triton X-100 in TBS for 5-10 minutes and blocked with 3% BSA-PBS for 30 minutes at room temperature. Cells were probed with a Sin3A polyclonal antibody (Product # PA1-870) in 3% BSA-PBS at a dilution of 1:200 and incubated overnight at 4ºC in a humidified chamber. Cells were washed with PBST and incubated with a DyLight-conjugated secondary antibody in PBS at room temperature in the dark. Actin was stained using Alexa Fluor 554 (red) and nuclei were stained with Hoechst or DAPI (blue). Images were taken at a magnification of 60x.
- Submitted by
- Invitrogen Antibodies (provider)
- Main image

- Experimental details
- Immunofluorescent analysis of Sin3A (green) showing staining in the nucleus of NIH-3T3 cells (right) compared to a negative control without primary antibody (left). Formalin-fixed cells were permeabilized with 0.1% Triton X-100 in TBS for 5-10 minutes and blocked with 3% BSA-PBS for 30 minutes at room temperature. Cells were probed with a Sin3A polyclonal antibody (Product # PA1-870) in 3% BSA-PBS at a dilution of 1:100 and incubated overnight at 4ºC in a humidified chamber. Cells were washed with PBST and incubated with a DyLight-conjugated secondary antibody in PBS at room temperature in the dark. Nuclei (blue) were stained with Hoechst or DAPI. Images were taken at a magnification of 60x.
- Submitted by
- Invitrogen Antibodies (provider)
- Main image
- Experimental details
- Immunofluorescent analysis of Sin3A (green) showing staining in the nucleus of A431 cells (right) compared to a negative control without primary antibody (left). Formalin-fixed cells were permeabilized with 0.1% Triton X-100 in TBS for 5-10 minutes and blocked with 3% BSA-PBS for 30 minutes at room temperature. Cells were probed with a Sin3A polyclonal antibody (Product # PA1-870) in 3% BSA-PBS at a dilution of 1:100 and incubated overnight at 4ºC in a humidified chamber. Cells were washed with PBST and incubated with a DyLight-conjugated secondary antibody in PBS at room temperature in the dark. Actin was stained using Alexa Fluor 554 (red) and nuclei were stained with Hoechst or DAPI (blue). Images were taken at a magnification of 60x.

- Submitted by
- Invitrogen Antibodies (provider)
- Main image
- Experimental details
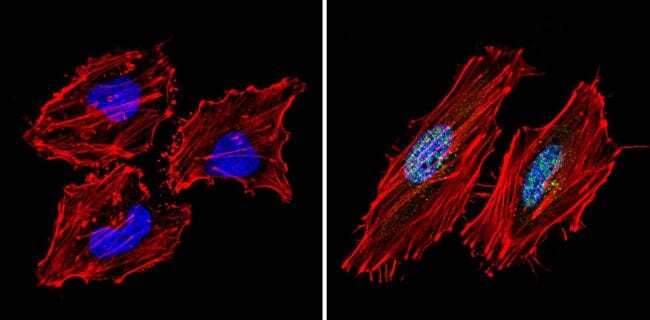
- Immunofluorescent analysis of Sin3A (green) showing staining in the nucleus of Hela cells (right) compared to a negative control without primary antibody (left). Formalin-fixed cells were permeabilized with 0.1% Triton X-100 in TBS for 5-10 minutes and blocked with 3% BSA-PBS for 30 minutes at room temperature. Cells were probed with a Sin3A polyclonal antibody (Product # PA1-870) in 3% BSA-PBS at a dilution of 1:200 and incubated overnight at 4ºC in a humidified chamber. Cells were washed with PBST and incubated with a DyLight-conjugated secondary antibody in PBS at room temperature in the dark. Actin was stained using Alexa Fluor 554 (red) and nuclei were stained with Hoechst or DAPI (blue). Images were taken at a magnification of 60x.

Supportive validation
- Submitted by
- Invitrogen Antibodies (provider)
- Main image
- Experimental details
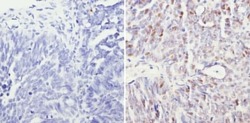
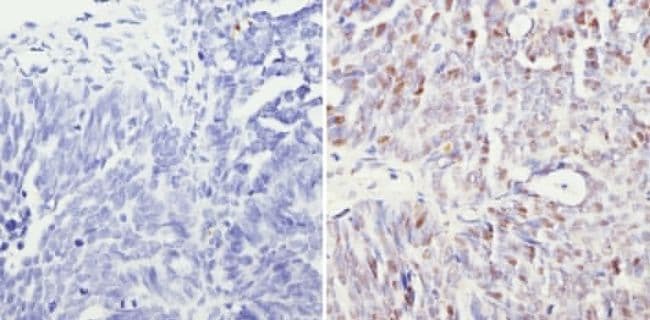
- Immunohistochemistry analysis of Sin3A showing staining in the nucleus of paraffin-embedded human ovary carcinoma (right) compared to a negative control without primary antibody (left). To expose target proteins, antigen retrieval was performed using 10mM sodium citrate (pH 6.0), microwaved for 8-15 min. Following antigen retrieval, tissues were blocked in 3% H2O2-methanol for 15 min at room temperature, washed with ddH2O and PBS, and then probed with a Sin3A polyclonal antibody (Product # PA1-870) diluted in 3% BSA-PBS at a dilution of 1:200 overnight at 4°C in a humidified chamber. Tissues were washed extensively in PBST and detection was performed using an HRP-conjugated secondary antibody followed by colorimetric detection using a DAB kit. Tissues were counterstained with hematoxylin and dehydrated with ethanol and xylene to prep for mounting.
Supportive validation
- Submitted by
- Invitrogen Antibodies (provider)
- Main image

- Experimental details
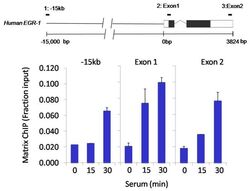
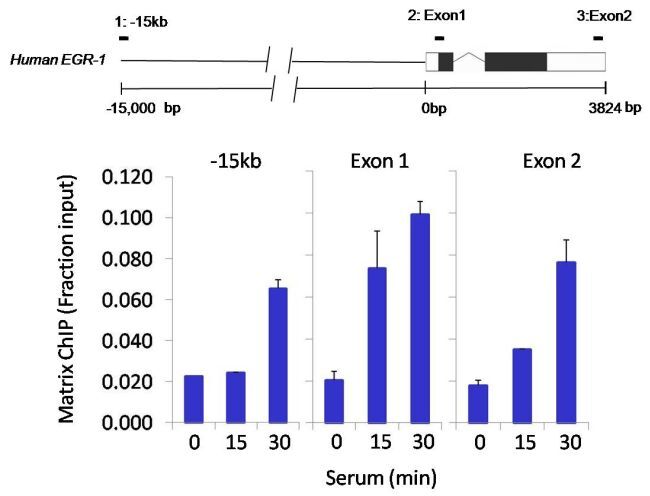
- Chromatin immunoprecipitation analysis of Sin3A was performed using cross-linked chromatin from 1x10^6 HCT116 colon carcinoma cells treated with serum for 0, 15, and 30 minutes. Immunoprecipitation was performed using a multiplex microplate Matrix ChIP assay (see reference for Matrix ChIP protocol: http://www.ncbi.nlm.nih.gov/pubmed/22098709) with 1.0 µL/100 µL well volume of a Sin3A polyclonal antibody (Product # PA1-870). Chromatin aliquots from ~1x10^5 cells were used per ChIP pull-down. Quantitative PCR data were done in quadruplicate using 1 µL of eluted DNA in 2 µL SYBR real-time PCR reactions containing primers to amplify -15kb upstream of the Egr1 gene or exon-1 or exon-2 of Egr1. PCR calibration curves were generated for each primer pair from a dilution series of sheared total genomic DNA. Quantitation of immunoprecipitated chromatin is presented as signal relative to the total amount of input chromatin. Results represent the mean +/- SEM for three experiments. A schematic representation of the Egr-1 locus is shown above the data where boxes represent exons (black boxes = translated regions, white boxes = untranslated regions), the zigzag line represents an intron, and the straight line represents upstream sequence. Regions amplified by Egr-1 primers are represented by black bars. Data courtesy of the Innovators Program.

- Submitted by
- Invitrogen Antibodies (provider)
- Main image
- Experimental details
- Chromatin immunoprecipitation analysis of Sin3A was performed using cross-linked chromatin from 1x10^6 HCT116 colon carcinoma cells treated with serum for 0, 15, and 30 minutes. Immunoprecipitation was performed using a multiplex microplate Matrix ChIP assay (see reference for Matrix ChIP protocol: http://www.ncbi.nlm.nih.gov/pubmed/22098709) with 1.0 µL/100 µL well volume of a Sin3A polyclonal antibody (Product # PA1-870). Chromatin aliquots from ~1x10^5 cells were used per ChIP pull-down. Quantitative PCR data were done in quadruplicate using 1 µL of eluted DNA in 2 µL SYBR real-time PCR reactions containing primers to amplify -15kb upstream of the Egr1 gene or exon-1 or exon-2 of Egr1. PCR calibration curves were generated for each primer pair from a dilution series of sheared total genomic DNA. Quantitation of immunoprecipitated chromatin is presented as signal relative to the total amount of input chromatin. Results represent the mean +/- SEM for three experiments. A schematic representation of the Egr-1 locus is shown above the data where boxes represent exons (black boxes = translated regions, white boxes = untranslated regions), the zigzag line represents an intron, and the straight line represents upstream sequence. Regions amplified by Egr-1 primers are represented by black bars. Data courtesy of the Innovators Program.
Supportive validation
- Submitted by
- Invitrogen Antibodies (provider)
- Main image

- Experimental details
- NULL
- Submitted by
- Invitrogen Antibodies (provider)
- Main image
- Experimental details
- NULL
