Explore
 Validate
 Learn
Learn Western blot
 Immunocytochemistry
 Immunoprecipitation
Antibody data
- Antibody Data
- Antigen structure
- References [1]
- Comments [0]
- Validations
- Immunocytochemistry [2]
- Other assay [1]
Submit
Validation data
Reference
Comment
Report error
- Product number
- PA5-17556 - Provider product page

- Provider
- Invitrogen Antibodies
- Product name
- SLP76 Polyclonal Antibody
- Antibody type
- Polyclonal
- Antigen
- Synthetic peptide
- Description
- It is not recommended to aliquot this antibody.
- Reactivity
- Human, Mouse
- Host
- Rabbit
- Isotype
- IgG
- Vial size
- 100 μL
- Concentration
- 56 μg/mL
- Storage
- -20°C
Submitted references The tumor suppressor adenomatous polyposis coli regulates T lymphocyte migration.
Mastrogiovanni M, Vargas P, Rose T, Cuche C, Esposito E, Juzans M, Laude H, Schneider A, Bernard M, Goyard S, Renaudat C, Ungeheuer MN, Delon J, Alcover A, Di Bartolo V
Science advances 2022 Apr 15;8(15):eabl5942
Science advances 2022 Apr 15;8(15):eabl5942
No comments: Submit comment
Supportive validation
- Submitted by
- Invitrogen Antibodies (provider)
- Main image

- Experimental details
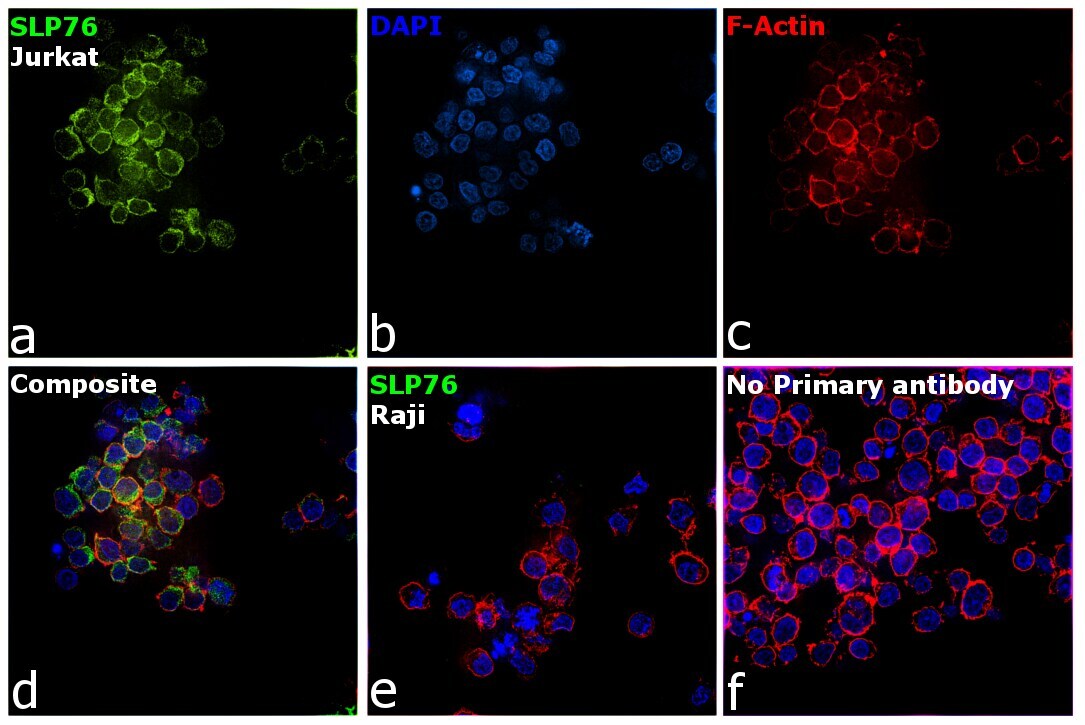
- Immunofluorescence analysis of SLP76 was performed using 70% confluent log phase Jurkat and Raji cells. The cells were fixed with 4% paraformaldehyde for 10 minutes, permeabilized with 0.1% Triton™ X-100 for 15 minutes, and blocked with 2% BSA for 1 hour at room temperature. The cells were labeled with SLP76 Polyclonal Antibody (Product # PA5-17556) at 1:100 dilution in 0.1% BSA, incubated at 4 degree Celsius overnight and then with Donkey anti-Rabbit IgG (H+L) Highly Cross-Adsorbed Secondary Antibody, Alexa Fluor Plus 488 (Product # A32790) at a dilution of 1:2000 for 45 minutes at room temperature (Panel a: green). Nuclei (Panel b: blue) were stained with SlowFade® Gold Antifade Mountant with DAPI (Product # S36938). F-actin (Panel c: red) was stained with Rhodamine Phalloidin (Product # R415, 1:300). Panel d represents the merged image showing cytoplasmic localization. Panel e represents Raji cells having no expression of SLP76. Panel f represents control cells with no primary antibody to assess background. The images were captured at 60X magnification.
- Submitted by
- Invitrogen Antibodies (provider)
- Main image
- Experimental details
- Immunofluorescence analysis of SLP76 was performed using 70% confluent log phase Jurkat and Raji cells. The cells were fixed with 4% paraformaldehyde for 10 minutes, permeabilized with 0.1% Triton™ X-100 for 15 minutes, and blocked with 2% BSA for 1 hour at room temperature. The cells were labeled with SLP76 Polyclonal Antibody (Product # PA5-17556) at 1:100 dilution in 0.1% BSA, incubated at 4 degree Celsius overnight and then with Donkey anti-Rabbit IgG (H+L) Highly Cross-Adsorbed Secondary Antibody, Alexa Fluor Plus 488 (Product # A32790) at a dilution of 1:2000 for 45 minutes at room temperature (Panel a: green). Nuclei (Panel b: blue) were stained with SlowFade® Gold Antifade Mountant with DAPI (Product # S36938). F-actin (Panel c: red) was stained with Rhodamine Phalloidin (Product # R415, 1:300). Panel d represents the merged image showing cytoplasmic localization. Panel e represents Raji cells having no expression of SLP76. Panel f represents control cells with no primary antibody to assess background. The images were captured at 60X magnification.

Supportive validation
- Submitted by
- Invitrogen Antibodies (provider)
- Main image
- Experimental details
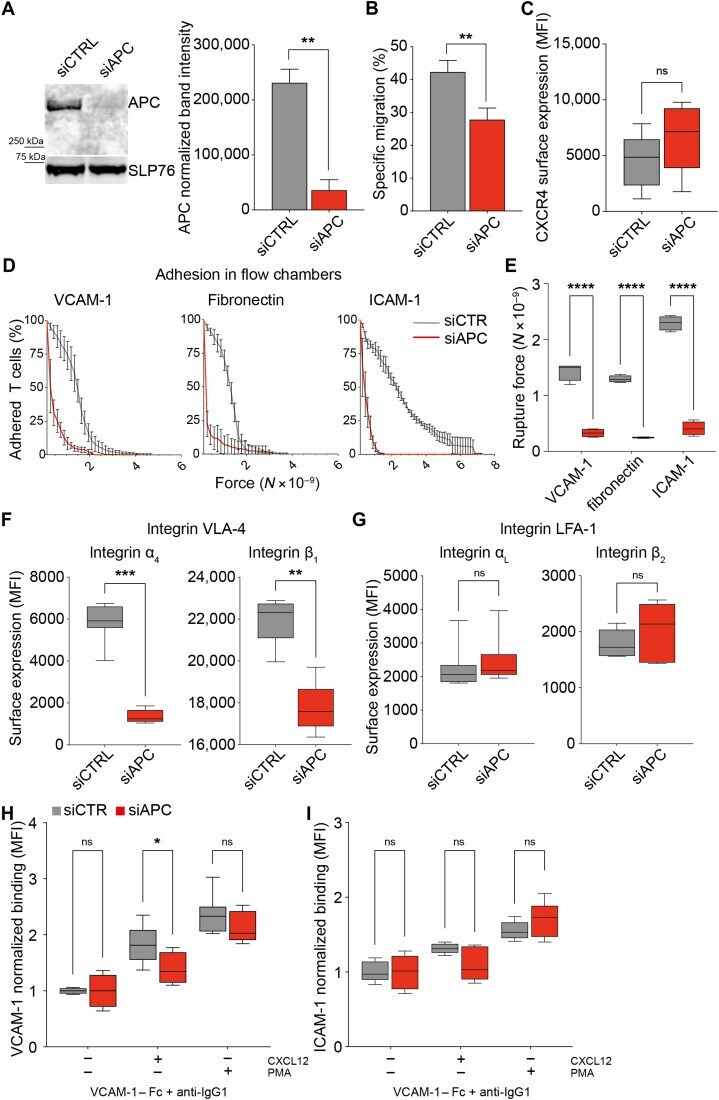
- Fig. 3. APC silencing impairs migration and adhesion of CEM T cells. CEM T cells were transfected with control (siCTRL) or APC (siAPC) siRNA oligonucleotides and used 72 hours after transfection. ( A ) Western blot showing the expression level of APC protein in siCTRL- and siAPC-transfected CEM T cells. A representative result is shown in the left panel. APC band intensity was quantified from four independent immunoblots and normalized by the SLP76 intensity in the same sample (right panel). ( B ) Transmigration through transwell filters was analyzed for control and APC-silenced CEM T cells. Bar plots represent the mean + SD of T cell-specific migration toward CXCL12. ( C , F , and G ) Surface expression of the CXCL12 chemokine receptor CXCR4 (C) and the alpha 4 beta 1 /VLA-4 (F) and alpha L beta 2 /LFA-1 (G) integrins was measured by flow cytometry. Boxes display the median fluorescence intensity. ( D and E ) siCTRL- and siAPC-CEM T cells were seeded in VCAM-1 or fibronectin or ICAM-1 + CXCL12-coated chambers, and a laminar shear flow of PBS was applied through the chamber (movie S3). (D) The number of adherent cells per frame was plotted as a function of the force on the different substrates. (E) Boxes represent the rupture force of adhesion to VCAM-1-, fibronectin-, and ICAM-1 + CXCL12-coated surfaces of siCTRL versus siAPC T cells. ( H and I ) VLA-4 and LFA-1 integrin activation was assessed by measuring the binding of T cells with the corresponding integrin ligands: VCAM