 Explore
 Validate
 Learn
Learn Western blot
 Immunoprecipitation
Antibody data
- Antibody Data
- Antigen structure
- References [0]
- Comments [0]
- Validations
- Western blot [3]
- Immunocytochemistry [1]
- Immunohistochemistry [2]
- Other assay [7]
Submit
Validation data
Reference
Comment
Report error
- Product number
- MA1-850 - Provider product page

- Provider
- Invitrogen Antibodies
- Product name
- gamma Tubulin Monoclonal Antibody (4D11)
- Antibody type
- Monoclonal
- Antigen
- Recombinant full-length protein
- Description
- MA1-850 detects gamma Tubulin from human, mouse, monkey, and rat samples. MA1-850 has been successfully used in Western blot, immunoprecipitation, and immunofluorescence procedures. The MA1-850 immunogen is a recombinant protein containing residues A A T R P D Y I S W G T Q E Q of human gamma Tubulin.
- Reactivity
- Human, Mouse, Rat
- Host
- Mouse
- Isotype
- IgG
- Antibody clone number
- 4D11
- Vial size
- 100 µg
- Concentration
- 1 mg/mL
- Storage
- -20° C, Avoid Freeze/Thaw Cycles
No comments: Submit comment
Supportive validation
- Submitted by
- Invitrogen Antibodies (provider)
- Main image
- Experimental details
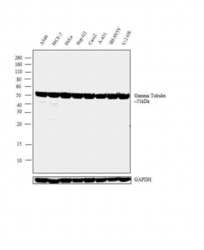
- Western blot analysis was performed on membrane enriched extracts (30 µg lysate) of A-549 (Lane 1), MCF-7 (Lane 2), HeLa (Lane 3), HepG2 (Lane 4), Caco2 (Lane 5), A-431 (Lane 6), SH-SY5Y (Lane 7) and U-2 OS (Lane 8). The blot was probed with Anti-gamma Tubulin Mouse Monoclonal Antibody (Product # MA1-850, 1 µg/mL) and detected by chemiluminescence using Goat anti-Mouse IgG (H+L) Superclonal™ Secondary Antibody, HRP conjugate (Product # A28177, 0.25 µg/mL, 1:4000 dilution). A 51 kDa band corresponding to gamma Tubulin was observed across the cell lines tested. Known quantity of protein samples were electrophoresed using Novex® NuPAGE® 10 % Bis-Tris gel (Product # NP0321BOX), XCell SureLock™ Electrophoresis System (Product # EI0002) and Novex® Sharp Pre-Stained Protein Standard (Product # LC5800). Resolved proteins were then transferred onto a nitrocellulose membrane with iBlot® 2 Dry Blotting System (Product # IB21001). The membrane was probed with the relevant primary and secondary Antibody following blocking with 5 % skimmed milk. Chemiluminescent detection was performed using Pierce™ ECL Western Blotting Substrate (Product # 32106).

- Submitted by
- Invitrogen Antibodies (provider)
- Main image

- Experimental details
- Western blot analysis was performed by loading 50 µg of various whole cell lysates onto a 4-20% Tris-HCl polyacrylamide gel. Proteins were transferred to a PVDF membrane and blocked with 5% Milk/TBST for at least 1 hour. Membranes were probed with a mouse monoclonal antibody recognizing g-Tubulin (Product # MA1-850, Clone 4D11) at a dilution of 1:1000 overnight at 4°C on a rocking platform. Membranes were washed in TBS-0.1%Tween 20 and probed with a goat anti-mouse-HRP secondary antibody (Product # 31430) at a dilution of 1:20,000 for at least one hour. Membranes were washed and chemiluminescent detection performed using Pierce Super Signal West Dura (Product # 34075).

- Submitted by
- Invitrogen Antibodies (provider)
- Main image

- Experimental details
- Knockdown of gamma Tubulin was achieved by transfecting HeLa cells with gamma Tubulin specific validated siRNA (Silencer® select Cat # s14502). Western blot analysis (Fig a) was performed using modified whole cell extract (1% SDS) from the gamma Tubulin knock down cells (lane 3), non-specific scrambled siRNA transfected cells (lane 2) and untransfected cells (lane 1). The blots were probed with Anti-gamma Tubulin mouse monoclonal antibody (Product # MA1-850, 1:1000) and Goat anti-Mouse IgG (H+L) Superclonal Secondary Antibody, HRP conjugate (Product # A28177, 1:5000 dilution). Densitometric analysis of this western blot is shown in histogram (Fig b). Loss of signal upon siRNA mediated knock down confirms that antibody is specific to gamma Tubulin.

Supportive validation
- Submitted by
- Invitrogen Antibodies (provider)
- Main image

- Experimental details
- Immunofluorescent analysis of g-Tubulin using anti-g-Tubulin monoclonal antibody (Product # MA1-850, Clone 4D11) (shown in green) in HeLa (A) and U2-OS cells (B). Formalin fixed cells were permeabilized with 0.1% Triton X-100 in TBS for 10 minutes at room temperature. Cells were then blocked with 1% Blocker BSA (Product # 37525) for 15 minutes at room temperature. Cells were probed with a mouse monoclonal antibody recognizing g-Tubulin (Product # MA1-850), at a dilution of 1:50 for at least 1 hour at room temperature. Cells were washed with PBS and incubated with DyLight 488 goat-anti-mouse secondary antibody (Product # 35503) at a dilution of 1:400 for 30 minutes at room temperature. F-Actin (red) was stained with DY-547 phalloidin, nuclei (blue) were stained with Hoechst 33342 dye (Product # 62249). Images were taken on a Thermo Scientific ArrayScan at 20X magnification.

Supportive validation
- Submitted by
- Invitrogen Antibodies (provider)
- Main image
- Experimental details
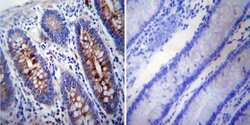
- Immunohistochemistry was performed on normal deparaffinized human Colon tissue. To expose target proteins, heat induced antigen retrieval was performed using 10mM sodium citrate (pH6.0) buffer, microwaved for 8-15 minutes. Following antigen retrieval tissues were blocked in 3% BSA-PBS for 30 minutes at room temperature. Tissues were then probed at a dilution of 1:200 with a mouse monoclonal antibody recognizing gamma Tubulin (Product # MA1-850) or without primary antibody (negative control) overnight at 4°C in a humidified chamber. Tissues were washed extensively with PBST and endogenous peroxidase activity was quenched with a peroxidase suppressor. Detection was performed using a biotin-conjugated secondary antibody and SA-HRP, followed by colorimetric detection using DAB. Tissues were counterstained with hematoxylin and prepped for mounting.

- Submitted by
- Invitrogen Antibodies (provider)
- Main image

- Experimental details
- Immunohistochemistry was performed on cancer biopsies of deparaffinized human Breast carcinoma tissue. To expose target proteins, heat induced antigen retrieval was performed using 10mM sodium citrate (pH6.0) buffer, microwaved for 8-15 minutes. Following antigen retrieval tissues were blocked in 3% BSA-PBS for 30 minutes at room temperature. Tissues were then probed at a dilution of 1:20 with a mouse monoclonal antibody recognizing gamma Tubulin (Product # MA1-850) or without primary antibody (negative control) overnight at 4°C in a humidified chamber. Tissues were washed extensively with PBST and endogenous peroxidase activity was quenched with a peroxidase suppressor. Detection was performed using a biotin-conjugated secondary antibody and SA-HRP, followed by colorimetric detection using DAB. Tissues were counterstained with hematoxylin and prepped for mounting.

Supportive validation
- Submitted by
- Invitrogen Antibodies (provider)
- Main image

- Experimental details
- NULL

- Submitted by
- Invitrogen Antibodies (provider)
- Main image

- Experimental details
- Figure 5 MYC overexpression induces double-strand breaks in DNA. A) A SV40-transformed human lung cell line, WI-38 VA13, stably-expressing c-MYC, L-MYC, or N-MYC, were lyzed and immunoblots were analyzed for phosphorylated histone H2AX (anti-gammaH2AX) and GADPH (anti-GADPH). As a positive control for DNA damage detection, parental cells were treated with etoposide and analyzed via immunoblotting. Cell lysates were also analyzed for overexpression of MYC variants. B) The same cells lines as in A were treated with the PRKDC inhibitor, KU0060648, for 8 h, lyzed and immunoblotted for phosphorylated histone H2AX (anti-gammaH2AX) and gamma-tubulin (anti-gamma-tubulin). Signal intensities of immunoblots were quantified using ImageJ.

- Submitted by
- Invitrogen Antibodies (provider)
- Main image

- Experimental details
- Figure 2 SREBP expression and processing in the absence of calreticulin. ( A ) Q-PCR quantitative analysis of total SREBP-1 and SREBP-2 mRNA abundance in wild-type and Calr -/- cells. Results were normalized to 18S rRNA (internal control). NS, not significant (Student's t-test). Representative of 5 biological replicates. ( B ) Immunoblot analysis of SREBP-1, nSREBP-1, SREBP-2 and nSREBP-2 protein in wild-type and Calr -/- cells. Anti-gamma-tubulin antibodies were used as a loading control. Representative of 3 biological replicates. ( C , D ) Quantitative analysis of immunoblots showing the ratio of nuclear to total SREBP-1 ( C ) and total SREBP-2 ( D ) in wild-type and Calr -/- cells. The value for the total is the sum of precursor and nuclear forms of SREBP. *Indicates statistically significant differences: SREBP-1, p -value = 0.0017 (Student's t-test); SREBP-2, p -value = 0.0218 (Student's t-test). Representative of 3 biological replicates. ( E ) GFP:SBP-1 accumulation in the intestinal nucleus (arrows) in wild-type N2 and calreticulin deficient crt - 1 C . elegans . Worms expressing GFP:SBP-1 driven by sbp - 1 promoter are shown. The average ratio of fluorescence in the nucleus and cytoplasm was calculated in each worm, and scatter-plotted ( right panel ). **Indicates statistically significant differences: p -value < 0.01 (Student's t-test). Representative of 3 biological replicates. ( F ) Wild-type, Calr -/- cells and Calr -/- cells transfected with a

- Submitted by
- Invitrogen Antibodies (provider)
- Main image

- Experimental details
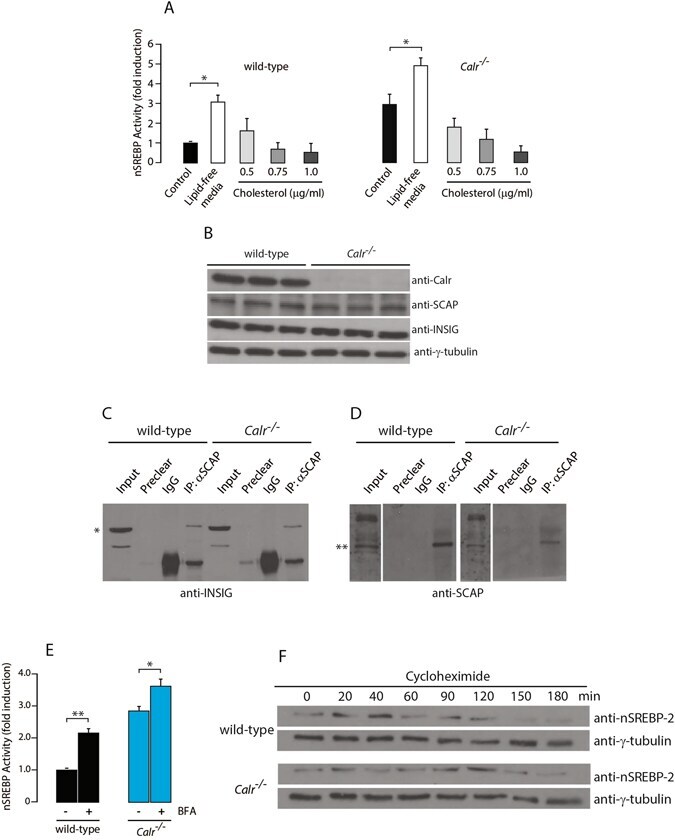
- Figure 3 SREBP complex in the absence of calreticulin. ( A ) nSREBP activity in wild-type ( left panel ) and Calr -/- ( right panel ) cells with normal media, lipid-free media and lipid-free media plus 0.5, 0.75, and 1.0 ug/ml of cholesterol. *Indicates statistically significant differences: wild-type cells with normal vs. lipid-free media, p -value < 0.05 (ANOVA); Calr -/- cells with normal vs. lipid-free media, p -value < 0.05 (ANOVA). Representative of 3 biological replicates. ( B ) Wild-type and Calr -/- cells were probed with anti-Calr, anti-SCAP and anti-INSIG antibodies. gamma-tubulin was used as a loading control. Representative of 3 biological replicates. ( C , D ) Immunoprecipitation ( IP ) assay was carried out on confluent wild-type and Calr -/- cells with anti-SCAP antibody. Immunoblot analysis was carried out with anti-INSIG ( C ) and anti-SCAP ( D ) antibodies. *Indicates the location of INSIG protein band. **indicates the location of SCAP protein band. Representative of 3 biological replicates. ( E ) nSREBP activity in wild-type and Calr -/- cells treated with Brefeldin A (BFA) (1 ug/ml). **Indicates statistically significant differences: wild-type vs. Calr -/- cells in control conditions, p -value = 0.0001 (Student's t-test); wild-type cells in control vs. BFA treatment, p -value = 0.0004 (Student's t-test). *Indicates statistically significant difference: Calr -/- cells in control vs. BFA treatment, p -value = 0.0331 (Student's t-test). Repres
- Submitted by
- Invitrogen Antibodies (provider)
- Main image

- Experimental details
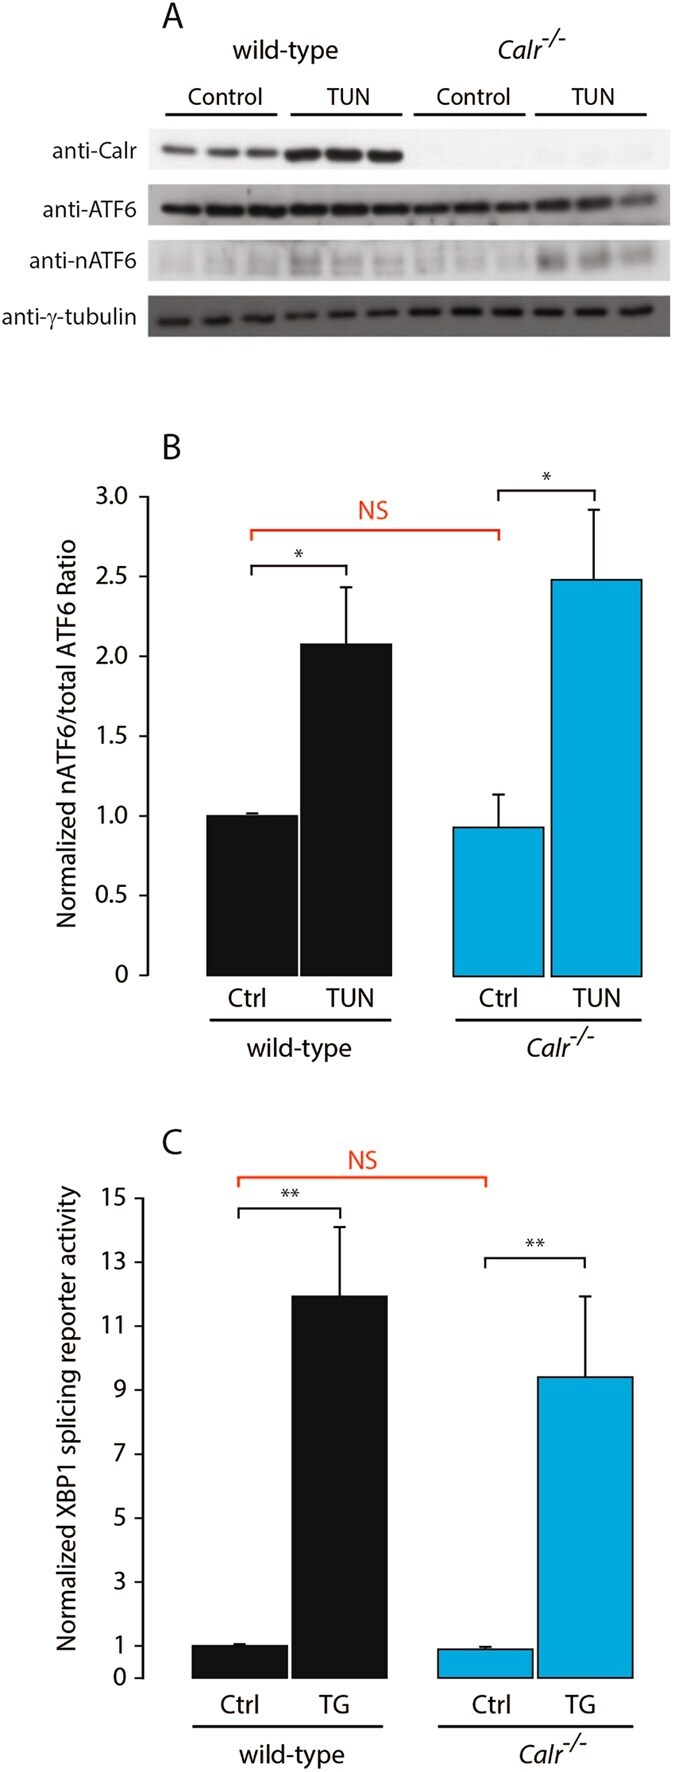
- Figure 4 Unfolded protein response (UPR) in Calr -/- cells. ( A ) Immunoblot analysis of wild-type and Calr -/- cells probed with anti-calreticulin (Calr), anti-ATF6, anti-nuclear ATF6 (nATF6) antibodies. gamma-tubulin was used as a loading control. Cells were treated without or with 5 ng/ml of tunicamycin (TUN). ( B ) Quantitative analysis of immunoblots showing the ratio of nuclear to total ATF6. *Indicates statistically significant differences: wild-type cells vs. wild-type cells treated with TUN, p -value = 0.0393 (Student's t-test); Calr -/- cells vs. Calr -/- cells treated with TUN, p -value = 0.0265 (Student's t-test). Representative of 3 biological replicates. NS, not significant. Ctrl, control. See ""Experimental Procedures"" for additional details. ( C ) XBP1-luciferase reporter activity in wild-type and Calr -/- cells and in cells treated without or with 1 uM thapsigargin (TG). **Indicates statistically significant differences: wild-type cells vs. wild-type cells treated with TG, p -value = 0.0005 (Student's t-test); Calr -/- cells vs. Calr -/- cells treated with TG, p -value = 0.0051 (Student's t-test). Representative of 6 biological replicates. NS, not significant. Ctrl, control. The images of ( A ) shown are cropped. The full-length gels/blots are shown in Fig. S10 . See ""Experimental Procedures"" for additional details.
- Submitted by
- Invitrogen Antibodies (provider)
- Main image

- Experimental details
- Fig. 4 PHF8 promotes resistance to anti-HER2 therapies in breast cancer cells through IL-6. a and b. RT-qPCR analysis of IL-6 expression. RPL13A mRNA served as the control. c and d. Human Cytokine Antibody Array blots probed with the media from the indicated cells. Western blotting was performed in duplicate, an ELISA was used to measure expression, and the regulated cytokines are marked. e . An ELISA was used to measure IL-6 secreted from HCC1954 cells with or without PHF8 knockdown; * p

- Submitted by
- Invitrogen Antibodies (provider)
- Main image

- Experimental details
- Figure 6 COX-2 peroxidase activity was needed to regulate the IRE1alpha arm of UPR. ( A ) Immunoblot analysis of HEK293 cells and HEK293 cells transfected with His-COX-2 or His-COX-2 H374Y expression vector with anti-His and anti-gamma-tubulin antibodies. Protein samples were separated on the same SDS-PAGE and the middle lane was removed for the sake of clarity. Quantitative analysis of the abundance of COX-2 and COX-2 mutant proteins is indicated in the graph (n = 4). ( B ) HEK293 ( HEK293 ) cells, and stably transfected COX-2 overexpressing HEK293 cells ( COX-2 OE ) or COX-2 H374Y mutant ( COX-2 H374Y ) were transfected with the IRE1alpha splicing reporter followed by treatment for 24 hours with 20 uM cyclosporine A (+ CsA ). *** p-value < 0.0006 (n = 8), **** p-value < 0.0001. (n = 8). ( C ) HEK293 cells, and HEK293 cells overexpressing COX-2 ( COX-2 OE ) or COX-2 H374Y mutant ( COX-2 H374Y ) were analyzed for COX-2 peroxidase activity. * p-value = 0.0309, *** p-value < 0.0003 (n = 20). ( D ) COX-2 peroxidase activity in kidneys from cyclosporine treated mice. * p-value = 0.0069 (n = 6). ( E ) Q-PCR quantitative analysis of spliced endogenous XBP1 in kidneys harvested from cyclosporine treated mice. * p - value < 0.0012 (n = 6). The images of ( A ) shown are cropped. The full-length gels/blots are shown in Suppl. Fig. S14 .
