Explore
 Validate
 Learn
Learn Western blot
 ELISA
ELISA Immunocytochemistry
Antibody data
- Antibody Data
- Antigen structure
- References [1]
- Comments [0]
- Validations
- Immunocytochemistry [2]
- Other assay [1]
Submit
Validation data
Reference
Comment
Report error
- Product number
- PA5-89957 - Provider product page

- Provider
- Invitrogen Antibodies
- Product name
- GDNF Polyclonal Antibody
- Antibody type
- Polyclonal
- Antigen
- Recombinant full-length protein
- Description
- Immunogen sequence: RGQRGKNRGC VLTAIHLNVT DLGLGYETKE ELIFRYCSGS CDAAETTYDK ILKNLSRNRR LVSDKVGQAC CRPIAFDDDL SFLDDNLVYH ILRKHSAKRC GCI; Positive Samples: Mouse brain, Mouse kidney, Rat brain
- Reactivity
- Human, Mouse, Rat
- Host
- Rabbit
- Isotype
- IgG
- Vial size
- 100 μL
- Concentration
- 2.02 mg/mL
- Storage
- -20°C, Avoid Freeze/Thaw Cycles
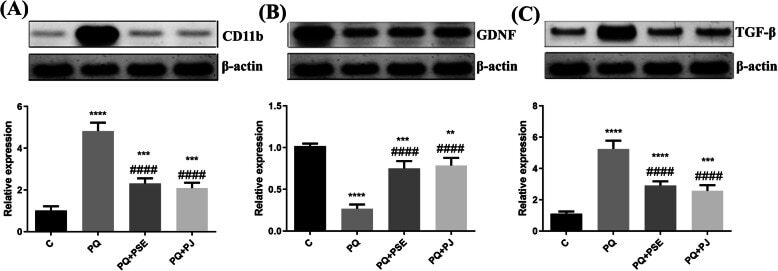
Submitted references Neuroprotective effects of pomegranate (Punica granatum L.) juice and seed extract in paraquat-induced mouse model of Parkinson's disease.
Fathy SM, El-Dash HA, Said NI
BMC complementary medicine and therapies 2021 Apr 26;21(1):130
BMC complementary medicine and therapies 2021 Apr 26;21(1):130
No comments: Submit comment
Supportive validation
- Submitted by
- Invitrogen Antibodies (provider)
- Main image
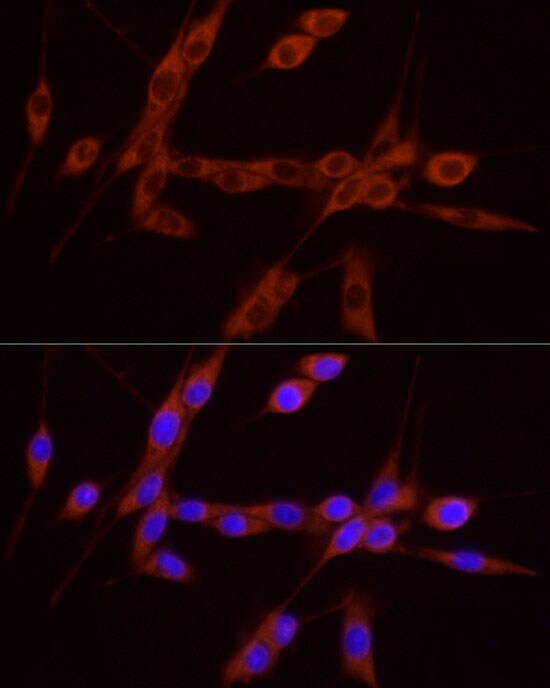
- Experimental details
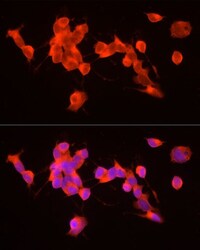
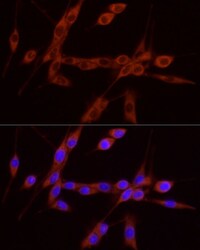
- Immunofluorescence analysis of GDNF in SH-SY5Y cells. Samples were incubated with GDNF Polyclonal antibody (Product # PA5-89957) using a dilution of 1:100 (40x lens). Blue: DAPI for nuclear staining.
- Submitted by
- Invitrogen Antibodies (provider)
- Main image
- Experimental details
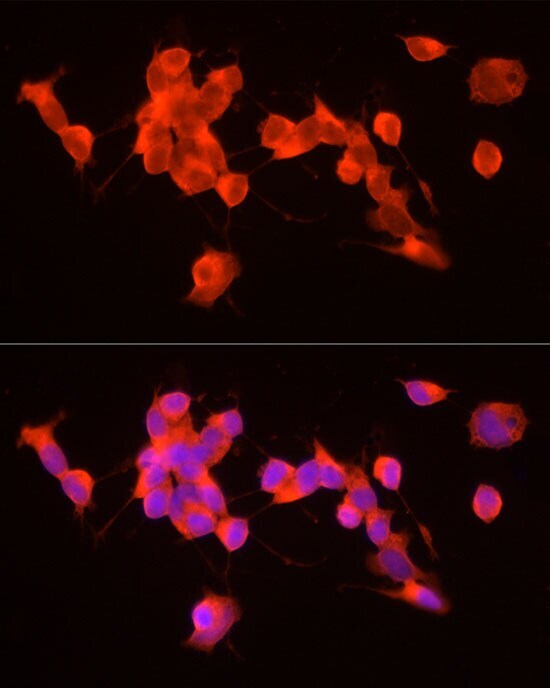
- Immunofluorescence analysis of GDNF in U-87MG cells. Samples were incubated with GDNF Polyclonal antibody (Product # PA5-89957) using a dilution of 1:100 (40x lens). Blue: DAPI for nuclear staining.
Supportive validation
- Submitted by
- Invitrogen Antibodies (provider)
- Main image

- Experimental details
- Fig. 7 Representative cropped blots with relative expression levels of the striatal CD11b, TGF-beta, and GDNF in different animal groups. The full length blots are presented in supplementary figure 3 . Relative expression of CD11b ( a ), GDNF ( b ), and TGF-beta ( c ) in striatum. C = control group; PQ = Paraquat (alone)-induced group; PQ+PSE = PQ-induced group treated with PSE; PQ+PJ = PQ-induced group treated with PJ. Data are expressed as mean +- S.D. of 10 mice in each group. **: P < 0.01, ***: P < 0.001, and ****: P < 0.0001 compared with control group; ####: P < 0.0001 compared with PQ group