 Explore
 Validate
 Learn
Learn Western blot
 Immunoprecipitation
Antibody data
- Antibody Data
- Antigen structure
- References [2]
- Comments [0]
- Validations
- Western blot [3]
- Immunocytochemistry [1]
- Other assay [2]
Submit
Validation data
Reference
Comment
Report error
- Product number
- MA1-10373 - Provider product page

- Provider
- Invitrogen Antibodies
- Product name
- HSP90 beta Monoclonal Antibody (MBH90B)
- Antibody type
- Monoclonal
- Antigen
- Synthetic peptide
- Description
- This antibody recognizes the EEVHHG epitope within the N-terminal part of Hsp90 beta, a ubiquitously expressed protein with calculated MW of 83.3 kDa which migrates, however, as a 90 kDa band under reducing SDS-PAGE conditions.
- Reactivity
- Human, Mouse, Bovine
- Host
- Mouse
- Isotype
- IgG
- Antibody clone number
- MBH90B
- Vial size
- 100 µg
- Concentration
- 1 mg/mL
- Storage
- 4° C, do not freeze
Submitted references Differential Regulation of Telomeric Complex by BCR-ABL1 Kinase in Human Cellular Models of Chronic Myeloid Leukemia-From Single Cell Analysis to Next-Generation Sequencing.
Remifentanil preconditioning protects against hypoxia-induced senescence and necroptosis in human cardiac myocytes in vitro.
Deregowska A, Pepek M, Pruszczyk K, Machnicki MM, Wnuk M, Stoklosa T
Genes 2020 Sep 29;11(10)
Genes 2020 Sep 29;11(10)
Remifentanil preconditioning protects against hypoxia-induced senescence and necroptosis in human cardiac myocytes in vitro.
Lewinska A, Adamczyk-Grochala J, Bloniarz D, Horeczy B, Zurek S, Kurowicki A, Woloszczuk-Gebicka B, Widenka K, Wnuk M
Aging 2020 Jun 25;12(14):13924-13938
Aging 2020 Jun 25;12(14):13924-13938
No comments: Submit comment
Supportive validation
- Submitted by
- Invitrogen Antibodies (provider)
- Main image

- Experimental details
- Western blotting analysis of MBH90B reactivity with various cell lines and recombinant Hsp90 alpha and Hsp90 beta protein.

- Submitted by
- Invitrogen Antibodies (provider)
- Main image

- Experimental details
- Western blotting analysis of MBH90B Monoclonal antibody (Product # MA1-10373) reactivity with MCF-7, ARN8, SK-BR-3, T-474, MDA-MB-231, MDA-MB-468, T-47D, H1299, BT-549, and H12994 cell lines and recombinant Hsp90 alpha and Hsp90 beta protein.

- Submitted by
- Invitrogen Antibodies (provider)
- Main image

- Experimental details
- Western blot analysis was performed on whole cell extracts (30 µg lysate) of A-431 (Lane 1), U-87 MG (Lane 2), HEK 293T (Lane 3), HeLa (Lane 4), K-562 (Lane 5) and NIH/3T3 (Lane 6). The blot was probed with Anti-HSP90 beta Monoclonal Antibody (MBH90B) (Product # MA1-10373, 1µg/ml dilution) and detected by chemiluminescence using Goat anti-Mouse IgG (H+L) Superclonal™ Secondary Antibody, HRP conjugate (Product # A28177, 0.25 µg/ml, 1:4000 dilution). A 80 kDa band corresponding to HSP90 beta was observed across the cell lines tested.

Supportive validation
- Submitted by
- Invitrogen Antibodies (provider)
- Main image

- Experimental details
- Immunofluorescence analysis of HSP90 beta was performed using 70% confluent log phase HeLa cells. The cells were fixed with 4% paraformaldehyde for 10 minutes, permeabilized with 0.1% Triton™ X-100 for 15 minutes, and blocked with 1% BSA for 1 hour at room temperature. The cells were labeled with HSP90 beta Monoclonal Antibody (MBH90B) (Product # MA1-10373) at 1 µg/mL in 0.1% BSA, incubated at 4 degree Celsius overnight and then labeled with Goat anti-Rabbit IgG (H+L) Superclonal™ Secondary Antibody, Alexa Fluor® 488 conjugate (Product # A27034) at a dilution of 1:2000 for 45 minutes at room temperature (Panel a: green). Nuclei (Panel b: blue) were stained with SlowFade® Gold Antifade Mountant with DAPI (Product # S36938). F-actin (Panel c: red) was stained with Rhodamine Phalloidin (Product # R415, 1:300). Panel d represents the merged image showing cytoplasmic localization. Panel e represents control cells with no primary antibody to assess background. The images were captured at 60X magnification.

Supportive validation
- Submitted by
- Invitrogen Antibodies (provider)
- Main image

- Experimental details
- Figure 3 Telomere length is associated with enzymatic activity of telomerase and with expression/gene copy number of TERT/TERC in BCR/ABL1 -positive cell lines. ( a ) Representative images of nuclei and/or metaphase plates with TERT/TERC probe. Nuclei were counterstained by DAPI. Fluorescent signals were visualized under the Olympus BX61 and MetaSystem Isis software with objective 40x; ( b ) RT-qPCR analysis of TERT/TERC normalized to beta2M and GUSB expression; ( c ) Western blot analysis of TERT protein levels. For the loading control, the antibody against beta-actin was used; ( d ) PCR-ELISA measurement of telomerase activity. The bars indicate SD, n = 2, * p < 0.05, ** p < 0.01 (ANOVA and Tukey's a posteriori test); ( e ) Western blotting analysis of HSP70 and HSP90. For the loading control, beta-actin was used.

- Submitted by
- Invitrogen Antibodies (provider)
- Main image
- Experimental details
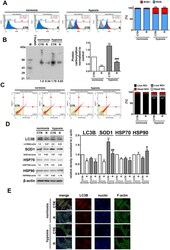
- Figure 3 Hypoxia-induced oxidative stress ( A, B ), nitrosative stress ( C ), adaptive oxidative stress, heat shock/chaperone and autophagy-based responses ( D, E ), and the effect of remifentanil preconditioning in HCM cells. ( A ) Superoxide levels were measured using Muse (r) Cell Analyzer and Muse (r) Oxidative Stress Kit. Representative histograms are presented. ( B ) Protein carbonylation was investigated using OxyBlot (tm) Protein Oxidation Detection Kit. A negative control without DNPH derivatization (lane DNPH(-)) and a positive control with a mixture of standard proteins with attached DNP residues (lane M) are also shown. The levels of oxidative protein damage were normalized and protein carbonylation during normoxic control conditions was considered as 1. ( C ) Nitric oxide levels were investigated using Muse (r) Cell Analyzer and Muse (r) Nitric Oxide Kit. Representative dot-plots are also shown. ( D ) Western blot analysis of the levels of LC3B, SOD1, HSP70 and HSP90. Data were normalized to beta-actin. ( E ) Immunofluorescence analysis of cellular localization of LC3B (red). Representative microphotographs are shown, objective 10x, scale bars 15 mum. F-actin staining (green) and nucleus staining (blue) were also considered. Bars indicate SD, n = 3, *** p < 0.001, ** p < 0.01, * p < 0.05 compared to normoxic control (CTR), ### p < 0.001, ## p < 0.01, # p < 0.05 compared to hypoxic control (CTR) (ANOVA and Dunnett's a posteriori test). CTR, control; R, remifentani
