Explore
 Validate
 Learn
LearnPA5-20670
antibody from Invitrogen Antibodies
Targeting: IL16
FLJ16806, FLJ42735, HsT19289, IL-16, LCF, prIL-16
 Western blot
 Immunocytochemistry
Antibody data
- Antibody Data
- Antigen structure
- References [1]
- Comments [0]
- Validations
- Immunocytochemistry [1]
- Immunohistochemistry [2]
- Other assay [2]
Submit
Validation data
Reference
Comment
Report error
- Product number
- PA5-20670 - Provider product page

- Provider
- Invitrogen Antibodies
- Product name
- IL-16 Polyclonal Antibody
- Antibody type
- Polyclonal
- Antigen
- Synthetic peptide
- Description
- A suggested positive control is rat brain tissue lysate. PA5-20670 can be used with blocking peptide PEP-0788.
- Reactivity
- Human, Mouse, Rat
- Host
- Rabbit
- Isotype
- IgG
- Vial size
- 100 μg
- Concentration
- 1 mg/mL
- Storage
- Maintain refrigerated at 2-8°C for up to 3 months. For long term storage store at -20°C
Submitted references Increased Levels of IL-16 in the Central Nervous System during Neuroinflammation Are Associated with Infiltrating Immune Cells and Resident Glial Cells.
Hridi SU, Barbour M, Wilson C, Franssen AJ, Harte T, Bushell TJ, Jiang HR
Biology 2021 May 27;10(6)
Biology 2021 May 27;10(6)
No comments: Submit comment
Supportive validation
- Submitted by
- Invitrogen Antibodies (provider)
- Main image
- Experimental details
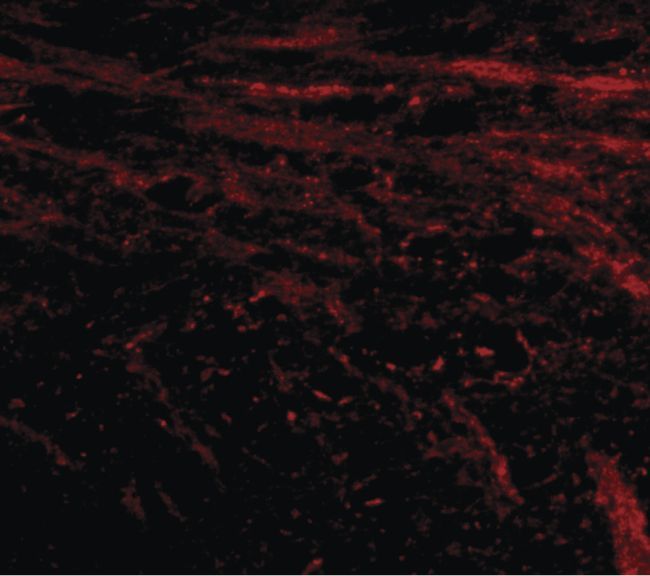
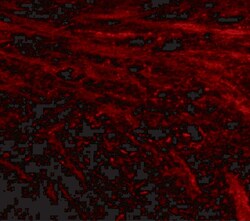
- Immunofluorescent analysis of mouse brain tissue using a IL-16 polyclonal antibody (Product # PA5-20670) at a 20 µg/mL dilution.
Supportive validation
- Submitted by
- Invitrogen Antibodies (provider)
- Main image
- Experimental details
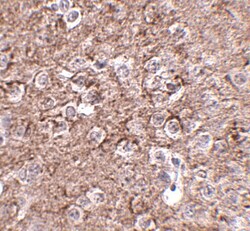
- Immunohistochemistry of IL-16 in mouse brain tissue with IL-16 Polyclonal Antibody (Product # PA5-20670) at 2.5 µg/mL.

- Submitted by
- Invitrogen Antibodies (provider)
- Main image
- Experimental details
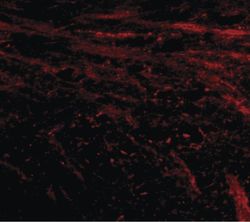
- Immunofluorescence of IL-16 in mouse brain tissue with IL-16 Polyclonal Antibody (Product # PA5-20670) at 20 µg/mL.

Supportive validation
- Submitted by
- Invitrogen Antibodies (provider)
- Main image
- Experimental details
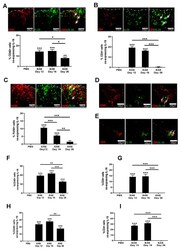
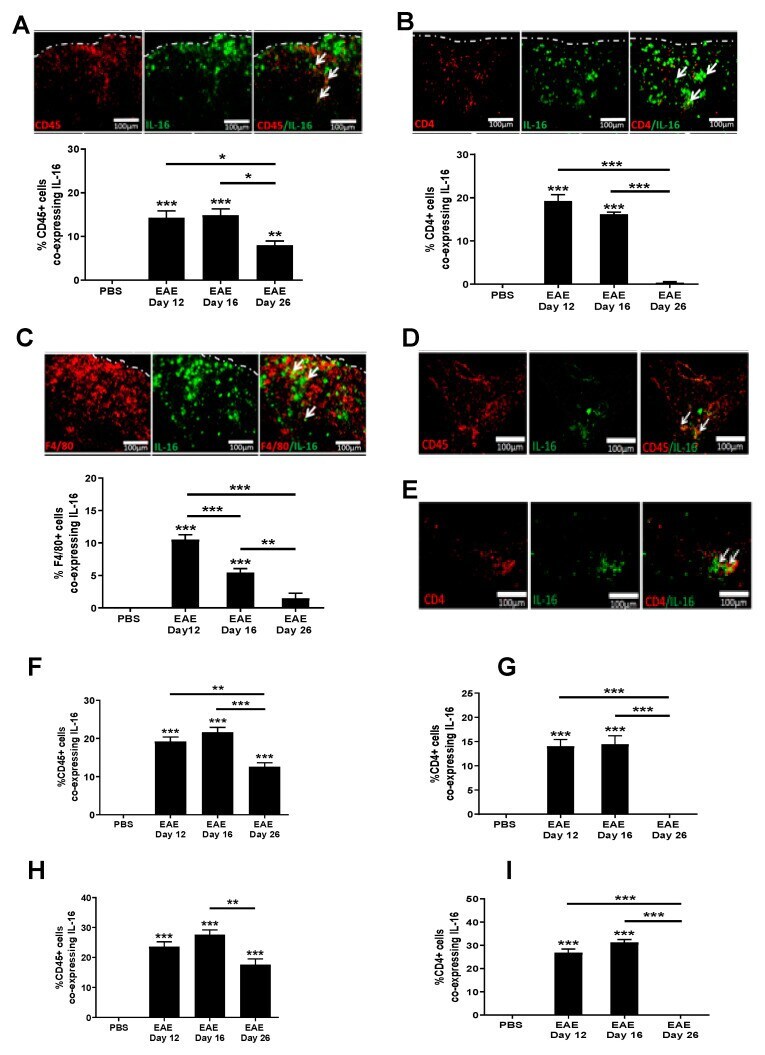
- Figure 4 Expression of IL-16 by infiltrating immune cells in EAE mice. Spinal cord and brains were harvested from EAE and PBS control mice. Tissue was co-stained with IL-16 (green) and CD45, CD4, or F4/80 (all red). Representative images of spinal cord ( A - C ), cerebellum ( D ) and hippocampus ( E ) tissues are shown. Dotted white lines indicate spinal cord section edges. White arrows indicate areas of colocalization. Percentage of double-positive cells in each group within the spinal cord ( A - C ), hippocampus ( F , G ) and cerebellum ( H , I ) were quantified with results expressed as the mean +- SEM. N = 5. Statistical significance was determined by one-way ANOVA with Bonferroni post hoc tests. * p < 0.05, ** p < 0.01, *** p < 0.001 versus PBS or comparison groups are indicated by the bar lines.
- Submitted by
- Invitrogen Antibodies (provider)
- Main image
- Experimental details
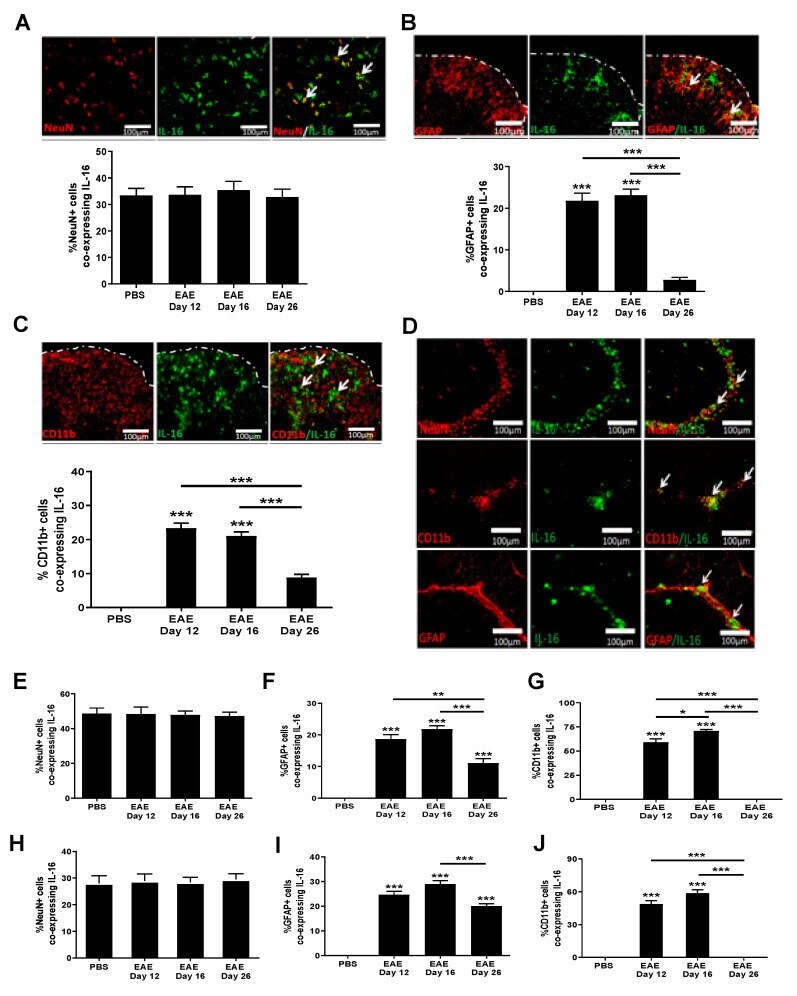
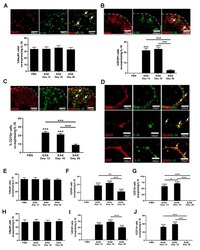
- Figure 5 Expression of IL-16 by CNS resident cells in EAE mice. Spinal cord and brain tissues were harvested from EAE and PBS control mice and stained with IL-16 (green) together with NeuN, GFAP or CD11b (all red). Representative images of spinal cord ( A - C ) and hippocampus ( D ) tissues are shown. Dotted white lines indicate tissue section edges. White arrows indicate areas of colocalisation. Percentage of double-positive cells in each group within either the spinal cord ( A - C ) or hippocampus ( E - G ) and cerebellum ( H - J ) was quantified with results expressed as the mean +- SEM. N = 5. Statistical significance was determined by one-way ANOVA with Bonferroni post hoc tests. * p < 0.05, ** p < 0.01, *** p < 0.001 versus PBS or comparison groups are indicated by the bar lines.