 Explore
 Validate
 Learn
Learn Western blot
 Immunocytochemistry
Antibody data
- Antibody Data
- Antigen structure
- References [4]
- Comments [0]
- Validations
- Immunocytochemistry [1]
- Flow cytometry [1]
- Other assay [2]
Submit
Validation data
Reference
Comment
Report error
- Product number
- PA1-1054 - Provider product page

- Provider
- Invitrogen Antibodies
- Product name
- Phospho-IRS1 (Ser307) Polyclonal Antibody
- Antibody type
- Polyclonal
- Antigen
- Synthetic peptide
- Description
- PA1-1054 detects phosphorylated IRS-1 (Ser307) in mouse and human cells. PA1-1054 has been successfully used in Western Blot procedures. By WB, this antibody detects an ~170 kDa protein representing phospho-IRS-1 (Ser307) from 3T3 L1 cells treated with insulin for 10 minutes. The PA1-1054 immunogen is a synthetic phosphopeptide corresponding to residues E(301) S I T A T (pS) P A S M V G G K(315) of human IRS-1. This peptide is 100% conserved in rats and mice. This peptide (Cat. #PEP-184) is available for use in neutralization and control experiments.
- Reactivity
- Human, Mouse
- Host
- Rabbit
- Isotype
- IgG
- Vial size
- 100 µg
- Concentration
- 1 mg/mL
- Storage
- -20° C, Avoid Freeze/Thaw Cycles
Submitted references The E3 ubiquitin-protein ligase Trim31 alleviates non-alcoholic fatty liver disease by targeting Rhbdf2 in mouse hepatocytes.
Mesenchymal stem cell conditioned medium ameliorates diabetic serum-induced insulin resistance in 3T3-L1 cells.
Enhanced gastrointestinal expression of cytosolic malic enzyme (ME1) induces intestinal and liver lipogenic gene expression and intestinal cell proliferation in mice.
The hyperglycemia-induced inflammatory response in adipocytes: the role of reactive oxygen species.
Xu M, Tan J, Dong W, Zou B, Teng X, Zhu L, Ge C, Dai X, Kuang Q, Zhong S, Lai L, Yi C, Tang T, Zhao J, Wang L, Liu J, Wei H, Sun Y, Yang Q, Li Q, Lou D, Hu L, Liu X, Kuang G, Luo J, Xiong M, Feng J, Zhang C, Wang B
Nature communications 2022 Feb 25;13(1):1052
Nature communications 2022 Feb 25;13(1):1052
Mesenchymal stem cell conditioned medium ameliorates diabetic serum-induced insulin resistance in 3T3-L1 cells.
Sanap A, Bhonde R, Joshi K
Chronic diseases and translational medicine 2021 Mar;7(1):47-56
Chronic diseases and translational medicine 2021 Mar;7(1):47-56
Enhanced gastrointestinal expression of cytosolic malic enzyme (ME1) induces intestinal and liver lipogenic gene expression and intestinal cell proliferation in mice.
Al-Dwairi A, Brown AR, Pabona JM, Van TH, Hamdan H, Mercado CP, Quick CM, Wight PA, Simmen RC, Simmen FA
PloS one 2014;9(11):e113058
PloS one 2014;9(11):e113058
The hyperglycemia-induced inflammatory response in adipocytes: the role of reactive oxygen species.
Lin Y, Berg AH, Iyengar P, Lam TK, Giacca A, Combs TP, Rajala MW, Du X, Rollman B, Li W, Hawkins M, Barzilai N, Rhodes CJ, Fantus IG, Brownlee M, Scherer PE
The Journal of biological chemistry 2005 Feb 11;280(6):4617-26
The Journal of biological chemistry 2005 Feb 11;280(6):4617-26
No comments: Submit comment
Supportive validation
- Submitted by
- Invitrogen Antibodies (provider)
- Main image
- Experimental details
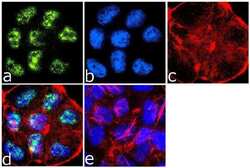
- Immunofluorescence analysis of Phospho-IRS1 pSer307 was done on 70% confluent log phase T-47D cells. The cells were fixed with 4% paraformaldehyde for 15 minutes, permeabilized with 0.25% Triton™ X-100 for 10 minutes, and blocked with 5% BSA for 1 hour at room temperature. The cells were labeled with Phospho-IRS1 pSer307 Rabbit Polyclonal Antibody (Product # PA1-1054) at 1 µg/mL in 1% BSA and incubated for 3 hours at room temperature and then labeled with Goat anti-Rabbit IgG (H+L) Superclonal™ Secondary Antibody, Alexa Fluor® 488 conjugate (Product # A27034) at a dilution of 1:2000 for 45 minutes at room temperature (Panel a: green). Nuclei (Panel b: blue) were stained with SlowFade® Gold Antifade Mountant with DAPI (Product # S36938). F-actin (Panel c: red) was stained with Alexa Fluor® 555 Rhodamine Phalloidin (Product # R415, 1:300). Panel d is a merged image showing Nuclear localization. Panel e is a no primary antibody control. The images were captured at 60X magnification.
Supportive validation
- Submitted by
- Invitrogen Antibodies (provider)
- Main image
- Experimental details
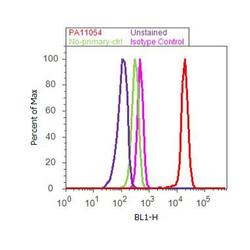
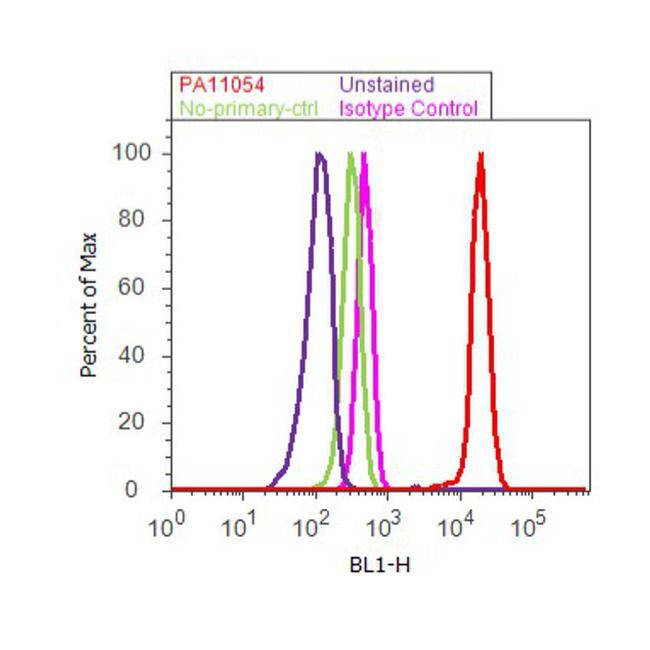
- Flow cytometry analysis of IRS1 [pS307] was done on MCF7 cells treated with IGF1 (100 ng/ml for 10 minutes). Cells were fixed with 70% ethanol for 10 minutes, permeabilized with 0.25% Triton™ X-100 for 20 minutes, and blocked with 5% BSA for 30 minutes at room temperature. Cells were labeled with IRS1 [pS307] Rabbit Polyclonal Antibody (PA11054, red histogram) or with rabbit isotype control (pink histogram) at 3-5 ug/million cells in 2.5% BSA. After incubation at room temperature for 2 hours, the cells were labeled with Alexa Fluor® 488 Goat Anti-Rabbit Secondary Antibody (A11008) at a dilution of 1:400 for 30 minutes at room temperature. The representative 10,000 cells were acquired and analyzed for each sample using an Attune® Acoustic Focusing Cytometer. The purple histogram represents unstained control cells and the green histogram represents no-primary-antibody control.
Supportive validation
- Submitted by
- Invitrogen Antibodies (provider)
- Main image
- Experimental details
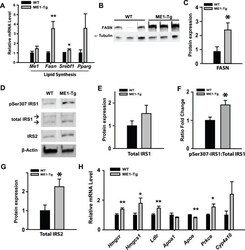
- Figure 5 Expression of lipogenic pathway and cholesterol synthesis pathway genes in livers of WT and ME1-Tg mice fed HF diet. A) qRT-PCR analysis of major lipogenic pathway genes in livers of WT and ME1-Tg mice fed HF diet (Exp. 2; n = 8-9/group). B) Western blot of FASN protein in livers of WT and ME1-Tg mice fed HF diet. C) Densitometric analysis of immunoreactive bands in (B) relative to alpha-Tubulin protein. D) Western blot of IRS1, pSer307-IRS1, and IRS2 in livers of WT and ME1-Tg mice fed HF diet (n = 5/group). E-G) Densitometric analysis of immunoreactive bands of total liver IRS1 (E) and IRS2 (G) and the relative ratio of immunoreactive pSer307-IRS1/total IRS1 band densities (F). H) mRNA expression of select cholesterol synthesis- and cholesterol uptake-related genes in the livers of WT and ME1-Tg mice (Exp. 2; n = 8-9/group). qRT-PCR reactions were repeated twice in all experiments (A, H). Bar graphs represent mean +- SEM. Significant differences at * P
- Submitted by
- Invitrogen Antibodies (provider)
- Main image
- Experimental details
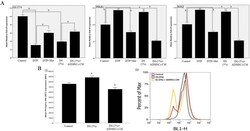
- Fig. 5 mRNA expression of GLUT4, PPARgamma, and IKKbeta in 3T3-L1 cells by using reverse transcription polymerase chain reaction (RT-PCR) (A): Adipose derived mesenchymal stem cells conditioned medium (ADMSC-CM) restored diabetic serum (DS) induced decrease in GLUT4 expression ( P < 0.05); ADMSC-CM treatment also restored DS induced increase in PPARgamma and IKKbeta expression. Data shown are mean +- SD. All the experiment were performed in triplicates ( a P < 0.05, b P < 0.01). The expression of phosphorylated insulin receptor substrate 1 (Phospho IRS-1307) in 3T3-L1 cells by using fluorescence activated cell sorting (FACS) (B): (i) DS (5%) upregulated phospho-IRS (307) protein levels (Median Fluorescence Intensity) where ADMSCs-CM reversed DS mediated change in phospho-IRS (307) protein expression. Data represent mean +- SD. All the experiments were performed in triplicates ( a P < 0.05, b P < 0.01). (ii) Histogram representing percentage of cells treated with Control, DS (5%), and DS (5%) + ADMSC-CM. Data shown are from one of the three experiments performed. Fig. 5
