Explore
 Validate
 Learn
Learn Western blot
 Immunocytochemistry
Antibody data
- Antibody Data
- Antigen structure
- References [2]
- Comments [0]
- Validations
- Immunocytochemistry [2]
- Flow cytometry [1]
- Chromatin Immunoprecipitation [2]
- Other assay [1]
Submit
Validation data
Reference
Comment
Report error
- Product number
- 720035 - Provider product page

- Provider
- Invitrogen Antibodies
- Product name
- JunD Polyclonal Antibody
- Antibody type
- Polyclonal
- Antigen
- Synthetic peptide
- Description
- This antibody is predicted to react with Dog, Bovine and Pig.
- Reactivity
- Human
- Host
- Rabbit
- Isotype
- IgG
- Vial size
- 100 μg
- Concentration
- 0.5 mg/mL
- Storage
- Store at 4°C short term. For long term storage, store at -20°C, avoiding freeze/thaw cycles.
Submitted references IL-2/IL-7-inducible factors pioneer the path to T cell differentiation in advance of lineage-defining factors.
TPC2-mediated Ca(2+) signaling is required for axon extension in caudal primary motor neurons in zebrafish embryos.
Bevington SL, Keane P, Soley JK, Tauch S, Gajdasik DW, Fiancette R, Matei-Rascu V, Willis CM, Withers DR, Cockerill PN
The EMBO journal 2020 Nov 16;39(22):e105220
The EMBO journal 2020 Nov 16;39(22):e105220
TPC2-mediated Ca(2+) signaling is required for axon extension in caudal primary motor neurons in zebrafish embryos.
Guo C, Webb SE, Chan CM, Miller AL
Journal of cell science 2020 Jul 10;133(13)
Journal of cell science 2020 Jul 10;133(13)
No comments: Submit comment
Supportive validation
- Submitted by
- Invitrogen Antibodies (provider)
- Main image
- Experimental details
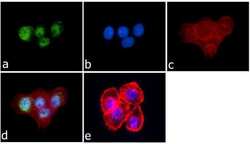
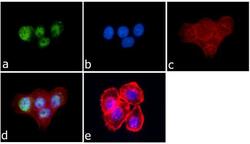
- Immunofluorescence was performed on fixed and permeabilized A-431cells for detection of JunD using Anti-JunD Rabbit Polyclonal Antibody (Product # 720035, 2 µg/mL) and labeled with Goat anti-Rabbit IgG (H+L) Superclonal Secondary Antibody, Alexa Fluor® 488 conjugate (Product # A27034, 0.4 µg/mL, 1:2500). Panel a) shows representative cells that were stained for detection and localization of JunD protein (green), Panel b) is stained for nuclei (blue) using SlowFade® Gold Antifade Mountant with DAPI (Product # S36938, 1:50). Panel c) represents cytoskeletal F-actin staining using Alexa Fluor® 594 Phalloidin (Product # A12381, 1:200). Panel d) is a composite image of Panels a, b and c clearly demonstrating nuclear localization of JunD. Panel e) represents control cells with no primary antibody to assess background.
- Submitted by
- Invitrogen Antibodies (provider)
- Main image
- Experimental details
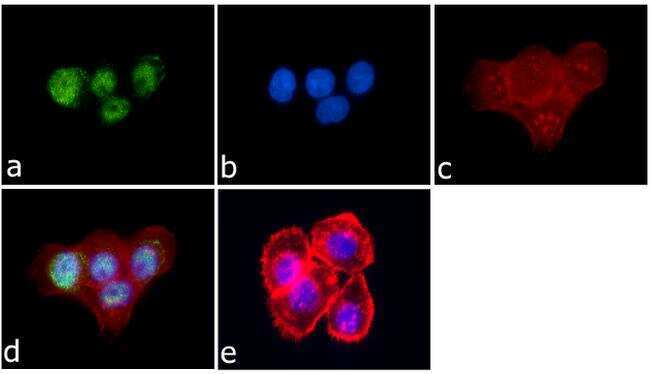
- Immunofluorescence was performed on fixed and permeabilized A-431cells for detection of JunD using Anti-JunD Rabbit Polyclonal Antibody (Product # 720035, 2 µg/mL) and labeled with Goat anti-Rabbit IgG (Heavy Chain) Superclonal Secondary Antibody, Alexa Fluor® 488 conjugate (Product # A27034, 0.4 µg/mL, 1:2500). Panel a) shows representative cells that were stained for detection and localization of JunD protein (green), Panel b) is stained for nuclei (blue) using SlowFade® Gold Antifade Mountant with DAPI (Product # S36938, 1:50). Panel c) represents cytoskeletal F-actin staining using Alexa Fluor® 594 Phalloidin (Product # A12381, 1:200). Panel d) is a composite image of Panels a, b and c clearly demonstrating nuclear localization of JunD. Panel e) represents control cells with no primary antibody to assess background.

Supportive validation
- Submitted by
- Invitrogen Antibodies (provider)
- Main image
- Experimental details
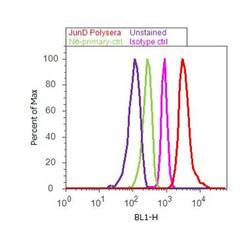
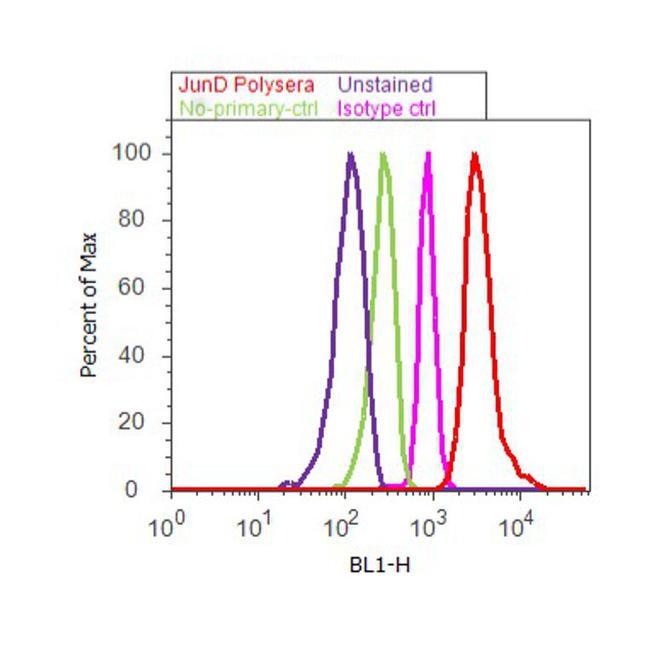
- Flow Cytometry analysis of JunD was performed on HeLa cells labeled with Anti-JunD Rabbit Polyclonal Antibody (Product# 720035, 2-4 ug/ 1M cells) or with rabbit isotype control and detected with Goat anti-Rabbit IgG (H+L) Superclonalª Secondary Antibody, Alexa Fluor¨ 488 conjugate (Product # A27034, 0.4 ug/ml, 1:2500) as represented by the red and pink histograms respectively. The purple histogram represents unstained control cells and the green histogram represents no-primary-antibody control. A representative 10,000 cells were acquired and analyzed for each sample using an Attune¨ Acoustic Focusing Cytometer (4468770).
Supportive validation
- Submitted by
- Invitrogen Antibodies (provider)
- Main image

- Experimental details
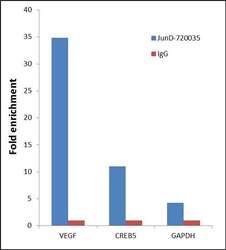
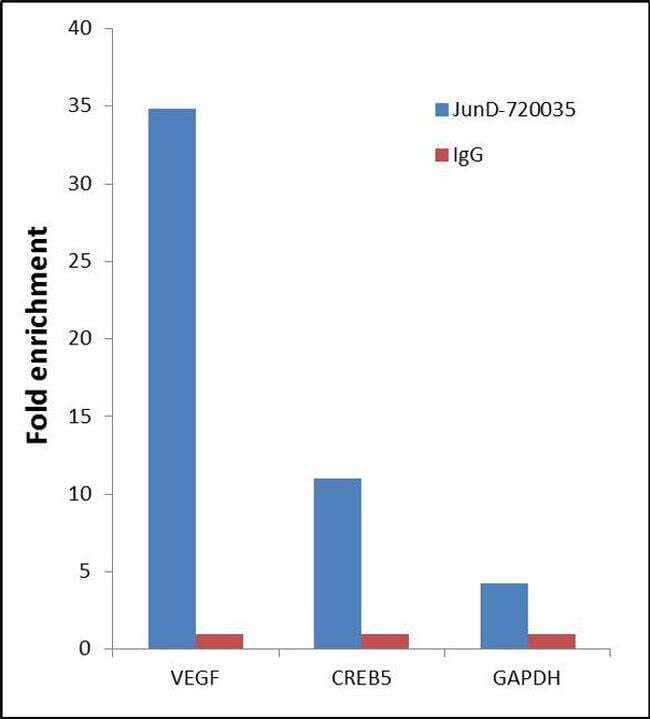
- Chromatin Immunoprecipitation (ChIP) was performed using Anti-JunD Rabbit Polyclonal Antibody (Product # 720035, 5 µg) on sheared chromatin from 2 million HeLa cells (serum starved for 24 hours and serum released for 2 hours) using the "MAGnify ChIP system" kit (Product # 49-2024). Normal Rabbit IgG was used as a negative IP control. The purified DNA was analyzed by 7500 Fast qPCR system (Product # 4351106) with optimized PCR primer pairs for the promoters of the active VEGF, CREB5 genes, used as positive control target gene, and the promoter region of the GAPDH, used as negative control target gene. Data is presented as fold enrichment of the antibody signal versus the negative control IgG using the comparative CT method.

- Submitted by
- Invitrogen Antibodies (provider)
- Main image
- Experimental details
- Chromatin Immunoprecipitation (ChIP) was performed using Anti-JunD Rabbit Polyclonal Antibody (Product # 720035, 5 µg) on sheared chromatin from 2 million HeLa cells (serum starved for 24 hours and serum released for 2 hours) using the "MAGnify ChIP system" kit (Product # 49-2024). Normal Rabbit IgG was used as a negative IP control. The purified DNA was analyzed by 7500 Fast qPCR system (Product # 4351106) with optimized PCR primer pairs for the promoters of the active VEGF, CREB5 genes, used as positive control target gene, and the promoter region of the GAPDH, used as negative control target gene. Data is presented as fold enrichment of the antibody signal versus the negative control IgG using the comparative CT method.
Supportive validation
- Submitted by
- Invitrogen Antibodies (provider)
- Main image
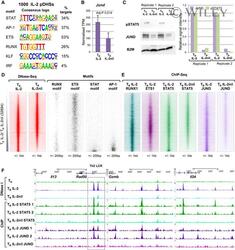
- Experimental details
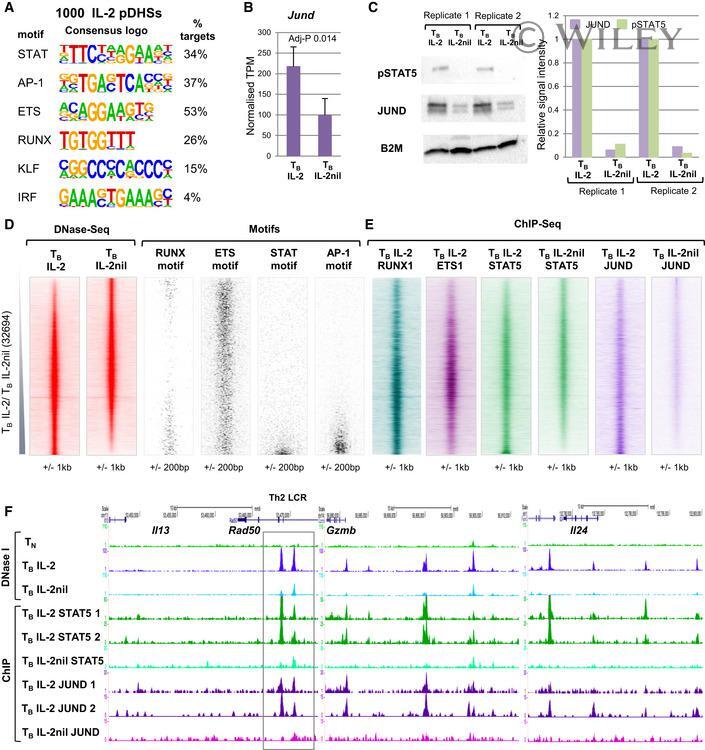
- 3 Figure IL-2 pDHSs bind IL-2 regulated factors De novo identification of DNA consensus motifs enriched in the 1,000 IL-2 pDHSs determined by HOMER. Jund mRNA levels in T B IL-2 and T B IL-2nil. Standard deviation is shown from the mean of 3 samples. P -values were calculated from the RNA-Seq data using Limma with Benjamini-Hochberg correction for multiple testing. Western blot analyses showing JUND and pSTAT5 protein levels in T B IL-2 and T B IL-2nil (left panel) with the signal calculated from 2 replicates relative to T B IL-2 in the right panel. DNA motif density plots (right) showing the location of binding motifs for RUNX, ETS, STAT, and AP-1 transcription factors at the 32,694 DHSs detected in T B IL-2 and T B IL-2nil, as depicted in Fig 2A, ordered according to fold enrichment of DNase-Seq tag counts in T B IL-2 compared to T B IL-2nil (left). DNA sequence tag density plots from ChIP-Seq assays of RUNX1, ETS1, STAT5, and JUND in T B IL-2, and STAT5 and JUND in T B IL-2nil ordered as in (D). UCSC genome browser tracks at the Il13/Il4/Il5 Th2 cytokine locus LCR (indicated by the gray box within the Rad50 gene), Gzmb and Il24 showing DNase-Seq and ChIP-Seq for STAT5 and JUND in T B IL-2 and T B IL-2nil. Replicate JUND and STAT5 ChIP-Seq tracks are shown for T B IL-2.