 Explore
 Validate
 Learn
Learn Western blot
 Immunohistochemistry
Antibody data
- Antibody Data
- Antigen structure
- References [5]
- Comments [0]
- Validations
- Immunohistochemistry [5]
- Other assay [7]
Submit
Validation data
Reference
Comment
Report error
- Product number
- MA1-06103 - Provider product page

- Provider
- Invitrogen Antibodies
- Product name
- Lamin B1 Monoclonal Antibody (119D5-F1)
- Antibody type
- Monoclonal
- Antigen
- Purifed from natural sources
- Description
- MA1-06103 detects lamin B in human, mouse, rat, bovine, ovine, rabbit, zebrafish, and canine samples. MA1-06103 has sucessfully been used in immunocytochemistry, immunohistochemistry, ELISA, and flow cytometry procedures. The MA1-06103 immunogen is purified rat liver lamins.
- Reactivity
- Human, Mouse, Rat, Bovine, Canine, Rabbit, Zebrafish
- Host
- Mouse
- Isotype
- IgG
- Antibody clone number
- 119D5-F1
- Vial size
- 100 µL
- Concentration
- 1 mg/mL
- Storage
- Store at 4°C short term. For long term storage, store at -20°C, avoiding freeze/thaw cycles.
Submitted references Alpha-Synuclein Preformed Fibrils Induce Cellular Senescence in Parkinson's Disease Models.
MacroH2A histone variants maintain nuclear organization and heterochromatin architecture.
Immunoregulatory Protein B7-H3 Reprograms Glucose Metabolism in Cancer Cells by ROS-Mediated Stabilization of HIF1α.
Comparative 2D-DIGE proteomic analysis of bovine mammary epithelial cells during lactation reveals protein signatures for lactation persistency and milk yield.
Receptor tyrosine kinase ErbB2 translocates into mitochondria and regulates cellular metabolism.
Verma DK, Seo BA, Ghosh A, Ma SX, Hernandez-Quijada K, Andersen JK, Ko HS, Kim YH
Cells 2021 Jul 5;10(7)
Cells 2021 Jul 5;10(7)
MacroH2A histone variants maintain nuclear organization and heterochromatin architecture.
Douet J, Corujo D, Malinverni R, Renauld J, Sansoni V, Posavec Marjanović M, Cantariño N, Valero V, Mongelard F, Bouvet P, Imhof A, Thiry M, Buschbeck M
Journal of cell science 2017 May 1;130(9):1570-1582
Journal of cell science 2017 May 1;130(9):1570-1582
Immunoregulatory Protein B7-H3 Reprograms Glucose Metabolism in Cancer Cells by ROS-Mediated Stabilization of HIF1α.
Lim S, Liu H, Madeira da Silva L, Arora R, Liu Z, Phillips JB, Schmitt DC, Vu T, McClellan S, Lin Y, Lin W, Piazza GA, Fodstad O, Tan M
Cancer research 2016 Apr 15;76(8):2231-42
Cancer research 2016 Apr 15;76(8):2231-42
Comparative 2D-DIGE proteomic analysis of bovine mammary epithelial cells during lactation reveals protein signatures for lactation persistency and milk yield.
Janjanam J, Singh S, Jena MK, Varshney N, Kola S, Kumar S, Kaushik JK, Grover S, Dang AK, Mukesh M, Prakash BS, Mohanty AK
PloS one 2014;9(8):e102515
PloS one 2014;9(8):e102515
Receptor tyrosine kinase ErbB2 translocates into mitochondria and regulates cellular metabolism.
Ding Y, Liu Z, Desai S, Zhao Y, Liu H, Pannell LK, Yi H, Wright ER, Owen LB, Dean-Colomb W, Fodstad O, Lu J, LeDoux SP, Wilson GL, Tan M
Nature communications 2012;3:1271
Nature communications 2012;3:1271
No comments: Submit comment
Supportive validation
- Submitted by
- Invitrogen Antibodies (provider)
- Main image

- Experimental details
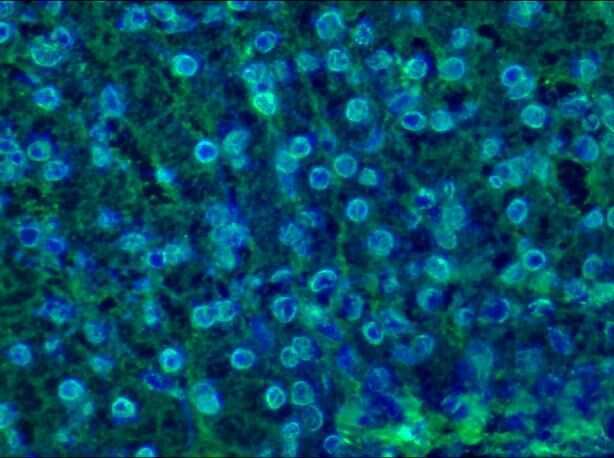
- Immunofluorescent analysis of 9 days old zebrafish embryo using Lamin B1 monoclonal antibody (Product # MA1-06103).

- Submitted by
- Invitrogen Antibodies (provider)
- Main image

- Experimental details
- Immunofluorescent analysis of 9 days old zebrafish embryo using Lamin B1 monoclonal antibody (Product # MA1-06103).

- Submitted by
- Invitrogen Antibodies (provider)
- Main image

- Experimental details
- Immunohistochemistry on frozen sections of human colon showing nuclear lamina staining in epithelial and connective tissue cells stained with Lamin B1 monoclonal antibody (Product # MA1-06103).

- Submitted by
- Invitrogen Antibodies (provider)
- Main image

- Experimental details
- Immunohistochemistry on frozen sections of swine liver showing nuclear lamina staining in hepatocytes stained with Lamin B1 monoclonal antibody (Product # MA1-06103).
- Submitted by
- Invitrogen Antibodies (provider)
- Main image

- Experimental details
- Immunofluorescent analysis of 9 days old zebrafish embryo using Lamin B1 monoclonal antibody (Product # MA1-06103).

Supportive validation
- Submitted by
- Invitrogen Antibodies (provider)
- Main image

- Experimental details
- Fig. 1 Localization of ErbB2 in mitochondria. (A) Cytosolic, nuclear, mitochondrial, and plasma membrane proteins were isolated and subjected to SDS-PAGE followed by probing with indicated antibodies. Two exogenous ErbB2 overexpressing breast cancer cell lines MCF7/ErbB2 and MDA-MB-231 (left), and two natural ErbB2-positive breast cancer cell lines SKBR3 and BT474 (right) were used for Western Blotting. VDAC1 and prohibitin were mitochondrial markers; Integrin beta1 and IGF1Ralpha were plasma membrane markers; alpha-Tubulin and ERK were cytoplasmic markers; KDEL was an ER marker; EEA1 was an early endosomes marker; Golgi complex was a marker for the detection of Golgi; LAMP2 was an lysosome marker and Lamin B1 was a nucleus marker. (B) MCF7 cells, mouse heart and liver tissues, and ErbB2 positive and negative breast cancer patient samples were analyzed by Western blotting. (C) Co-localization of ErbB2 and mitochondria. Mitochondria were stained with Mitotracker-Green in ErbB2 transfected MCF7 cells. The cells were fixed and incubated with antibodies against ErbB2 (mouse), followed by incubation of monoclonal mouse Anti-Cy3 antibody (red). Images were analyzed with Nikon NIS-Elements AR software. Green: mitochondria; Red: ErbB2; Yellow: Co-localization of ErbB2 and mitochondria. The lower panel contains images with a higher magnification. Scale bars: 20 mum. (D) Localization of ErbB2 inside mitochondria. Intact mitochondria of SKBR3 cells were isolated and treated with Proteas

- Submitted by
- Invitrogen Antibodies (provider)
- Main image

- Experimental details
- Fig. 3 MtErbB2 reprograms cellular metabolism from oxidative phosphorylation toward glycolysis. (A) Mitochondrial and whole cell lysate of 231V, 231ErbB2WT, 231ErbB2Mito, and 231ErbB2DeltaMTS cells were isolated and analyzed by Western blotting. Protein amounts of each fraction loaded: mitochondria: 10 ug; whole cell lysate: 30 ug. Integrin beta1 was used as plasma membrane maker and loading control; mtHSP70 was a mitochondrial maker and loading control; alpha-Tubulin was a cytoplasm maker; KDEL was an ER marker; EEA1 was an early endosomes marker; Golgi Complex was a marker for the detection of Golgi; LAMP2 was an lysosome marker and Lamin B1 was a nucleus marker. (B) Oxygen consumption rates. Oxygen consumption rates of 231V, 231ErbB2WT, 231ErbB2Mito, 231ErbB2DeltaMTS and 231ErbB2MitoKM cells were measured. The oxygen consumption rate was calculated on the basis of the maximal rate of change in relative fluorescence units (DFU/second). (C) Activities of the mitochondrial electron transport chain complexes in 231V, 231ErbB2WT, 231ErbB2Mito, 231ErbB2DeltaMTS and 231ErbB2MitoKM cells. Activities are presented as milliunits of O.D. value per min and were normalized by the amounts of the mitochondrial proteins. (D) Mitochondrial membrane potential (DeltaPsim) of 231V, 231ErbB2WT, 231ErbB2Mito, 231ErbB2DeltaMTS and 231ErbB2MitoKM cells was detected using JC-1 staining. The aggregate form of JC-1 staining represents healthy mitochondria. (E) The cellular ATP/ADP ratio of 231V, 231

- Submitted by
- Invitrogen Antibodies (provider)
- Main image

- Experimental details
- Figure 11 Validation of 2D-DIGE data by western blot. Western blot analysis of annexin A1, ARP3, PGAM1 and Lamin-B1 proteins were differentially regulated during lactation stages and annexin A1 and vimentin were differentially regulated in high and low-milk yielding samples.

- Submitted by
- Invitrogen Antibodies (provider)
- Main image
- Experimental details
- Figure 2 alpha-Syn PFF treatment reduces the expressions of Lamin B1, HMGB1 and SATB1 in N27 cells, whereas it increases p21 expression in a short period of time. The examples of cellular senescence markers over 48 h are displayed in Western blots ( A ). The levels of LaminB1 ( B ), HMGB1 ( C ), SATB1 ( D ), p16 ( E ) and p21 ( F ) with alpha-syn PFF treatment are displayed in comparison with initial time point (T = 0). GAPDH was adopted as a loading control, and ImageJ was used for the analyses of band intensities. The relative levels (100% for no PFF treated vehicle) are displayed in mean +- SEM and applied to one-way ANOVA, Dunnett's post-hoc test (#: compared with T = 0 point) for statistical significance. * : p < 0.05, ** : p < 0.01, *** : p < 0.001 and **** : p < 0.0001.

- Submitted by
- Invitrogen Antibodies (provider)
- Main image

- Experimental details
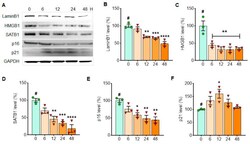
- Figure 6 The levels of LaminB1 and p16 gradually decrease with alpha-syn PFF treatment, while the levels of HMGB1, p21 and Iba-1 increase in the isolated microglial culture over 3 days of alpha-syn PFF exposure. In Western blots, senescence markers were quantified in primary microglia culture at 12, 24, 48 and 72 h after alpha-syn PFF exposure to detect expression patterns over time ( A ). For assessing the expression levels over 3 days of alpha-syn PFF exposure, we quantified the levels of Lamin B1 ( B ), HMGB1 ( C ), SATB1 ( D ), p16 ( E ), p21 ( F ) and Iba-1 ( G ). GAPDH was also used as a loading control. The relative band intensities (100% for no PFF treatment) are displayed in mean +- SEM and applied to one-way ANOVA, Dunnett's post-hoc test (#: compared with T = 0 point) for statistical significance. * : p < 0.05, ** : p < 0.01, *** : p < 0.001 and **** : p < 0.0001.

- Submitted by
- Invitrogen Antibodies (provider)
- Main image

- Experimental details
- Figure 7 The levels of cellular senescence markers, such as Lamin B1, HMGB1 and SATB1, were significantly lower in human PD SNpc than age- and gender-matched control tissues, whereas the level of p21 was higher in human PD post-mortem SNpc (n = 8/group). In Western blots, the examples of senescence markers are displayed in quadruplets per group ( A ). The quantified levels of Lamin B1 ( B ), HMGB1 ( C ), SATB1 ( D ), p16 ( E ), p21 ( F ) and beta-III-tubulin ( G ) were statistically analyzed in unpaired Student's t -test for significance. The band intensity of GAPDH was normalized and displayed as relative band intensities (100% for age-matched controls, n = 8/group) in mean +- SEM. * : p < 0.05, ** : p < 0.01, *** : p < 0.001 and **** : p < 0.0001. ns: not significant.

- Submitted by
- Invitrogen Antibodies (provider)
- Main image

- Experimental details
- Figure 8 The levels of cellular senescence markers such as LaminB1 and HMGB1 were significantly lower in alpha-syn PFF-injected mouse midbrain (MB) and striatum (STR) than PBS-treated brains, whereas the levels of p21, GFAP and Iba-1 were enhanced by 5-6 months after PFF treatment (n = 6/group). In Western blots, the examples of cellular senescence markers are displayed in triplicates per group (( A ) MB, ( J ) STR). The quantified levels of Lamin B1 ( B , K ), HMGB1 ( C , L ), SATB1 ( D , M ), p16 ( E , N ), p21 ( F , O ), GFAP ( G , P ), Iba-1 ( H , Q ) and beta-III-tubulin ( I , R ) are demonstrated. The level of beta-III-tubulin decreased with alpha-syn PFF injection due to the neuronal loss. In quantification, the band intensity was normalized by a loading control, GAPDH and displayed in mean +- SEM in relativity (100% for age-matched controls, n = 6/group). The data analysis was applied to unpaired Student's t -test for statistical significance. * : p < 0.05, ** : p < 0.01, *** : p < 0.001 and **** : p < 0.0001. ns: not significant.
