 Explore
 Validate
 Learn
Learn Western blot
 Immunocytochemistry
Antibody data
- Antibody Data
- Antigen structure
- References [32]
- Comments [0]
- Validations
- Immunocytochemistry [5]
- Immunohistochemistry [3]
- Other assay [20]
Submit
Validation data
Reference
Comment
Report error
- Product number
- PA1-655 - Provider product page

- Provider
- Invitrogen Antibodies
- Product name
- LAMP2 Polyclonal Antibody
- Antibody type
- Polyclonal
- Antigen
- Synthetic peptide
- Description
- PA1-655 detects lysosome-associated membrane protein-2 (LAMP2) from rat, mouse and human tissues. PA1-655 has been successfully used in Western blot, immunofluorescence, and immunohistochemistry. By Western blot, this antibody detects glycosylated and non-glycosylated LAMP-2, depending on the lysis buffer used. PA1-655 immunizing peptide corresponds to amino acid residues 400-411 from rat LAMP2. This sequence is completely conserved between rat, mouse, and guinea pig LAMP2. PA1-655 immunizing peptide (Cat. # PEP-039) is available for use in neutralization and control experiments.
- Reactivity
- Human, Mouse, Rat
- Host
- Rabbit
- Isotype
- IgG
- Vial size
- 100 μL
- Concentration
- 1 mg/mL
- Storage
- -20°C, Avoid Freeze/Thaw Cycles
Submitted references Delivering progranulin to neuronal lysosomes protects against excitotoxicity.
A modified density gradient proteomic-based method to analyze endolysosomal proteins in cardiac tissue.
Cathepsin K Regulates Intraocular Pressure by Modulating Extracellular Matrix Remodeling and Actin-Bundling in the Trabecular Meshwork Outflow Pathway.
Neuronal VCP loss of function recapitulates FTLD-TDP pathology.
A CRHR1 antagonist prevents synaptic loss and memory deficits in a trauma-induced delirium-like syndrome.
LC3B phosphorylation regulates FYCO1 binding and directional transport of autophagosomes.
KIF5A-dependent axonal transport deficiency disrupts autophagic flux in trimethyltin chloride-induced neurotoxicity.
The Lysosomal Membrane Protein Lamp2 Alleviates Lysosomal Cell Death by Promoting Autophagic Flux in Ischemic Cardiomyocytes.
Internalization mechanisms of brain-derived tau oligomers from patients with Alzheimer's disease, progressive supranuclear palsy and dementia with Lewy bodies.
Protective effects of endurance exercise on skeletal muscle remodeling against doxorubicin-induced myotoxicity in mice.
Lumenal Galectin-9-Lamp2 interaction regulates lysosome and autophagy to prevent pathogenesis in the intestine and pancreas.
Loss of Cubilin, the intrinsic factor-vitamin B12 receptor, impairs visceral endoderm endocytosis and endodermal patterning in the mouse.
Doxorubicin-induced cardiomyopathy associated with inhibition of autophagic degradation process and defects in mitochondrial respiration.
A Liver-Specific Thyromimetic, VK2809, Decreases Hepatosteatosis in Glycogen Storage Disease Type Ia.
Rapamycin and fasting sustain autophagy response activated by ischemia/reperfusion injury and promote retinal ganglion cell survival.
Hydroxypropyl-beta and -gamma cyclodextrins rescue cholesterol accumulation in Niemann-Pick C1 mutant cell via lysosome-associated membrane protein 1.
Corticotropin-releasing hormone-binding protein is up-regulated by brain-derived neurotrophic factor and is secreted in an activity-dependent manner in rat cerebral cortical neurons.
High resolution structural evidence suggests the Sarcoplasmic Reticulum forms microdomains with Acidic Stores (lysosomes) in the heart.
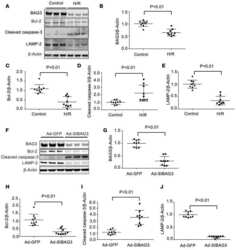
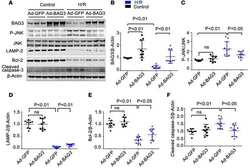
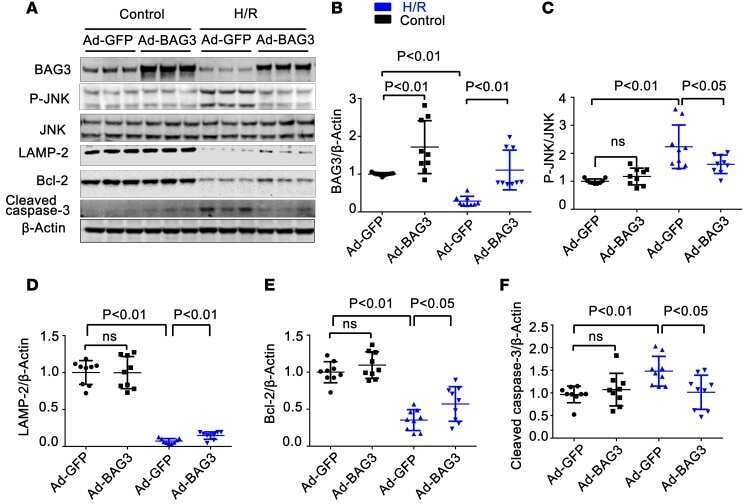
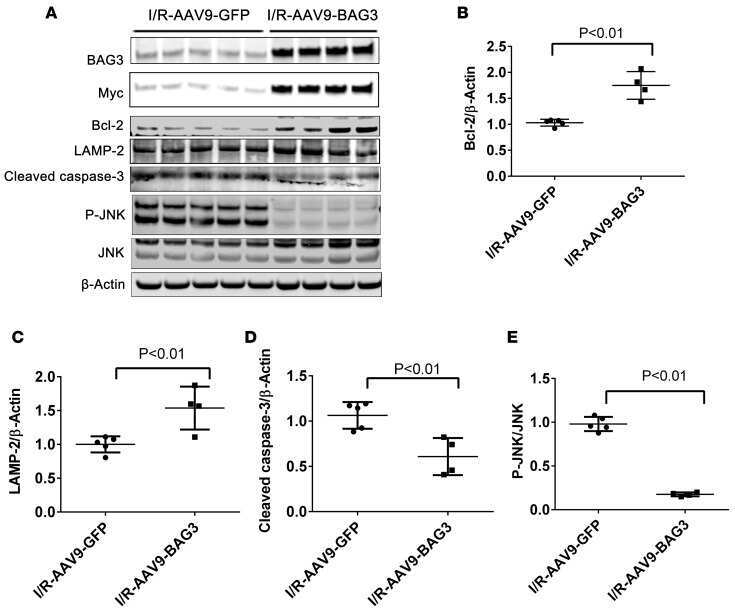
Bcl-2-associated athanogene 3 protects the heart from ischemia/reperfusion injury.
Low autophagy capacity implicated in motor system vulnerability to mutant superoxide dismutase.
Internalization and axonal transport of the HIV glycoprotein gp120.
Syntenin-ALIX exosome biogenesis and budding into multivesicular bodies are controlled by ARF6 and PLD2.
Nonmuscle myosin II powered transport of newly formed collagen fibrils at the plasma membrane.
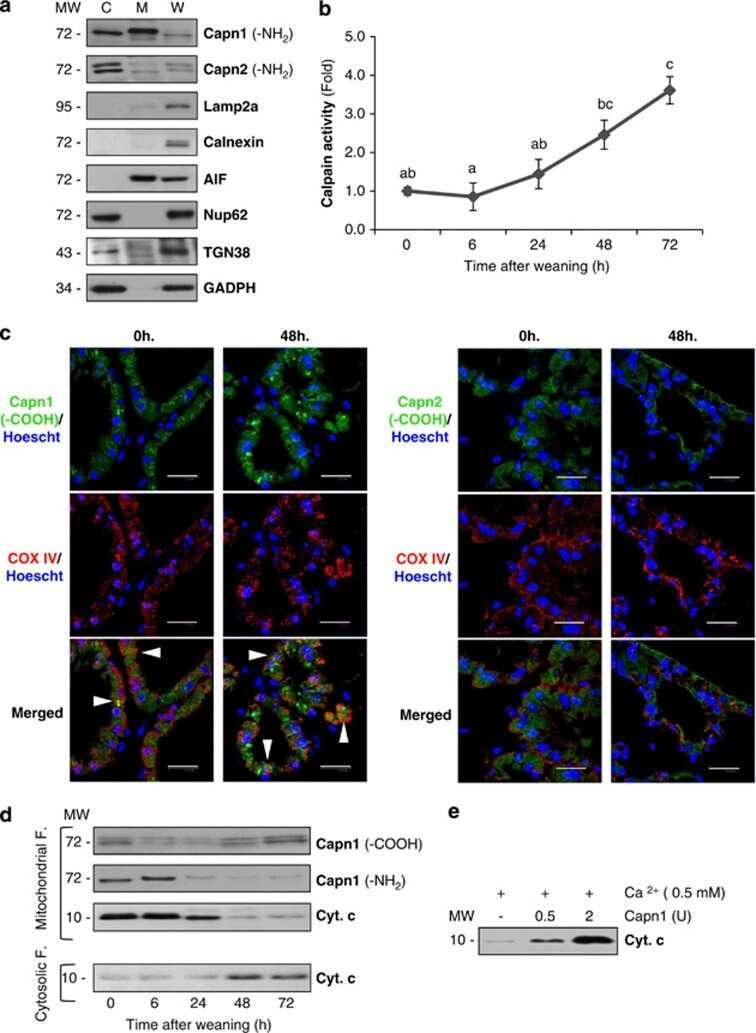
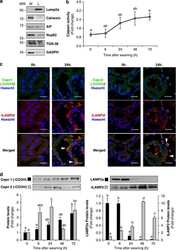
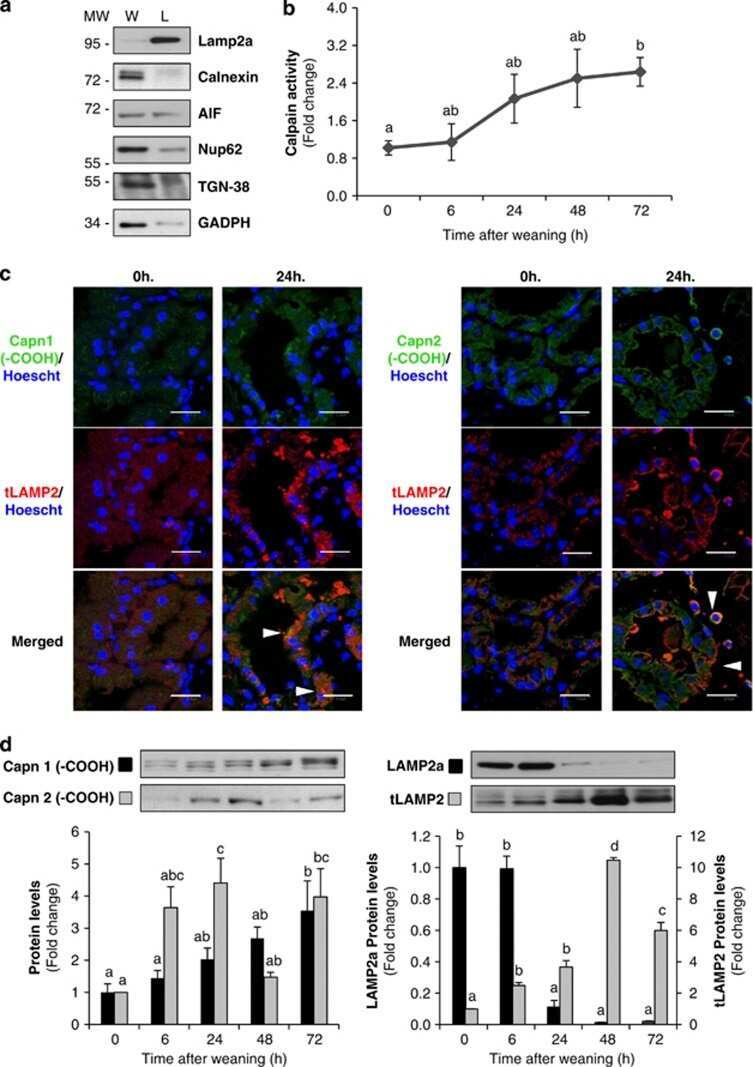
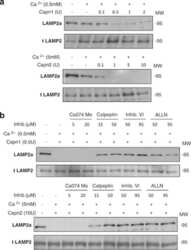
Calpains mediate epithelial-cell death during mammary gland involution: mitochondria and lysosomal destabilization.
Endocytosis in cultured neurons is altered by chronic alcohol exposure.
Identification and characterization of mature beta-hexosaminidases associated with human placenta lysosomal membrane.
Hsp70 protects against UVB induced apoptosis by preventing release of cathepsins and cytochrome c in human melanocytes.
Inhibition of macroautophagy triggers apoptosis.
MARCH-II is a syntaxin-6-binding protein involved in endosomal trafficking.
Trafficking of exogenous peptides into proteasome-dependent major histocompatibility complex class I pathway following enterotoxin B subunit-mediated delivery.
Different steady state subcellular distributions of the three splice variants of lysosome-associated membrane protein LAMP-2 are determined largely by the COOH-terminal amino acid residue.
Different steady state subcellular distributions of the three splice variants of lysosome-associated membrane protein LAMP-2 are determined largely by the COOH-terminal amino acid residue.
Davis SE, Roth JR, Aljabi Q, Hakim AR, Savell KE, Day JJ, Arrant AE
The Journal of biological chemistry 2021 Sep;297(3):100993
The Journal of biological chemistry 2021 Sep;297(3):100993
A modified density gradient proteomic-based method to analyze endolysosomal proteins in cardiac tissue.
Ayagama T, Bose SJ, Capel RA, Priestman DA, Berridge G, Fischer R, Galione A, Platt FM, Kramer H, Burton RAB
iScience 2021 Sep 24;24(9):102949
iScience 2021 Sep 24;24(9):102949
Cathepsin K Regulates Intraocular Pressure by Modulating Extracellular Matrix Remodeling and Actin-Bundling in the Trabecular Meshwork Outflow Pathway.
Soundararajan A, Ghag SA, Vuda SS, Wang T, Pattabiraman PP
Cells 2021 Oct 24;10(11)
Cells 2021 Oct 24;10(11)
Neuronal VCP loss of function recapitulates FTLD-TDP pathology.
Wani A, Zhu J, Ulrich JD, Eteleeb A, Sauerbeck AD, Reitz SJ, Arhzaouy K, Ikenaga C, Yuede CM, Pittman SK, Wang F, Li S, Benitez BA, Cruchaga C, Kummer TT, Harari O, Chou TF, Schröder R, Clemen CS, Weihl CC
Cell reports 2021 Jul 20;36(3):109399
Cell reports 2021 Jul 20;36(3):109399
A CRHR1 antagonist prevents synaptic loss and memory deficits in a trauma-induced delirium-like syndrome.
Cursano S, Battaglia CR, Urrutia-Ruiz C, Grabrucker S, Schön M, Bockmann J, Braumüller S, Radermacher P, Roselli F, Huber-Lang M, Boeckers TM
Molecular psychiatry 2021 Aug;26(8):3778-3794
Molecular psychiatry 2021 Aug;26(8):3778-3794
LC3B phosphorylation regulates FYCO1 binding and directional transport of autophagosomes.
Nieto-Torres JL, Shanahan SL, Chassefeyre R, Chaiamarit T, Zaretski S, Landeras-Bueno S, Verhelle A, Encalada SE, Hansen M
Current biology : CB 2021 Aug 9;31(15):3440-3449.e7
Current biology : CB 2021 Aug 9;31(15):3440-3449.e7
KIF5A-dependent axonal transport deficiency disrupts autophagic flux in trimethyltin chloride-induced neurotoxicity.
Liu M, Pi H, Xi Y, Wang L, Tian L, Chen M, Xie J, Deng P, Zhang T, Zhou C, Liang Y, Zhang L, He M, Lu Y, Chen C, Yu Z, Zhou Z
Autophagy 2021 Apr;17(4):903-924
Autophagy 2021 Apr;17(4):903-924
The Lysosomal Membrane Protein Lamp2 Alleviates Lysosomal Cell Death by Promoting Autophagic Flux in Ischemic Cardiomyocytes.
Cui L, Zhao LP, Ye JY, Yang L, Huang Y, Jiang XP, Zhang Q, Jia JZ, Zhang DX, Huang Y
Frontiers in cell and developmental biology 2020;8:31
Frontiers in cell and developmental biology 2020;8:31
Internalization mechanisms of brain-derived tau oligomers from patients with Alzheimer's disease, progressive supranuclear palsy and dementia with Lewy bodies.
Puangmalai N, Bhatt N, Montalbano M, Sengupta U, Gaikwad S, Ventura F, McAllen S, Ellsworth A, Garcia S, Kayed R
Cell death & disease 2020 May 4;11(5):314
Cell death & disease 2020 May 4;11(5):314
Protective effects of endurance exercise on skeletal muscle remodeling against doxorubicin-induced myotoxicity in mice.
Kwon I
Physical activity and nutrition 2020 Jun 30;24(2):11-21
Physical activity and nutrition 2020 Jun 30;24(2):11-21
Lumenal Galectin-9-Lamp2 interaction regulates lysosome and autophagy to prevent pathogenesis in the intestine and pancreas.
Sudhakar JN, Lu HH, Chiang HY, Suen CS, Hwang MJ, Wu SY, Shen CN, Chang YM, Li FA, Liu FT, Shui JW
Nature communications 2020 Aug 27;11(1):4286
Nature communications 2020 Aug 27;11(1):4286
Loss of Cubilin, the intrinsic factor-vitamin B12 receptor, impairs visceral endoderm endocytosis and endodermal patterning in the mouse.
Perea-Gomez A, Cases O, Lelièvre V, Pulina MV, Collignon J, Hadjantonakis AK, Kozyraki R
Scientific reports 2019 Jul 15;9(1):10168
Scientific reports 2019 Jul 15;9(1):10168
Doxorubicin-induced cardiomyopathy associated with inhibition of autophagic degradation process and defects in mitochondrial respiration.
Abdullah CS, Alam S, Aishwarya R, Miriyala S, Bhuiyan MAN, Panchatcharam M, Pattillo CB, Orr AW, Sadoshima J, Hill JA, Bhuiyan MS
Scientific reports 2019 Feb 14;9(1):2002
Scientific reports 2019 Feb 14;9(1):2002
A Liver-Specific Thyromimetic, VK2809, Decreases Hepatosteatosis in Glycogen Storage Disease Type Ia.
Zhou J, Waskowicz LR, Lim A, Liao XH, Lian B, Masamune H, Refetoff S, Tran B, Koeberl DD, Yen PM
Thyroid : official journal of the American Thyroid Association 2019 Aug;29(8):1158-1167
Thyroid : official journal of the American Thyroid Association 2019 Aug;29(8):1158-1167
Rapamycin and fasting sustain autophagy response activated by ischemia/reperfusion injury and promote retinal ganglion cell survival.
Russo R, Varano GP, Adornetto A, Nazio F, Tettamanti G, Girardello R, Cianfanelli V, Cavaliere F, Morrone LA, Corasaniti MT, Cecconi F, Bagetta G, Nucci C
Cell death & disease 2018 Sep 24;9(10):981
Cell death & disease 2018 Sep 24;9(10):981
Hydroxypropyl-beta and -gamma cyclodextrins rescue cholesterol accumulation in Niemann-Pick C1 mutant cell via lysosome-associated membrane protein 1.
Singhal A, Szente L, Hildreth JEK, Song B
Cell death & disease 2018 Oct 3;9(10):1019
Cell death & disease 2018 Oct 3;9(10):1019
Corticotropin-releasing hormone-binding protein is up-regulated by brain-derived neurotrophic factor and is secreted in an activity-dependent manner in rat cerebral cortical neurons.
Adachi N, Suzuki S, Matsuoka H, Fushimi S, Ono J, Ohta KI, Hirai Y, Miki T, Koshimizu H
Journal of neurochemistry 2018 Jan 22;
Journal of neurochemistry 2018 Jan 22;
High resolution structural evidence suggests the Sarcoplasmic Reticulum forms microdomains with Acidic Stores (lysosomes) in the heart.
Aston D, Capel RA, Ford KL, Christian HC, Mirams GR, Rog-Zielinska EA, Kohl P, Galione A, Burton RA, Terrar DA
Scientific reports 2017 Jan 17;7:40620
Scientific reports 2017 Jan 17;7:40620
Bcl-2-associated athanogene 3 protects the heart from ischemia/reperfusion injury.
Su F, Myers VD, Knezevic T, Wang J, Gao E, Madesh M, Tahrir FG, Gupta MK, Gordon J, Rabinowitz J, Ramsey FV, Tilley DG, Khalili K, Cheung JY, Feldman AM
JCI insight 2016 Nov 17;1(19):e90931
JCI insight 2016 Nov 17;1(19):e90931
Low autophagy capacity implicated in motor system vulnerability to mutant superoxide dismutase.
Tokuda E, Brännström T, Andersen PM, Marklund SL
Acta neuropathologica communications 2016 Jan 25;4:6
Acta neuropathologica communications 2016 Jan 25;4:6
Internalization and axonal transport of the HIV glycoprotein gp120.
Berth S, Caicedo HH, Sarma T, Morfini G, Brady ST
ASN neuro 2015 Jan-Feb;7(1)
ASN neuro 2015 Jan-Feb;7(1)
Syntenin-ALIX exosome biogenesis and budding into multivesicular bodies are controlled by ARF6 and PLD2.
Ghossoub R, Lembo F, Rubio A, Gaillard CB, Bouchet J, Vitale N, Slavík J, Machala M, Zimmermann P
Nature communications 2014 Mar 18;5:3477
Nature communications 2014 Mar 18;5:3477
Nonmuscle myosin II powered transport of newly formed collagen fibrils at the plasma membrane.
Kalson NS, Starborg T, Lu Y, Mironov A, Humphries SM, Holmes DF, Kadler KE
Proceedings of the National Academy of Sciences of the United States of America 2013 Dec 3;110(49):E4743-52
Proceedings of the National Academy of Sciences of the United States of America 2013 Dec 3;110(49):E4743-52
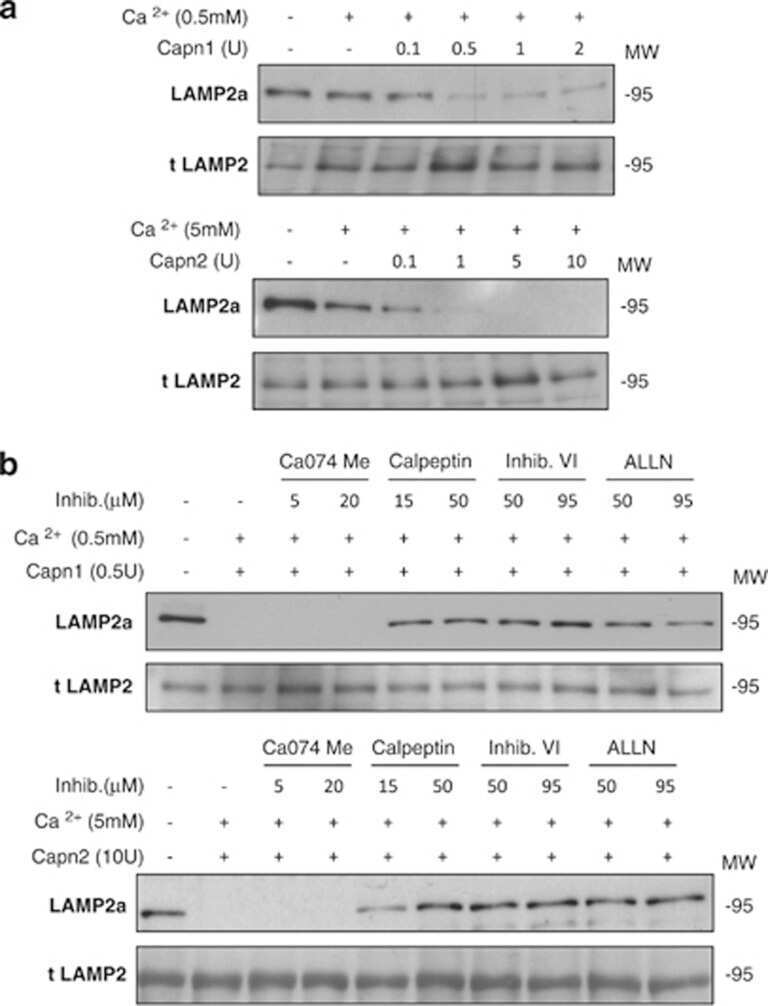
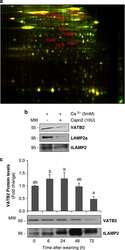
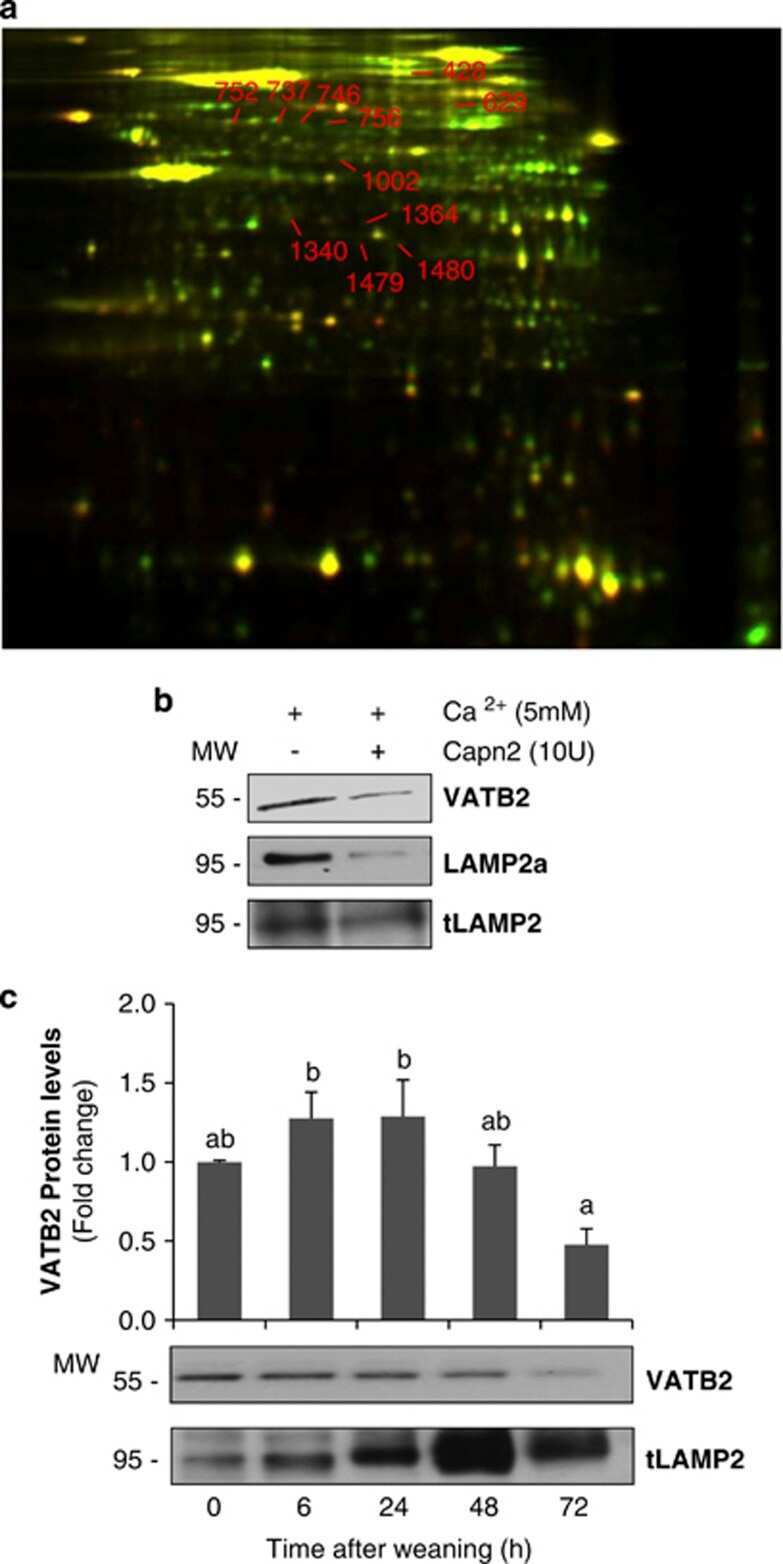
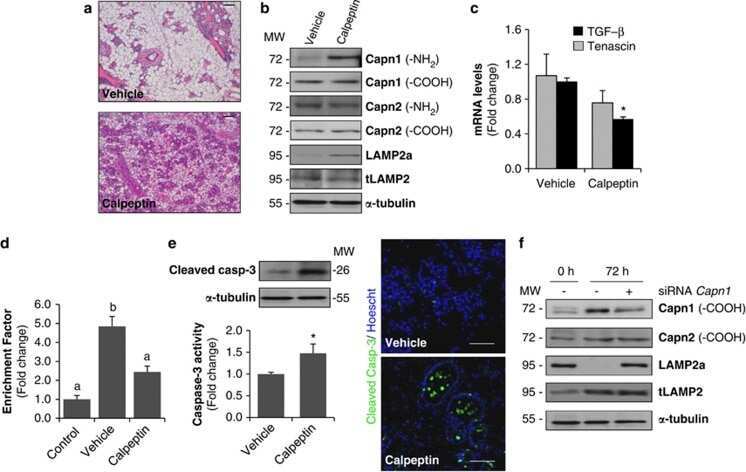
Calpains mediate epithelial-cell death during mammary gland involution: mitochondria and lysosomal destabilization.
Arnandis T, Ferrer-Vicens I, García-Trevijano ER, Miralles VJ, García C, Torres L, Viña JR, Zaragozá R
Cell death and differentiation 2012 Sep;19(9):1536-48
Cell death and differentiation 2012 Sep;19(9):1536-48
Endocytosis in cultured neurons is altered by chronic alcohol exposure.
Marín MP, Esteban-Pretel G, Ponsoda X, Romero AM, Ballestín R, López C, Megías L, Timoneda J, Molowny A, Canales JJ, Renau-Piqueras J
Toxicological sciences : an official journal of the Society of Toxicology 2010 May;115(1):202-13
Toxicological sciences : an official journal of the Society of Toxicology 2010 May;115(1):202-13
Identification and characterization of mature beta-hexosaminidases associated with human placenta lysosomal membrane.
Magini A, Mencarelli S, Tancini B, Ciccarone V, Urbanelli L, Hasilik A, Emiliani C
Bioscience reports 2008 Aug;28(4):229-37
Bioscience reports 2008 Aug;28(4):229-37
Hsp70 protects against UVB induced apoptosis by preventing release of cathepsins and cytochrome c in human melanocytes.
Bivik C, Rosdahl I, Ollinger K
Carcinogenesis 2007 Mar;28(3):537-44
Carcinogenesis 2007 Mar;28(3):537-44
Inhibition of macroautophagy triggers apoptosis.
Boya P, González-Polo RA, Casares N, Perfettini JL, Dessen P, Larochette N, Métivier D, Meley D, Souquere S, Yoshimori T, Pierron G, Codogno P, Kroemer G
Molecular and cellular biology 2005 Feb;25(3):1025-40
Molecular and cellular biology 2005 Feb;25(3):1025-40
MARCH-II is a syntaxin-6-binding protein involved in endosomal trafficking.
Nakamura N, Fukuda H, Kato A, Hirose S
Molecular biology of the cell 2005 Apr;16(4):1696-710
Molecular biology of the cell 2005 Apr;16(4):1696-710
Trafficking of exogenous peptides into proteasome-dependent major histocompatibility complex class I pathway following enterotoxin B subunit-mediated delivery.
Hearn AR, de Haan L, Pemberton AJ, Hirst TR, Rivett AJ
The Journal of biological chemistry 2004 Dec 3;279(49):51315-22
The Journal of biological chemistry 2004 Dec 3;279(49):51315-22
Different steady state subcellular distributions of the three splice variants of lysosome-associated membrane protein LAMP-2 are determined largely by the COOH-terminal amino acid residue.
Gough NR, Fambrough DM
The Journal of cell biology 1997 Jun 2;137(5):1161-9
The Journal of cell biology 1997 Jun 2;137(5):1161-9
No comments: Submit comment
Supportive validation
- Submitted by
- Invitrogen Antibodies (provider)
- Main image
- Experimental details
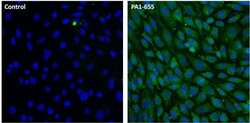
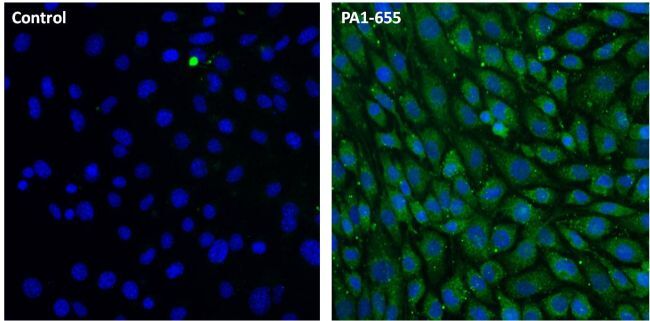
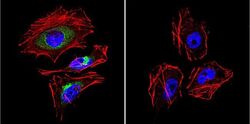
- Immunofluorescent analysis of LAMP-2 (green) in NIH/3T3 cells. Cells were fixed with 4% paraformaldehyde, permeabilized with 0.1% Triton X-100 in PBS, and blocked with 1% Blocker BSA (Product # 37525), each for 15 minutes at room temperature. Cells were stained with a LAMP-2 polyclonal antibody (Product # PA1-655) at a concentration of 20 µg/mL in 1% Blocker BSA in PBS (right panel), or incubated in blocking buffer alone as a negative control (left panel) overnight at 4C, and then incubated with a Dylight 488-conjugated goat anti-rabbit IgG secondary antibody (Product # 35552) at a dilution of 1:1000 for 1 hour at room temperature. Nuclei (blue) were stained with DAPI (Product # 46190). Images were taken on a Thermo Scientific ToxInsight Instrument at 20X magnification.

- Submitted by
- Invitrogen Antibodies (provider)
- Main image

- Experimental details
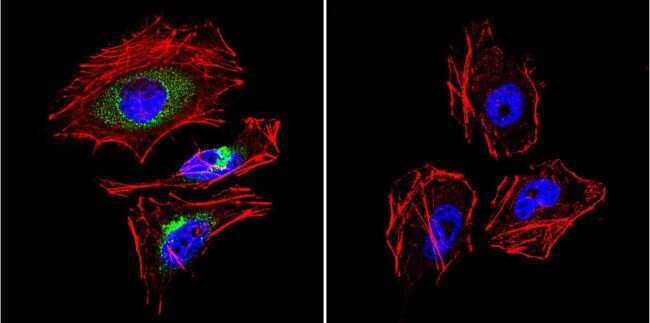
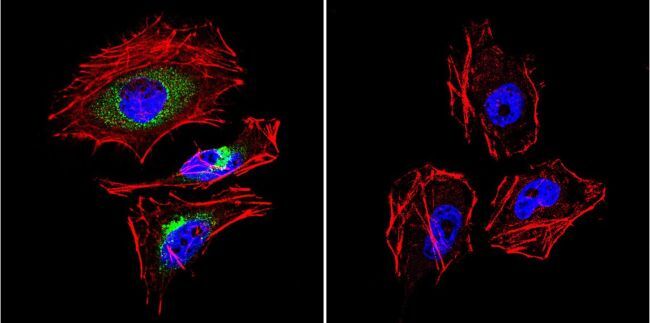
- Immunofluorescent analysis of LAMP2 in HeLa Cells. Cells were grown on chamber slides and fixed with formaldehyde prior to staining. Cells were probed without (control) or with a LAMP2 polyclonal antibody (Product # PA1-655) at a dilution of 1:20 overnight at 4 C, washed with PBS and incubated with a DyLight-488 conjugated secondary antibody (Product # 35552). LAMP2 staining (green), F-Actin staining with Phalloidin (red) and nuclei with DAPI (blue) is shown. Images were taken at 60X magnification.
- Submitted by
- Invitrogen Antibodies (provider)
- Main image
- Experimental details
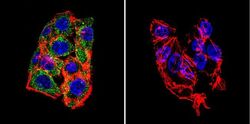
- Immunofluorescent analysis of LAMP2 in HepG2 Cells. Cells were grown on chamber slides and fixed with formaldehyde prior to staining. Cells were probed without (control) or with a LAMP2 polyclonal antibody (Product # PA1-655) at a dilution of 1:100 overnight at 4 C, washed with PBS and incubated with a DyLight-488 conjugated secondary antibody (Product # 35552). LAMP2 staining (green), F-Actin staining with Phalloidin (red) and nuclei with DAPI (blue) is shown. Images were taken at 60X magnification.

- Submitted by
- Invitrogen Antibodies (provider)
- Main image

- Experimental details
- Immunofluorescent analysis of LAMP-2 (green) in NIH/3T3 cells. Cells were fixed with 4% paraformaldehyde, permeabilized with 0.1% Triton X-100 in PBS, and blocked with 1% Blocker BSA (Product # 37525), each for 15 minutes at room temperature. Cells were stained with a LAMP-2 polyclonal antibody (Product # PA1-655) at a concentration of 20 µg/mL in 1% Blocker BSA in PBS (right panel), or incubated in blocking buffer alone as a negative control (left panel) overnight at 4C, and then incubated with a Dylight 488-conjugated goat anti-rabbit IgG secondary antibody (Product # 35552) at a dilution of 1:1000 for 1 hour at room temperature. Nuclei (blue) were stained with DAPI (Product # 46190). Images were taken on a Thermo Scientific ToxInsight Instrument at 20X magnification.
- Submitted by
- Invitrogen Antibodies (provider)
- Main image
- Experimental details
- Immunofluorescent analysis of LAMP2 in HeLa Cells. Cells were grown on chamber slides and fixed with formaldehyde prior to staining. Cells were probed without (control) or with a LAMP2 polyclonal antibody (Product # PA1-655) at a dilution of 1:20 overnight at 4 C, washed with PBS and incubated with a DyLight-488 conjugated secondary antibody (Product # 35552). LAMP2 staining (green), F-Actin staining with Phalloidin (red) and nuclei with DAPI (blue) is shown. Images were taken at 60X magnification.
Supportive validation
- Submitted by
- Invitrogen Antibodies (provider)
- Main image
- Experimental details
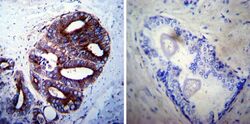
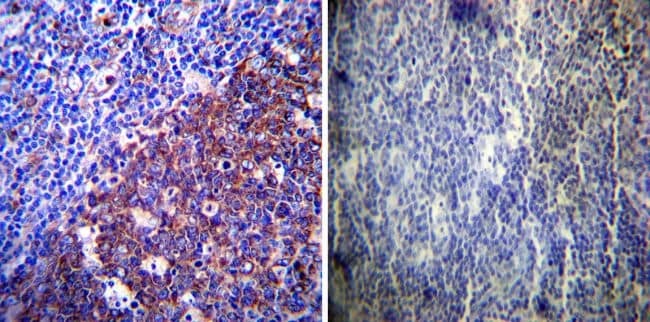
- Immunohistochemistry was performed on cancer biopsies of deparaffinized Human prostate carcinoma tissues. To expose target proteins, heat induced antigen retrieval was performed using 10mM sodium citrate (pH6.0) buffer, microwaved for 8-15 minutes. Following antigen retrieval tissues were blocked in 3% BSA-PBS for 30 minutes at room temperature. Tissues were then probed at a dilution of 1:100 with a rabbit polyclonal antibody recognizing LAMP2 (Product # PA1-655) or without primary antibody (negative control) overnight at 4°C in a humidified chamber. Tissues were washed extensively with PBST and endogenous peroxidase activity was quenched with a peroxidase suppressor. Detection was performed using a biotin-conjugated secondary antibody and SA-HRP, followed by colorimetric detection using DAB. Tissues were counterstained with hematoxylin and prepped for mounting.

- Submitted by
- Invitrogen Antibodies (provider)
- Main image
- Experimental details
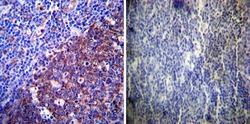
- Immunohistochemistry was performed on normal deparaffinized Human tonsil tissue tissues. To expose target proteins, heat induced antigen retrieval was performed using 10mM sodium citrate (pH6.0) buffer, microwaved for 8-15 minutes. Following antigen retrieval tissues were blocked in 3% BSA-PBS for 30 minutes at room temperature. Tissues were then probed at a dilution of 1:200 with a rabbit polyclonal antibody recognizing LAMP2 (Product # PA1-655) or without primary antibody (negative control) overnight at 4°C in a humidified chamber. Tissues were washed extensively with PBST and endogenous peroxidase activity was quenched with a peroxidase suppressor. Detection was performed using a biotin-conjugated secondary antibody and SA-HRP, followed by colorimetric detection using DAB. Tissues were counterstained with hematoxylin and prepped for mounting.
- Submitted by
- Invitrogen Antibodies (provider)
- Main image
- Experimental details
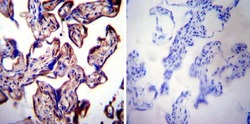
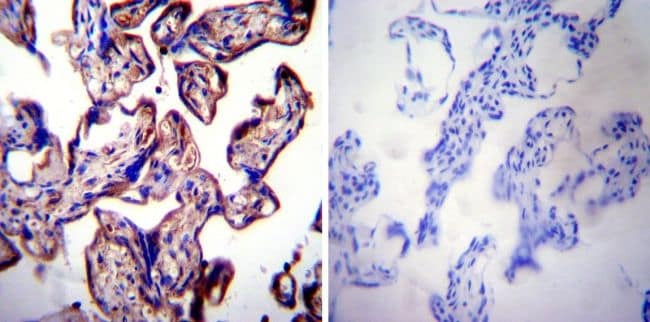
- Immunohistochemistry was performed on normal deparaffinized Human placenta tissue tissues. To expose target proteins, heat induced antigen retrieval was performed using 10mM sodium citrate (pH6.0) buffer, microwaved for 8-15 minutes. Following antigen retrieval tissues were blocked in 3% BSA-PBS for 30 minutes at room temperature. Tissues were then probed at a dilution of 1:20 with a rabbit polyclonal antibody recognizing LAMP2 (Product # PA1-655) or without primary antibody (negative control) overnight at 4°C in a humidified chamber. Tissues were washed extensively with PBST and endogenous peroxidase activity was quenched with a peroxidase suppressor. Detection was performed using a biotin-conjugated secondary antibody and SA-HRP, followed by colorimetric detection using DAB. Tissues were counterstained with hematoxylin and prepped for mounting.
Supportive validation
- Submitted by
- Invitrogen Antibodies (provider)
- Main image
- Experimental details
- NULL
- Submitted by
- Invitrogen Antibodies (provider)
- Main image
- Experimental details
- NULL
- Submitted by
- Invitrogen Antibodies (provider)
- Main image
- Experimental details
- NULL
- Submitted by
- Invitrogen Antibodies (provider)
- Main image
- Experimental details
- NULL
- Submitted by
- Invitrogen Antibodies (provider)
- Main image

- Experimental details
- NULL
- Submitted by
- Invitrogen Antibodies (provider)
- Main image
- Experimental details
- NULL

- Submitted by
- Invitrogen Antibodies (provider)
- Main image
- Experimental details
- NULL
- Submitted by
- Invitrogen Antibodies (provider)
- Main image

- Experimental details
- NULL
- Submitted by
- Invitrogen Antibodies (provider)
- Main image
- Experimental details
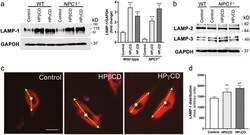
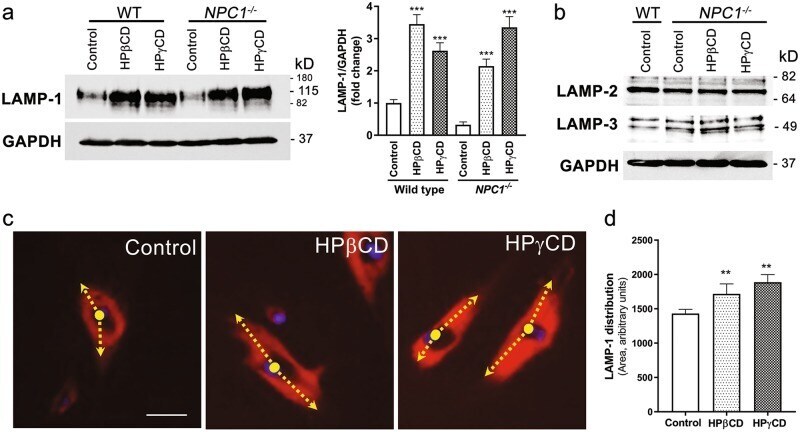
- Fig. 4 HPbetaCD or HPgammaCD treatment induces LAMP-1 expression and causes a change in lysosomal positioning in NPC1 mutant cells. The healthy (wild-type) cells or NPC1 -/- cells treated with HPbetaCD or HPgammaCD for 72 h were lysed for immunoblotting ( a , b ) or stained for LAMP-1 ( c ). a The representative western blot and bar diagram of three experiments show that wild-type or NPC1 -/- cells treated with either HPbetaCD or HPgammaCD showed significantly higher levels of LAMP-1 expression ( p < 0.001). The error bars shows mean +- S.E.M. of fold change calculated by densitometry analysis. b The representative western blot of three experiments shows that neither HPbetaCD nor HPgammaCD treatment changed expression of LAMP-2 or LAMP-3 in wild-type or NPC1 -/- cells. c Immunostaining micrographs show LAMP-1 (red, a lysosome marker) and DAPI (blue, a nucleus marker) staining. The arrow represents the distribution of LAMP-1 from the center of the nuclei. Data depict that the LAMP-1 protein is mostly confined to the area near the nuclear envelop in control NPC1 -/- cells, whereas it is distributed more widely throughout the cytoplasm when cells were treated with either HPbetaCD or HPgammaCD. Images are a representative of at least three random fields of three experimental replicates. Scale bar = 100 mum. d The LAMP-1 distribution per cell was quantified by measuring the area of fluorescence. Data are mean +- S.E.M. and representative of three experiments
- Submitted by
- Invitrogen Antibodies (provider)
- Main image
- Experimental details
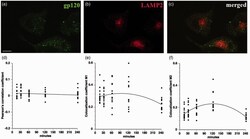
- Figure 5. Gp120 does not colocalize with LAMP2. A time course of fluorescein-gp120 (green) internalization by F11 cells was performed, and cells were stained with an antibody for LAMP2 (red). The scale bar denotes 10 um. A representative image of a F11 cell treated for 2 hr is shown in (a) to (c). Note the lack of colocalization in (c) between green and red channels. Z-stacks were taken of at least 10 cells per time point on a laser scanning confocal microscope, and images were deconvolved and analyzed for colocalization in Volocity. The Pearson's correlation coefficient (d), colocalization coefficient M1 (green channel; e), and colocalization coefficient M2 (red channel; f) all show very low values, demonstrating that fluorescein-gp120 does not colocalize with LAMP2. Because LAMP2 is a marker of lysosomes in the common endosomal pathway, this indicates that gp120 is not internalized through the common endosomal pathway.

- Submitted by
- Invitrogen Antibodies (provider)
- Main image
- Experimental details
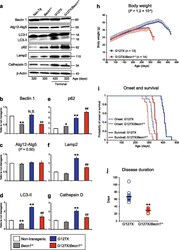
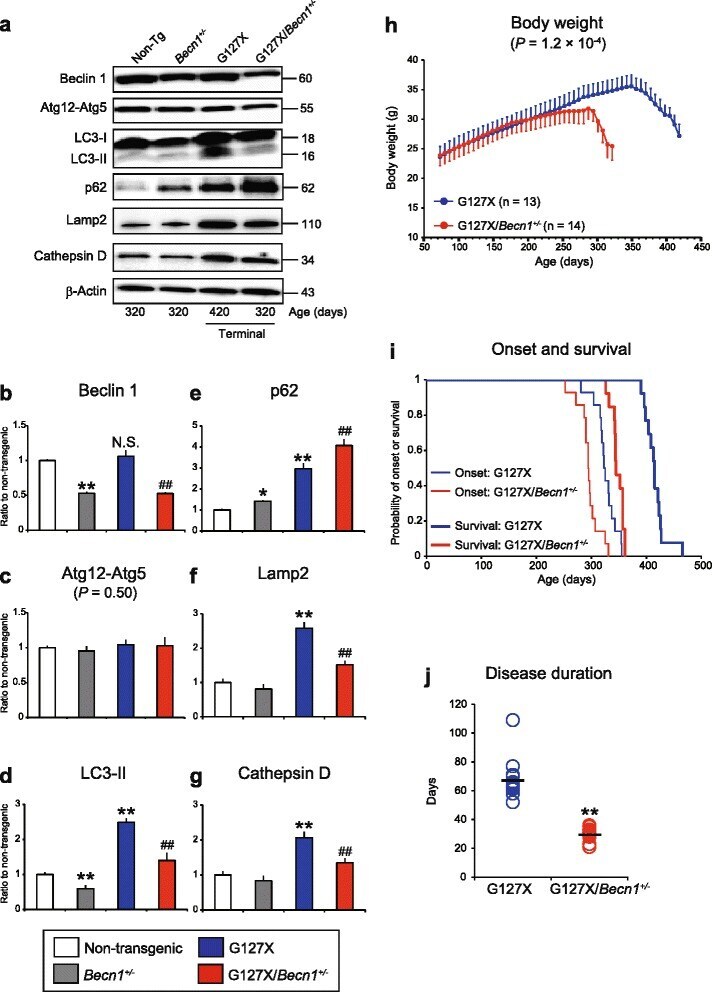
- Fig. 3 Heterozygous deletion of Becn1 impairs autophagy and exacerbates the disease course in hSOD1 G127X mice. a Western blots for autophagic and lysosomal proteins in the spinal cords of hSOD1 G127X / Becn1 +/- mice and littermates ( n = 3 per genotype). b - g The relative expression levels of ( b ) Beclin 1, ( c ) Atg12-Atg5, ( d ) LC3-II, ( e ) p62, ( f ) Lamp2, and ( g ) Cathepsin D in terminally ill mice. Data are given as mean +- SD. * P < 0.05 vs Non-Tg. ** P < 0.01 vs Non-Tg. ## P < 0.01 vs. hSOD1 G127X (one-way ANOVA with Tukey-Kramer's test). N.S. not significant (vs. Non-Tg). h - j The disease courses of hSOD1 G127X mice ( n = 13; male:female 7:6) and hSOD1 G127X / Becn1 +/- mice ( n = 14; male:female 7:7) were evaluated based on alterations in body weight. h Temporal changes in body weight of the mice. Statistical significance was analyzed using repeated-measures ANOVA. i Kaplan-Meier curves for disease onset and survival. Statistical significance was analyzed using repeated-measures ANOVA using Kaplan-Meier analysis with log-rank test. j Scatter plot for the disease duration. Bars represent mean values. ** P < 0.01 (two-tailed Welch's t -test)
- Submitted by
- Invitrogen Antibodies (provider)
- Main image

- Experimental details
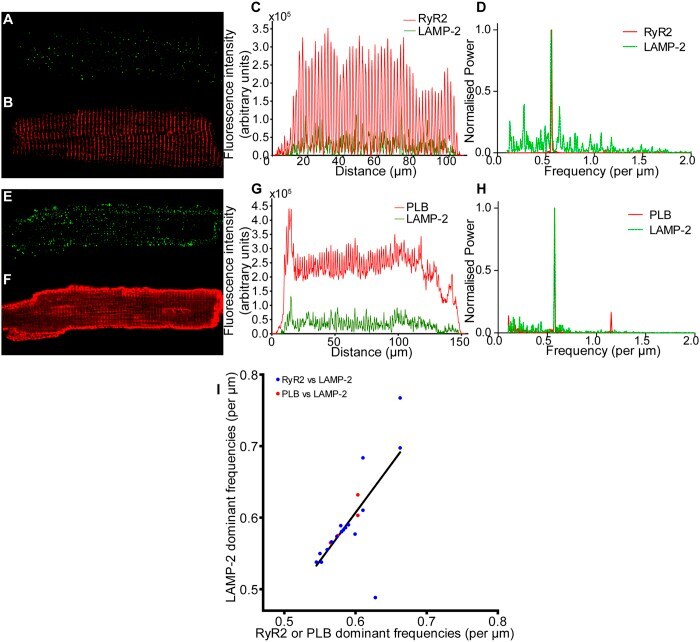
- Figure 6 Lysosomes are localised in a periodic pattern with sarcomeric distribution, similar to RyR and PLB, in fixed, isolated rabbit ventricular myocytes. (Top line) Representative example of LAMP-2 and RyR2 co-labelling experiment. Immunolabelling of LAMP-2 ( A ) and RyR2 ( B ) co-stained in the same, fixed, myocyte. ( C ) Intensity plot illustrating total pixel intensity for each column of pixels, for the two stains. Results of Fourier analyses ( D ) indicate a dominant frequency of 0.56 striations mum -1 , or a signal peak every 1.79 mum, for RyR2 and LAMP-2. (Middle line) Representative example of LAMP-2 and PLB co-labelling experiment. Confocal images of LAMP-2 ( E ) and PLB ( F ) with merged column intensity plot of both stains ( G ). Fourier analysis ( H ) of each signal indicate a dominant frequency of 0.57 signal peaks mum -1 for both PLB and LAMP-2, equivalent to a peak every 1.74 mum. (Bottom Line) ( I ) A correlation plot of dominant frequencies for LAMP-2 against either RyR2 or PLB in co-labelling experiments reveals strong correlation (Pearson product-moment correlation co-efficient (r) = 0.72, n = 22 cells (n = 18 for RyR2 vs LAMP-2 (blue) and n = 4 for PLB vs LAMP-2 (pink)).
- Submitted by
- Invitrogen Antibodies (provider)
- Main image
- Experimental details
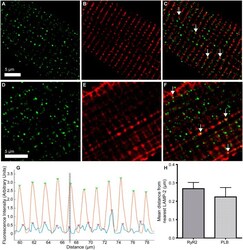
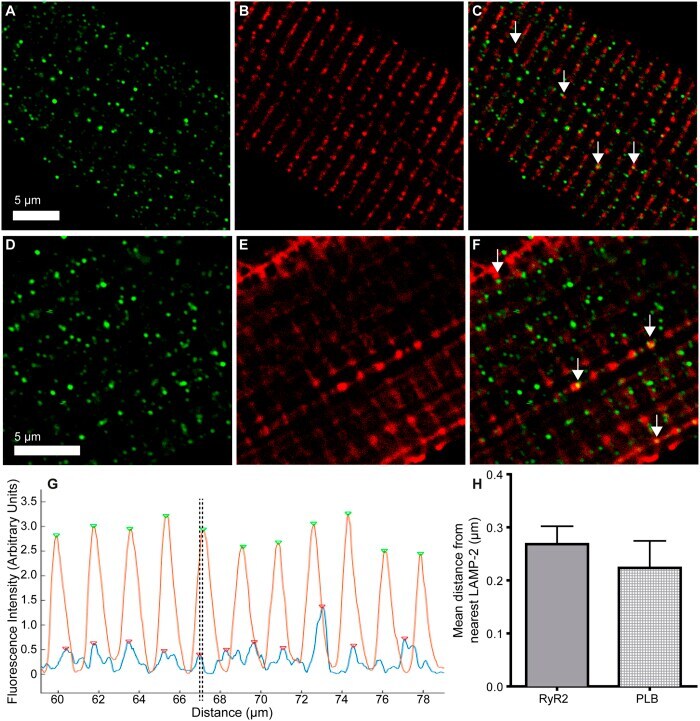
- Figure 7 LAMP-2 and RyR2 or PLB are closely aligned but not co-localised in fixed, isolated rabbit ventricular myocytes. (Top line) Representative immunolabelling of LAMP-2 ( A ) and RyR2 ( B ). ( C ) Merged image. White arrows indicate areas of close proximity. (Middle line) Representative immunolabelling of LAMP-2 ( D ) and PLB ( E ). ( F ) Merged image. White arrows indicate areas of close proximity. (Bottom line) Calculation of distance between fluorescence peaks of LAMP-2 and either RyR2 or PLB in immunolabelling experiments. ( G ) Column fluorescence intensity data for a representative cell stained for LAMP-2 and RyR2 after processing with the peak-finding algorithm. Green arrows indicate peaks of RyR2, red arrows of LAMP-2 (detected by automated MatLab script). Dotted lines indicate an example of a pair of RyR2 and LAMP-2 peaks for distance measurements. ( H) Population data to show average distance in mum between LAMP-2 and either RyR2 (0.27 +- 0.03 mum, n = 16) or PLB (0.22 +- 0.05 mum, n = 3).
- Submitted by
- Invitrogen Antibodies (provider)
- Main image
- Experimental details
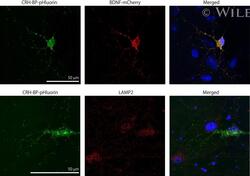
- Intracellular localization of CRH-BP in cortical neurons. (a) Cultured cortical neurons were transduced with pH-sensitive green fluorescent protein-fused CRH-BP (CRH-BP-pHluorin)- and brain-derived neurotrophic factor (BDNF)-mCherry-expressing vectors. Representative fluorescent images of CRH-BP-pHluorin- and BDNF-mCherry-expressing cortical neuron after 24 h transduction are shown. Scale bar indicates 50 mum. (b) Fluorescence imaging was carried out for detecting pHluorin and lysosome-associated membrane protein 2 (LAMP2), a lysosomal marker, in CRH-BP-pHluorin-expressing neurons. Scale bar indicates 50 mum.

- Submitted by
- Invitrogen Antibodies (provider)
- Main image
- Experimental details
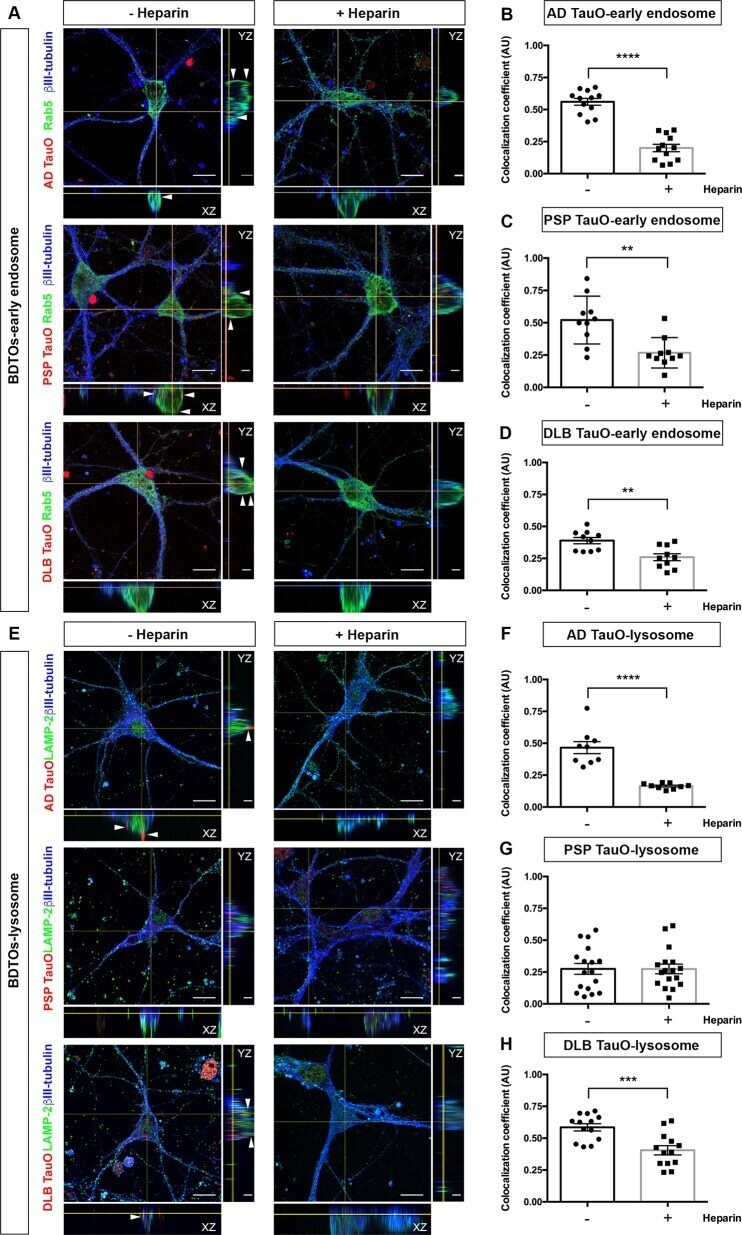
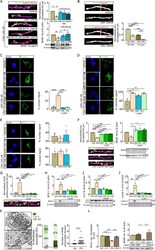
- Fig. 3 Localization of internalized tau oligomers with the endosomal- lysosomal system. a , e Neurons were exposed to AF568-tagged TauO (Red) from AD, PSP, or DLB for 1 h with (+) or without (-) Heparin pretreatment. Cells were fixed and immunostained for a mature neuronal marker (betaIII-tubulin, blue), an early endosomal marker (Rab5, green) ( a ) and a lysosomal marker (LAMP-2, green) ( e ). Representative orthogonal images indicate AF568-tagged TauO co-localized to early endosomes and lysosomes, indicated by arrows. Scale bar: 2 and 10 mum. b - d Pearson's correlation coefficient analysis of internalized AD TauO ( b ), PSP TauO ( c ), DLB TauO ( d ) with early endosome over 1 h was demonstrated with similar experimental conditions and parameters as for ( a ). Each treatment group was randomly imaged in five different regions of interest, and performed in duplicate. f - h Pearson's correlation coefficient analysis of lysosome with internalized AD TauO ( f ), PSP TauO ( g ), and DLB TauO ( h ) was demonstrated, using the same experimental conditions as for ( e ). Image analyses were calculated by unpaired and two-tailed Student's t test. Results showed as the value of mean +- SEM, ** p < 0.01, *** p < 0.001, **** p < 0.0001 vs without (-) Heparin.
- Submitted by
- Invitrogen Antibodies (provider)
- Main image

- Experimental details
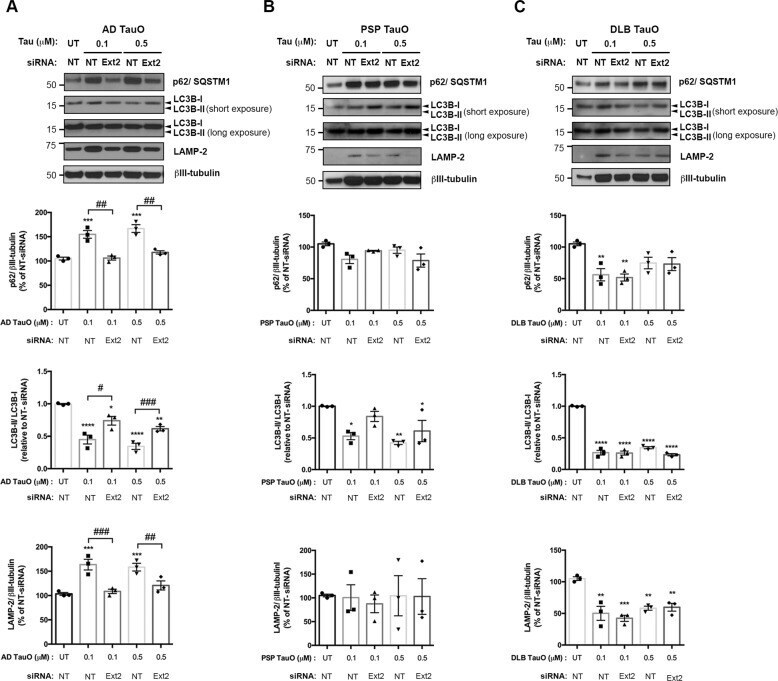
- Fig. 5 Exogenous tau oligomers mediated alternations of autophagy-lysosomal pathway (ALP) in neurons. Cells were pretreated with NT or Ext2 siRNA followed by the presence or absence of 0.1 muM or 0.5 muM biotin-tagged TauO from AD ( a ), PSP ( b ), or DLB ( c ). All experiments were performed with similar conditions and parameters as for Fig. 4f-h (cells pretreated with NT or Ext2 siRNA followed by the presence or absence of 0.1 muM biotin-tagged TauO), together with samples from cells preincubated with NT or Ext2 siRNA followed by 0.5 muM biotin-tagged TauO. Representative Western blot images revealed the expression of p62 (autophagy receptor), LC3B-II (autophagosome membrane formation), and LAMP-2 (lysosome). Quantification of band intensity shown below was normalized to betaIII-tubulin. The same immunoblots probed with loading controls shown in Fig. 4f-h were reused in Fig. 5a-c. a AD TauO-exposed cells showed a significant increase in p62 and LAMP-2 levels, yet a drastic decrease was seen in LC3B-II/LC3B-I ratio. Reverse effects were observed in Ext2 siRNA-pretreated group. b PSP TauO-treated cells slightly changed the expression of p62, but did not alter LAMP-2 expression. LCB-II/LC3B-I ratio was significantly reduced in PSP TauO-treated, while Ext2 siRNA exposure alleviated the PSP TauO effect without reaching statistical significance. c Reductions of p62, LCB-II/LC3B-I ratio, and LAMP-2 were found in DLB TauO-exposed neurons, while the reverse effects from Ext2 siRNA-p
- Submitted by
- Invitrogen Antibodies (provider)
- Main image
- Experimental details
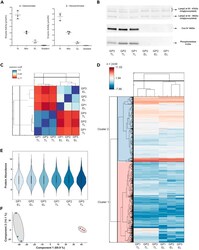
- Figure 2 Expression of protein abundancy and technical reproducibility (A) Beta - galactosidase and Beta - hexosaminidase enzyme activities in adult guinea pig atria (n = 3). Lysosomal hydrolase activities (total Units +- SD) were measured in EL, Mito (which contain dense lysosomes) and as well as TL using artificial 4-MU-substrates. (B) Western blots performed in guinea-pig atrial tissue: LAMP2, COXIV and Phospholamban (n = 3). Identification of lysosome, mitochondria, and SR organelle levels between (TL) and EL fraction. For clarity, only relevant rows and columns are shown. The complete blot is provided in Figure S2 A. (C) Pearson co-efficient correlation plot values show the positive or direct correlation between the reliability of the triplicated samples. (D) Heatmap of z-scored protein abundances (LFQ intensities) of the differentially expressed proteins after unsupervised hierarchical clustering. (E) Violin plot shows distribution of peptide abundance from EL fraction to TL among the triplicates. (F) Principal component analysis (PCA) of the six atrial samples based on their proteomic expression profiles. Each data point represents the total protein groups in each sample as a single vector. The components 1 and 2 represent the spatial resolution among the vectors. The average of vectors corresponds to a point in the K-space. Component one explains 69.9% of the variation, component two 14.1%. Red: TL, Blue: EL. Panels (C and D) generated using Perseus 1.5.2.4 and redraw

- Submitted by
- Invitrogen Antibodies (provider)
- Main image
- Experimental details
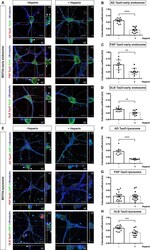
- Fig. 3 Loss of excitatory synapses in hippocampal cell culture is CRH/BDNF/NF-kappaB-dependent. a IHC for Shank2 (green), Vglut1 (red), MAP2 (magenta) (scale bar = 5 um), western blot analysis for all different treatment regimens (CRH; the CRHR1 blocker NBI30775; the corticosterone receptor blocker RU38486; and BDNF) and the relative quantification. b IHC for Shank2 (green), Vglut1 (red), MAP2 (magenta) and CRHR1 (white) with colocalization and trilocalization analysis (scale bar = 5 um). c IHC for phospho-NF-kappaB p65 (green, scale bar = 5 mum) and the relative quantification of the signal within the nuclear compartment. d IHC for phospho-IKB-alpha and the relative quantification of the signal within the cytosolic compartment. e IHC for and compartment analysis of p65. f IHC (left panel) for Shank2 (green), Vglut1 (red), MAP2 (magenta) (scale bar = 5 um), WB of BDNF (right panel) for all different treatment regimens blocking the NF-kappaB pathway (JSH (the translocation blocker JSH- 23); SC (the IKK-beta inhibitor SC-514); and LAC (the NF-kappaB activation blocker lactacystin)) and the relative quantification. g IHC for ATG5, immunoblot analysis of h BCN-1, i LC3, and j Lamp-2 and the relative quantification normalized to beta-actin. k TEM of acquired synapses after 15 min of CRH treatment (arrows indicate membrane-associated vesicles (scale bar = 0.5 um)) and the relative quantification of docked vesicles and multivesicular bodies (MVBs)/synapses (a two-tailed unpaired T -

- Submitted by
- Invitrogen Antibodies (provider)
- Main image
- Experimental details
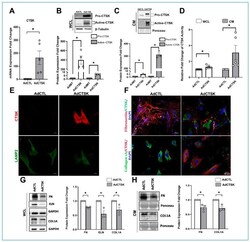
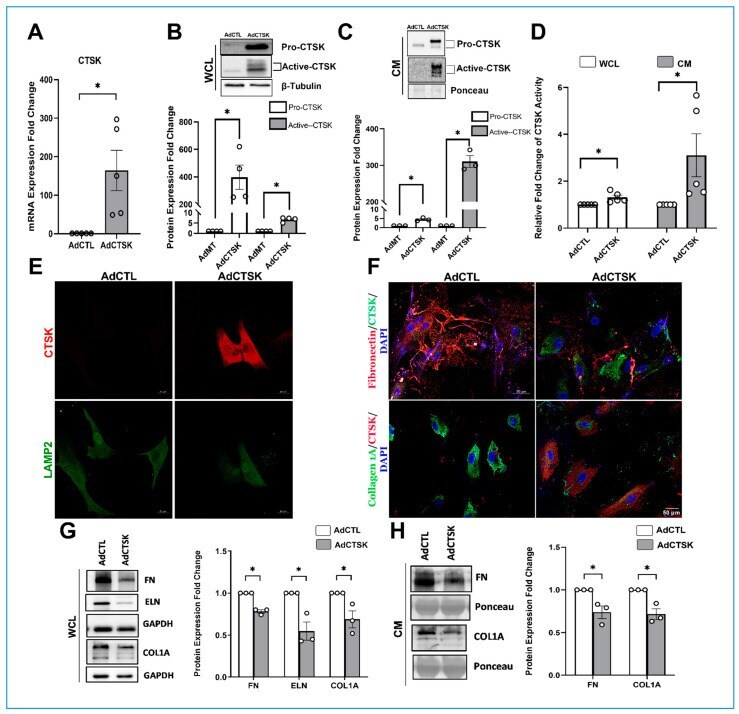
- Figure 5 Effect of constitutive CTSK on the ECM expression and distribution in serum-starved HTM cells. ( A ) Quantification of changes in CTSK mRNA due to adenovirus-mediated constitutive expression of CTSK (AdCTSK) showing a significant increase in CTSK mRNA expression by ~164-fold compared to control (AdCTL). ( B , C ) Quantification of CTSK protein changes in WCL and CM in response to AdCTSK treatment. AdCTSK induced pro-CTSK and active-CTSK protein expression significantly in WCL and CM. Shown in the blot are two bands in the AdCTSK lanes upon resolving longer, indicating endogenous CTSK (bottom band) and the top band due to AdCTSK containing FLAG and His tag. Both endogenous and overexpressed CTSK bands from AdCTSK lanes were utilized. beta-tubulin was used as a loading control for WCL, and Ponceau S-band at 55 kDa was used for the CM. ( D ) CTSK activity assay for changes in CTSK activity measured in WCL and CM from serum-starved HTM cells treated with AdCTSK and AdCTL. A significant increase in CTSK activity was seen in WCL and in CM. ( E ) Analysis of CTSK distribution in response to AdCTSK treatment in serum-starved HTM cells. Immunofluorescence imaging showed AdCTSK induced CTSK (Alexa Flour 568/red) (top panel) expression and distribution compared to AdCTL. No changes in lysosomal distribution were observed due to the increase in CTSK as identified by lysosome-associated membrane protein 2 (LAMP2) staining (Alexa Fluor 488/green) (bottom panel). Images were captur
- Submitted by
- Invitrogen Antibodies (provider)
- Main image
- Experimental details
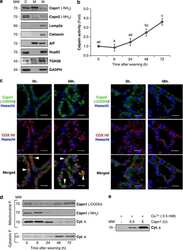
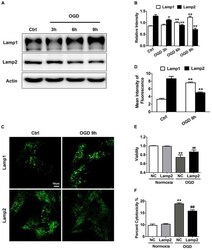
- FIGURE 1 Lamp2 overexpression promotes resistance against OGD stress in cardiomyocytes. (A) Western blotting was performed to detect Lamp1 and Lamp2 levels after OGD treatment for different periods. (B) Quantitative analysis of the immunoblots in (A) . The data represent the mean +- SEM ( n = 5). * P < 0.05 and ** P < 0.01 versus the control group. (C) Representative confocal images of Lamp1 and Lamp2 after OGD treatment for 9 h. Scale bar, 10 mum. (D) Quantitative analysis of the fluorescence in (C) . Mean +- SEM. n = 3. ** P < 0.01 versus the control group. (E) Cell viability was determined with a CCK-8 assay and was normalized to that of the control group. Mean +- SEM. n = 3. ** P < 0.01 versus the normoxia + NC group, ## P < 0.01 versus the OGD + NC group. (F) LDH leakage analysis was performed to determine cell death. Mean +- SEM. n = 3. ** P < 0.01 versus the normoxia + NC group, ## P < 0.01 versus the OGD + NC group.
