Explore
 Validate
 Learn
Learn Western blot
 ELISA
ELISA Immunocytochemistry
Antibody data
- Antibody Data
- Antigen structure
- References [2]
- Comments [0]
- Validations
- Immunocytochemistry [4]
- Flow cytometry [1]
- Other assay [5]
Submit
Validation data
Reference
Comment
Report error
- Product number
- 700261 - Provider product page

- Provider
- Invitrogen Antibodies
- Product name
- c-Met Recombinant Rabbit Monoclonal Antibody (22H22L13)
- Antibody type
- Monoclonal
- Antigen
- Synthetic peptide
- Description
- This antibody is predicted to react with primate based on sequence homology. Intact IgG appears on a non-reducing gel as ~150 kDa band and upon reduction generating a ~25 kDa light chain band and a ~50 kDa heavy chain. Recombinant rabbit monoclonal antibodies are produced using in vitro expression systems. The expression systems are developed by cloning in the specific antibody DNA sequences from immunoreactive rabbits. Then, individual clones are screened to select the best candidates for production. The advantages of using recombinant rabbit monoclonal antibodies include: better specificity and sensitivity, lot-to-lot consistency, animal origin-free formulations, and broader immunoreactivity to diverse targets due to larger rabbit immune repertoire.
- Reactivity
- Human
- Host
- Rabbit
- Isotype
- IgG
- Antibody clone number
- 22H22L13
- Vial size
- 100 μg
- Concentration
- 0.5 mg/mL
- Storage
- Store at 4°C short term. For long term storage, store at -20°C, avoiding freeze/thaw cycles.
Submitted references The HGF-MET axis coordinates liver cancer metabolism and autophagy for chemotherapeutic resistance.
Anti-MET VHH Pool Overcomes MET-Targeted Cancer Therapeutic Resistance.
Huang X, Gan G, Wang X, Xu T, Xie W
Autophagy 2019 Jul;15(7):1258-1279
Autophagy 2019 Jul;15(7):1258-1279
Anti-MET VHH Pool Overcomes MET-Targeted Cancer Therapeutic Resistance.
Su Z, Han Y, Sun Q, Wang X, Xu T, Xie W, Huang X
Molecular cancer therapeutics 2019 Jan;18(1):100-111
Molecular cancer therapeutics 2019 Jan;18(1):100-111
No comments: Submit comment
Supportive validation
- Submitted by
- Invitrogen Antibodies (provider)
- Main image
- Experimental details
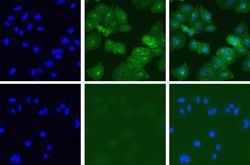
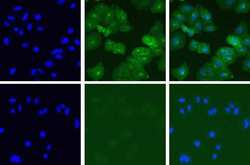
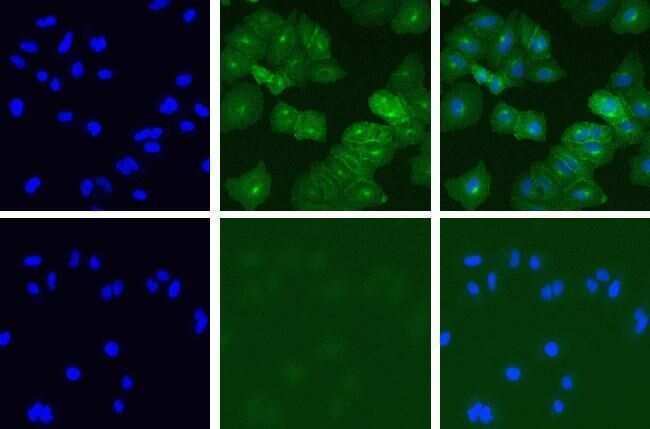
- Immunofluorescent analysis of Met in A549 cells using a Met recombinant rabbit monoclonal antibody (Product # 700261) at a dilution of 5 µg/mL in the absence of peptide (top) or in the presence of the immunogenic peptide (bottom) followed by detection using an Alexa Fluor 488-conjugated goat anti-rabbit secondary antibody at a dilution of 1:1000. Hoechst only (left), AF488 signal only (middle) and composite image (right).
- Submitted by
- Invitrogen Antibodies (provider)
- Main image
- Experimental details
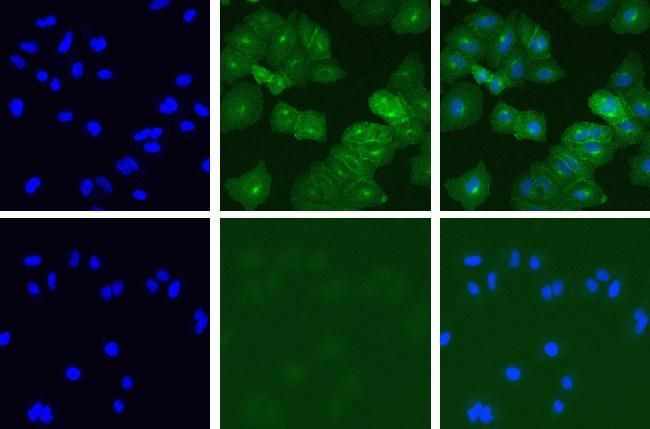
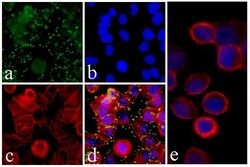
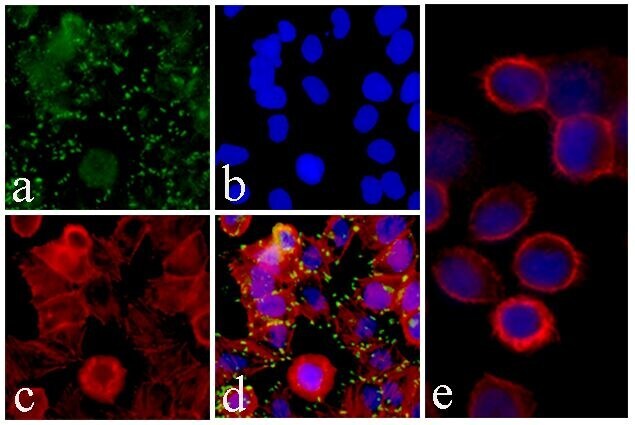
- Immunofluorescent analysis of c-Met was performed on 70% confluent log phase HeLa cells. The cells were fixed with 4% paraformaldehyde for 15 minutes, permeabilized with 0. 25% Triton X-100 for 10 minutes, and blocked with 5% BSA for 1 hour at room temperature. The cells were labeled with c-Met Recombinant Rabbit Monoclonal Antibody (Product # 700261) at a dilution of 1:500 in 1% BSA and incubated for 3 hours at room temperature and then labeled with Alexa Fluor® 488 Goat anti-Rabbit IgG secondary antibody (Product # A-11008) at a dilution of 1:400 for 30 minutes at room temperature (Panel a: green). Nuclei (Panel b: blue) were stained with SlowFade® Gold Antifade Mountant with DAPI (Product # S36938). F-actin (Panel c: red) was stained with Alexa Fluor® 594 phalloidin (Product # A12381) and Panel d is a merged image showing punctated staining on the membrane and panel e is a control without primary antibody. The images were captured using Nikon enabled with cool snap at 20X magnification.

- Submitted by
- Invitrogen Antibodies (provider)
- Main image

- Experimental details
- Immunofluorescent analysis of c-Met was performed on 70% confluent log phase HeLa cells. The cells were fixed with 4% paraformaldehyde for 15 minutes, permeabilized with 0. 25% Triton X-100 for 10 minutes, and blocked with 5% BSA for 1 hour at room temperature. The cells were labeled with c-Met Recombinant Rabbit Monoclonal Antibody (Product # 700261) at a dilution of 1:500 in 1% BSA and incubated for 3 hours at room temperature and then labeled with Alexa Fluor® 488 Goat anti-Rabbit IgG secondary antibody (Product # A-11008) at a dilution of 1:400 for 30 minutes at room temperature (Panel a: green). Nuclei (Panel b: blue) were stained with SlowFade® Gold Antifade Mountant with DAPI (Product # S36938). F-actin (Panel c: red) was stained with Alexa Fluor® 594 phalloidin (Product # A12381) and Panel d is a merged image showing punctated staining on the membrane and panel e is a control without primary antibody. The images were captured using Nikon enabled with cool snap at 20X magnification.
Supportive validation
- Submitted by
- Invitrogen Antibodies (provider)
- Main image
- Experimental details
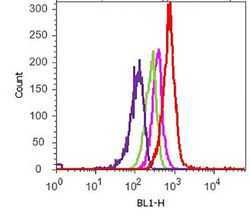
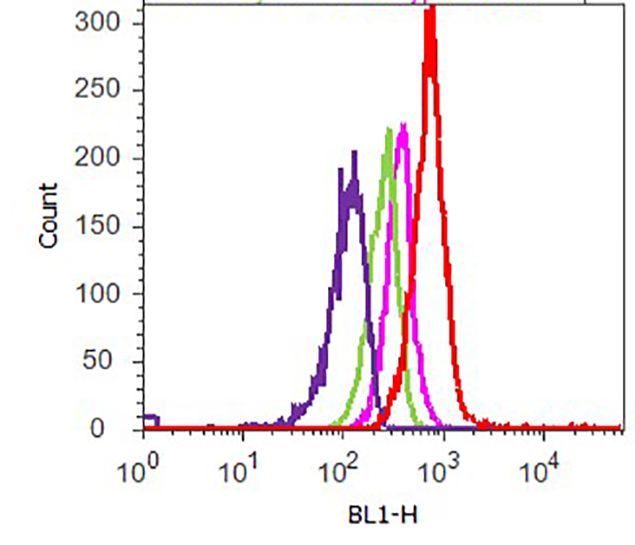
- Flow cytometry analysis of c-Met was performed on A549 cells. Cells were fixed with 70% ethanol for 10 minutes, permeabilized with 0. 25% Tritonª X-100 for 20 minutes, and blocked with 5% BSA for 1 hour at room temperature. Cells were labeled with ABfinityª c-Met recombinant rabbit monoclonal antibody (Product # 700261, red histogram) or with rabbit isotype control (pink histogram) at a dilution of 1:250 in 2.5% BSA. After incubation at room temperature for 3 hours, the cells were labeled with Alexa Fluor¨ 488 goat anti-Rabbit Secondary antibody (Product # A11008) at a dilution of 1:400 for 30 minutes at room temperature. The representative 10,000 cells were acquired and analyzed for each sample using an Attune¨ Acoustic Focusing Cytometer. The purple histogram represents unstained control cells and the green histogram represents no-primary-antibody control.
Supportive validation
- Submitted by
- Invitrogen Antibodies (provider)
- Main image
- Experimental details
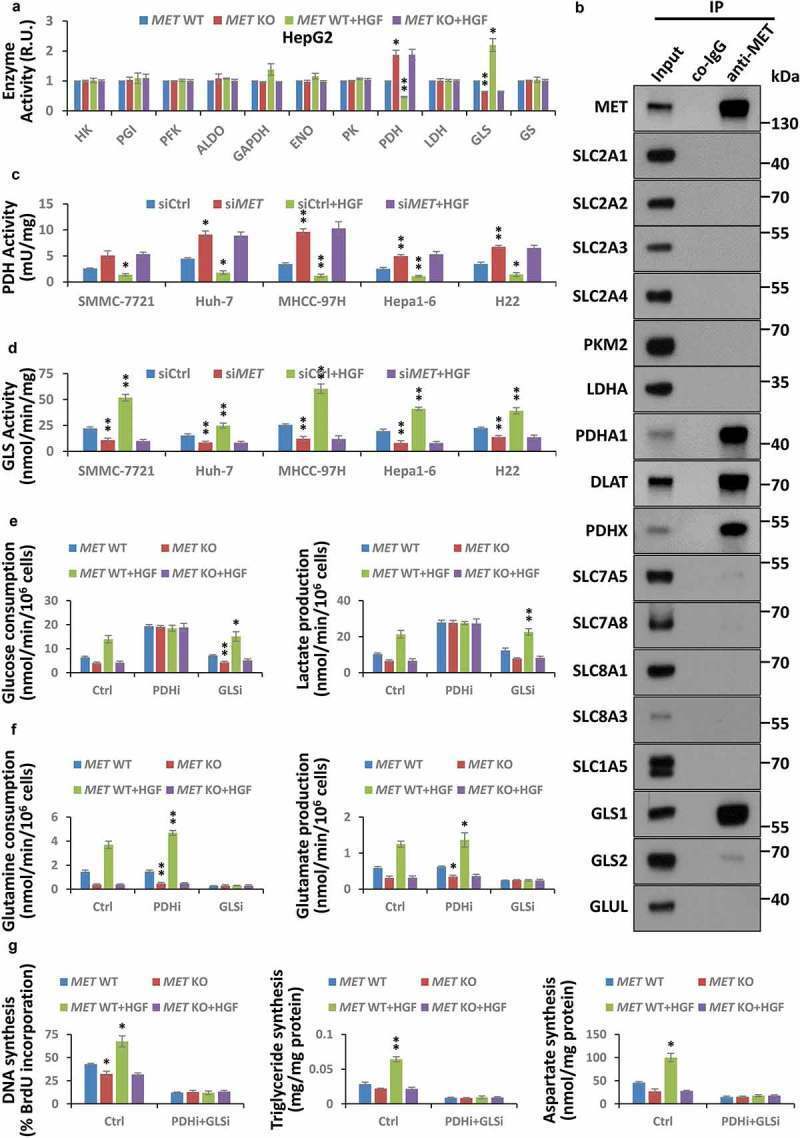
- Figure 2. HGF-MET signaling promotes liver cancer metabolism and biogenesis via PDHC and GLS. (a) Screening for critical enzymes under HGF-MET regulation in cancer metabolism. After starvation overnight, HepG2-derived CRISPR-Cas9 system-mediated vehicle control (MET WT) or MET knockout ( MET KO) cells (5 x 10 4 ) were treated with or without HGF (40 ng/ml) for 2 h, and subsequently subjected to activity analysis for the indicated enzymes. (b) Identification for interaction targets of MET from important enzymes and transporters in cancer metabolism. HepG2 cell lysates (5 x 10 5 ) were subjected to co-immunoprecipitation with anti-MET antibody, and then analyzed by western blot with the indicated antibodies. (c and d) Effect of MET on PDHC and GLS activity in liver cancer cell lines. SMMC-7721, Huh-7, MHCC-97H, Hepa1-6 and H22 cells (2 x 10 4 ) were individually transfected with siRNAs to knock down MET (si MET ) or not (siCtrl). Seventy-two h after transfection, cells were starved overnight, then treated with or without HGF (40 ng/ml) for 2 h, and subsequently subjected to analyze activity of PDHC (c) and GLS (d). (e) Contribution of PDHC and GLS to the HGF-MET signaling-mediated Warburg effect. After pre-incubation with PDHC inhibitor (CPI-613, 100 muM) or GLS inhibitor (BPTES, 100 nM) overnight under starvation, HepG2 MET WT or KO cells (5 x 10 4 ) were treated with or without HGF (40 ng/ml) for 6 h, and subsequently subjected to analysis of glucose consumption and lactate
- Submitted by
- Invitrogen Antibodies (provider)
- Main image
- Experimental details
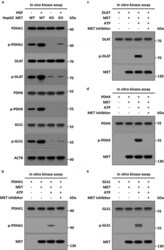
- Figure 3. MET phosphorylates PDHC and GLS in vivo and in vitro . (a) Stimulation of HGF-MET signaling on phosphorylation of PDHC and GLS in vivo . WT and MET KO HepG2 cells (5 x 10 5 ) were individually treated with or without HGF (40 ng/ml) for 2 h, then subjected to immunoprecipitation with anti-PDHA1, anti-DLAT/PDCE2, anti-PDHX and anti-GLS antibodies, and subsequently analyzed by western blot using anti-phospho-tyrosine or the other indicated antobodies. (b-e) Direct phosphorylation effects of MET on PDHC and GLS in vitro . Recombinant HIS-PDHA1 (1 mug) (b), HIS-DLAT/PDCE2 (1 mug) (c), HIS-PDHX (1 mug) (d) or HIS-GLS (1 mug) (e) were individually incubated with FLAG-MET (400 ng) in kinase reaction buffer at 37degC for 45 min, with or without ATP (10 mM) and MET kinase inhibitor (JNJ-38877605, 50 nM). After the reaction, the mixtures were subjected to western blot analysis with anti-phospho-tyrosine or the other indicated antobodies. Abbreviations: PDHA1, pyruvate dehydrogenase E1 alpha 1 subunit; DLAT/PDCE2, dihydrolipoamide S-acetyltransferase; PDHX, pyruvate dehydrogenase complex component X; GLS, glutaminase.

- Submitted by
- Invitrogen Antibodies (provider)
- Main image
- Experimental details
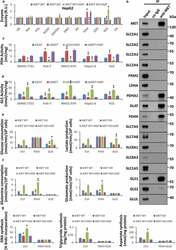
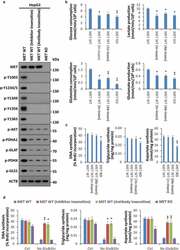
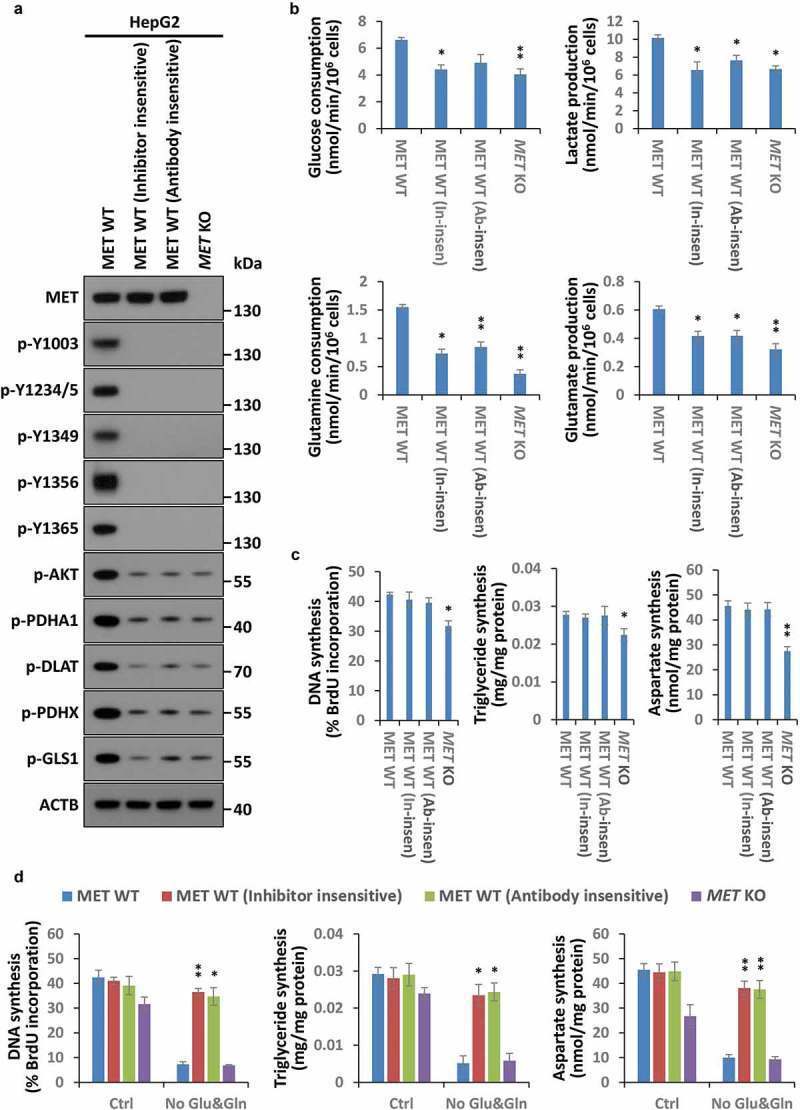
- Figure 4. An atypical cancer biogenesis is actuated in HGF-MET-targeted drug-resistant cells. (a) Analysis of MET kinase activity in MET-targeted inhibitor- or antibody-insensitive cells. After 3 rounds of selection with the MET-specific small molecule inhibitor JNJ-38877605 (50 nM) and anti-MET monoclonal antibody 5D5 (40 mug/ml), MET-targeted inhibitor- or antibody-insensitive HepG2 cells (5 x 10 4 ) were harvested for western blot with the indicated antibodies. WT and MET KO HepG2 cells were used as controls. (b) Assessment of the Warburg effect and glutaminolysis in MET-targeted inhibitor- or antibody-insensitive cells. MET-targeted inhibitor- or antibody-insensitive HepG2 cells (5 x 10 4 ) were subjected to analysis of glucose consumption, lactate production, glutamine consumption and glutamate production. WT and MET KO HepG2 cells were used as controls. (c) Assessment of nucleotide, lipid and amino acid synthesis in MET-targeted inhibitor- or antibody-insensitive cells. MET-targeted inhibitor- or antibody-insensitive HepG2 cells (5 x 10 4 ) were subjected to analysis of DNA, triglyceride and aspartate contents. WT and MET KO HepG2 cells were used as controls. (d) Contribution of glucose and glutamine to biogenesis in HGF-MET-targeted drug-insensitive cells. After being pre-cultured in normal medium or medium without glucose and glutamine for 12 h, HepG2 MET WT or KO and MET-targeted inhibitor- or antibody-insensitive cells (5 x 10 4 ) were individually subjected
- Submitted by
- Invitrogen Antibodies (provider)
- Main image
- Experimental details
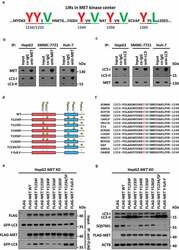
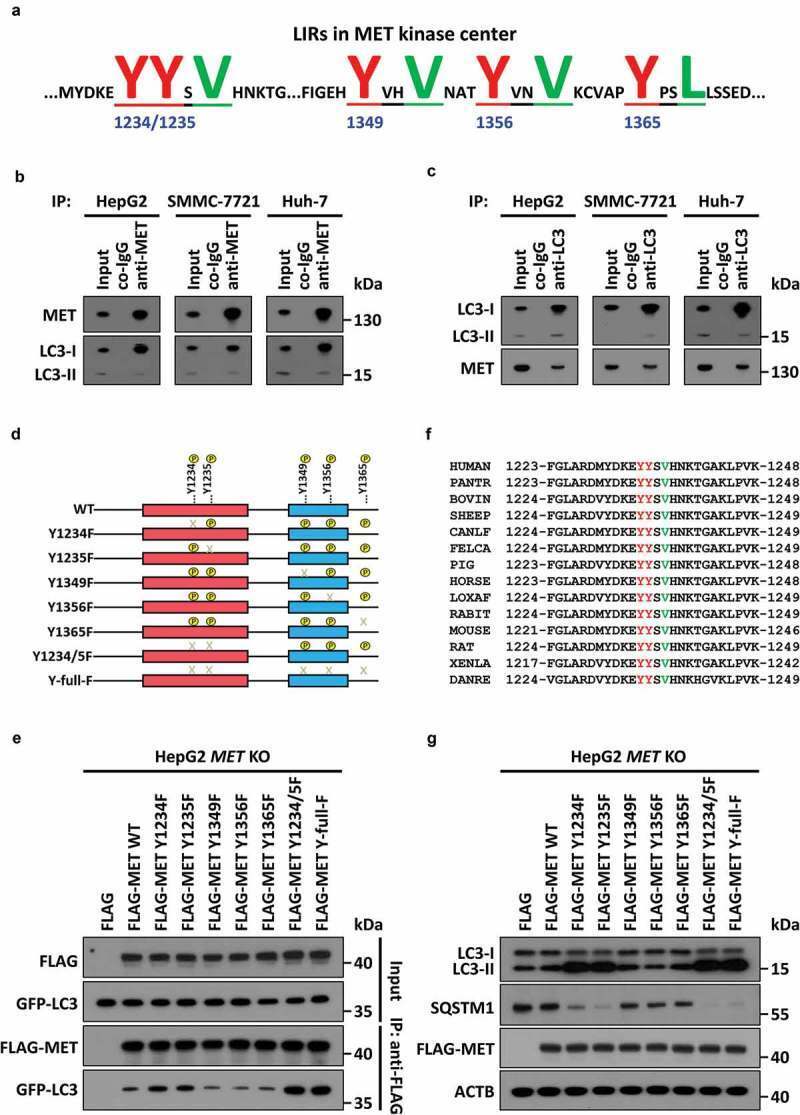
- Figure 6. MET conceals a conserved LIR motif in Y1234/1235 to recruit LC3 and drive autophagy under kinase inhibition. (a) Schema of potential LIR motifs hidden in key tyrosine-phosphorylated modification sites of the MET kinase center. Underlined and capital highlighted letters indicate LIR constitution in MET. (b and c) Endogenous immunoprecipitation assay between MET and LC3. Cell lysates of HepG2, SMMC-7721 and Huh-7 cells (5 x 10 5 ) were individually immunoprecipitated with anti-MET antobody (b) or anti-LC3 antibody (c), and subsequently subjected to western blot analysis with the indicated antibodies. (d) Construction of MET dephosphorylated mutants. Schematic diagrams of MET and its dephosphorylated mutants are depicted as indicated. (e) Identification of Y1234/1235 as key points for MET-LC3 interaction. HepG2 MET KO cells (5 x 10 5 ) were individually co-transfected with vehicle control (Flag), or plasmids encoding WT or dephosphorylated mutants of MET and GFP-LC3. 24 h after transfection, cell lysates were subjected to immunoprecipitation and western blot analysis with the indicated antibodies. (f) Conservative analysis of Y1234, Y1235 and V1237-constituted LIR motif (YYxV) in MET. Alignment of amino acid sequences in evolutionarily different species is shown as indicated, and the YYxV motif is highlighted with red and green letters. (g) Effects of MET dephosphorylated mutants on autophagy. HepG2 MET KO cells (5 x 10 4 ) were individually transfected with vehicle
- Submitted by
- Invitrogen Antibodies (provider)
- Main image
- Experimental details
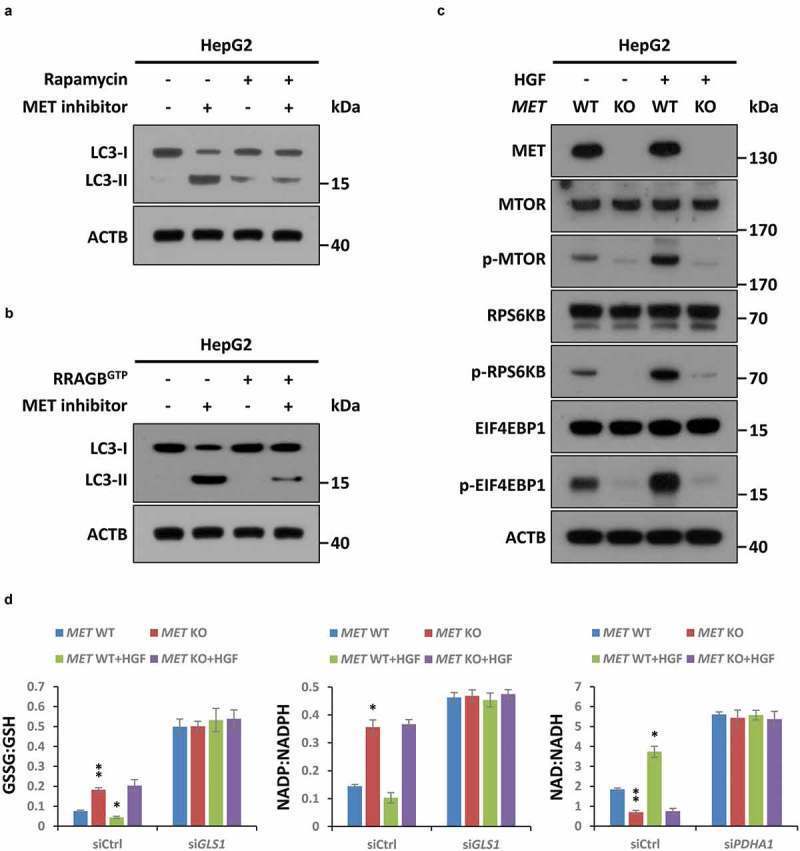
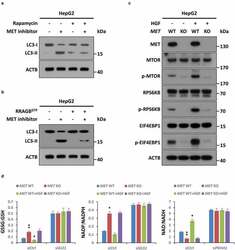
- Figure 7. MTOR signaling is invovled in MET inhibition-induced autophagy. (a) Inhibitory effect of rapamycin on MET inhibition-induced autophagy. After pre-incubation with or without rapamycin (50 nM) for 4 h, HepG2 cells (5 x 10 4 ) were individually treated with an inhibitor of MET (JNJ-38877605, 50 nM) or vehicle control (DMSO) for 8 h, and subsequently subjected to western blot analysis with the indicated antibodies. (b) Rescue effect of MTOR activation on MET inhibition-induced autophagy. HepG2 cells (5 x 10 4 ) were individually transfected with or without a plasmid encoding the constitutively active RRAGB Q99L mutant (RRAGB GTP ) for 48 h, and then treated with inhibitor of MET or vehicle control as above. Cell lysates were subjected to immunoblot with the indicated antibodies. (c) Impact of the HGF-MET axis on MTOR signaling. After stavation overnight, HepG2 MET WT or KO cells (5 x 10 4 ) were individually treated with or without HGF (40 ng/ml) for 2 h, and subsequently subjected to western blot analysis with the indicated antibodies. (d) Contribution of the HGF-MET axis to redox homeostasis through PDHC and GLS. HepG2 MET WT or KO cells (5 x 10 4 ) were individually transfected with GLS -specific siRNA (si GLS ), PDHC-specific siRNA (si PDHA1 ) or non-targeting siRNA control (siCtrl). Seventy-two h after transfection, cells were starved overnight and treated with or without HGF (40 ng/ml) for 6 h, and then subjected to analysis of GSSG:GSH, NADP:NADPH and NAD:NADH