Explore
 Validate
 Learn
Learn Immunocytochemistry
Antibody data
- Antibody Data
- Antigen structure
- References [11]
- Comments [0]
- Validations
- Immunocytochemistry [2]
- Immunohistochemistry [1]
- Flow cytometry [1]
- Other assay [7]
Submit
Validation data
Reference
Comment
Report error
- Product number
- 18-7366 - Provider product page

- Provider
- Invitrogen Antibodies
- Product name
- c-Met Monoclonal Antibody (3D4)
- Antibody type
- Monoclonal
- Antigen
- Synthetic peptide
- Reactivity
- Human
- Host
- Mouse
- Isotype
- IgG
- Antibody clone number
- 3D4
- Vial size
- 500 μL
- Storage
- 4°C
Submitted references Suppressive impact of metronomic chemotherapy using UFT and/or cyclophosphamide on mediators of breast cancer dissemination and invasion.
Hepatocyte Growth Factor-mediated satellite cells niche perturbation promotes development of distinct sarcoma subtypes.
Development of a Novel c-MET-Based CTC Detection Platform.
MET is required for the recruitment of anti-tumoural neutrophils.
Novel receptor tyrosine kinase targeted combination therapies for imatinib-resistant gastrointestinal stromal tumors (GIST).
A novel c-Met inhibitor, MK8033, synergizes with carboplatin plus paclitaxel to inhibit ovarian cancer cell growth.
Tumour micro-environment elicits innate resistance to RAF inhibitors through HGF secretion.
MET and phosphorylated MET as potential biomarkers in lung cancer.
MET and phosphorylated MET as potential biomarkers in lung cancer.
Prognostic significance of c-Met expression in glioblastomas.
The MET receptor tyrosine kinase is a potential novel therapeutic target for head and neck squamous cell carcinoma.
Muñoz R, Hileeto D, Cruz-Muñoz W, Wood GA, Xu P, Man S, Viloria-Petit A, Kerbel RS
PloS one 2019;14(9):e0222580
PloS one 2019;14(9):e0222580
Hepatocyte Growth Factor-mediated satellite cells niche perturbation promotes development of distinct sarcoma subtypes.
Morena D, Maestro N, Bersani F, Forni PE, Lingua MF, Foglizzo V, Šćepanović P, Miretti S, Morotti A, Shern JF, Khan J, Ala U, Provero P, Sala V, Crepaldi T, Gasparini P, Casanova M, Ferrari A, Sozzi G, Chiarle R, Ponzetto C, Taulli R
eLife 2016 Mar 17;5
eLife 2016 Mar 17;5
Development of a Novel c-MET-Based CTC Detection Platform.
Zhang T, Boominathan R, Foulk B, Rao C, Kemeny G, Strickler JH, Abbruzzese JL, Harrison MR, Hsu DS, Healy P, Li J, Pi C, Prendergast KM, Hobbs C, Gemberling S, George DJ, Hurwitz HI, Connelly M, Garcia-Blanco MA, Armstrong AJ
Molecular cancer research : MCR 2016 Jun;14(6):539-47
Molecular cancer research : MCR 2016 Jun;14(6):539-47
MET is required for the recruitment of anti-tumoural neutrophils.
Finisguerra V, Di Conza G, Di Matteo M, Serneels J, Costa S, Thompson AA, Wauters E, Walmsley S, Prenen H, Granot Z, Casazza A, Mazzone M
Nature 2015 Jun 18;522(7556):349-53
Nature 2015 Jun 18;522(7556):349-53
Novel receptor tyrosine kinase targeted combination therapies for imatinib-resistant gastrointestinal stromal tumors (GIST).
Mahadevan D, Theiss N, Morales C, Stejskal AE, Cooke LS, Zhu M, Kurtzman D, Swart R, Ong E, Qi W
Oncotarget 2015 Feb 10;6(4):1954-66
Oncotarget 2015 Feb 10;6(4):1954-66
A novel c-Met inhibitor, MK8033, synergizes with carboplatin plus paclitaxel to inhibit ovarian cancer cell growth.
Marchion DC, Bicaku E, Xiong Y, Bou Zgheib N, Al Sawah E, Stickles XB, Judson PL, Lopez AS, Cubitt CL, Gonzalez-Bosquet J, Wenham RM, Apte SM, Berglund A, Lancaster JM
Oncology reports 2013 May;29(5):2011-8
Oncology reports 2013 May;29(5):2011-8
Tumour micro-environment elicits innate resistance to RAF inhibitors through HGF secretion.
Straussman R, Morikawa T, Shee K, Barzily-Rokni M, Qian ZR, Du J, Davis A, Mongare MM, Gould J, Frederick DT, Cooper ZA, Chapman PB, Solit DB, Ribas A, Lo RS, Flaherty KT, Ogino S, Wargo JA, Golub TR
Nature 2012 Jul 26;487(7408):500-4
Nature 2012 Jul 26;487(7408):500-4
MET and phosphorylated MET as potential biomarkers in lung cancer.
Tretiakova M, Salama AK, Karrison T, Ferguson MK, Husain AN, Vokes EE, Salgia R
Journal of environmental pathology, toxicology and oncology : official organ of the International Society for Environmental Toxicology and Cancer 2011;30(4):341-54
Journal of environmental pathology, toxicology and oncology : official organ of the International Society for Environmental Toxicology and Cancer 2011;30(4):341-54
Prognostic significance of c-Met expression in glioblastomas.
Kong DS, Song SY, Kim DH, Joo KM, Yoo JS, Koh JS, Dong SM, Suh YL, Lee JI, Park K, Kim JH, Nam DH
Cancer 2009 Jan 1;115(1):140-8
Cancer 2009 Jan 1;115(1):140-8
The MET receptor tyrosine kinase is a potential novel therapeutic target for head and neck squamous cell carcinoma.
Seiwert TY, Jagadeeswaran R, Faoro L, Janamanchi V, Nallasura V, El Dinali M, Yala S, Kanteti R, Cohen EE, Lingen MW, Martin L, Krishnaswamy S, Klein-Szanto A, Christensen JG, Vokes EE, Salgia R
Cancer research 2009 Apr 1;69(7):3021-31
Cancer research 2009 Apr 1;69(7):3021-31
No comments: Submit comment
Supportive validation
- Submitted by
- Invitrogen Antibodies (provider)
- Main image

- Experimental details
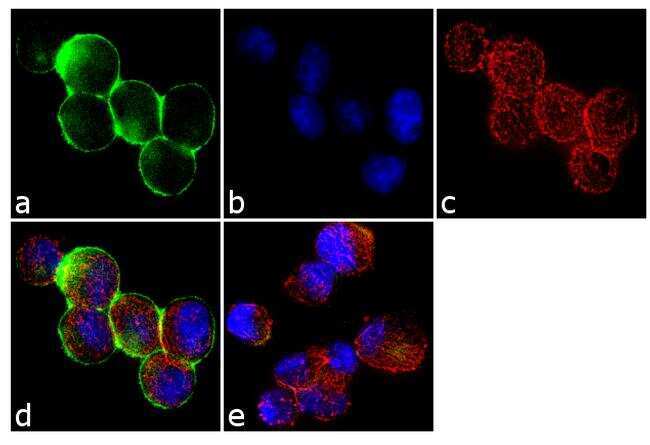
- Immunofluorescence analysis of c-Met was done on 70% confluent log phase MKN45 cells. The cells were fixed with 4% paraformaldehyde for 10 minutes, permeabilized with 0.1% Triton™ X-100 for 10 minutes, and blocked with 1% BSA for 1 hour at room temperature. The cells were labeled c-Met (3D4) Mouse Monoclonal Antibody (187366) at 1:250 dilution in0.1% BSA and incubated for 3 hours at room temperature and then labeled with Goat anti-Mouse IgG (H+L) Superclonal™ Secondary Antibody, Alexa Fluor® 488 conjugate (Product # A28175) at a dilution of 1:2000 for 45 minutes at room temperature (Panel a: green). Nuclei (Panel b: blue) were stained with SlowFade® Gold Antifade Mountant with DAPI (Product # S36938). F-actin (Panel c: red) was stained with Rhodamine Phalloidin (Product # R415, 1:300). Panel d is a merged image showing cytoplasmic localization. Panel e is a no primary antibody control. The images were captured at 60X magnification.
- Submitted by
- Invitrogen Antibodies (provider)
- Main image
- Experimental details
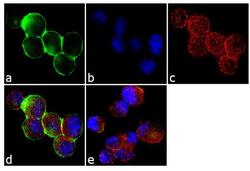
- Immunofluorescence analysis of c-Met was done on 70% confluent log phase MKN45 cells. The cells were fixed with 4% paraformaldehyde for 10 minutes, permeabilized with 0.1% Triton™ X-100 for 10 minutes, and blocked with 1% BSA for 1 hour at room temperature. The cells were labeled c-Met (3D4) Mouse Monoclonal Antibody (187366) at 1:250 dilution in0.1% BSA and incubated for 3 hours at room temperature and then labeled with Goat anti-Mouse IgG (H+L) Superclonal™ Secondary Antibody, Alexa Fluor® 488 conjugate (Product # A28175) at a dilution of 1:2000 for 45 minutes at room temperature (Panel a: green). Nuclei (Panel b: blue) were stained with SlowFade® Gold Antifade Mountant with DAPI (Product # S36938). F-actin (Panel c: red) was stained with Rhodamine Phalloidin (Product # R415, 1:300). Panel d is a merged image showing cytoplasmic localization. Panel e is a no primary antibody control. The images were captured at 60X magnification.

Supportive validation
- Submitted by
- Invitrogen Antibodies (provider)
- Main image

- Experimental details
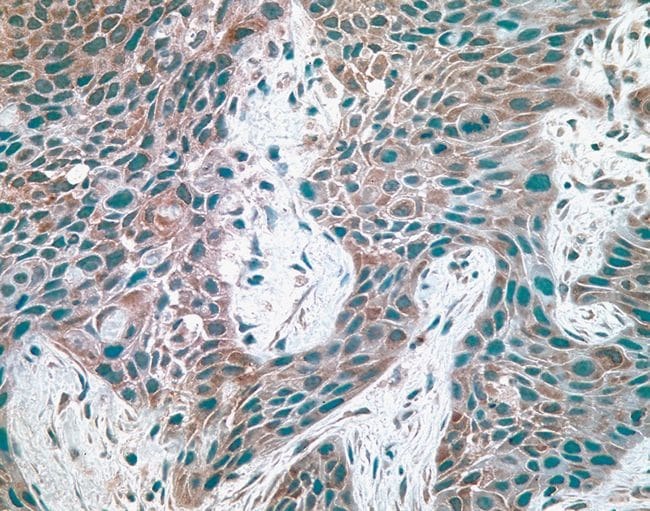
- Human breast carcinoma tissue stained with mouse anti-c-met antibody (18-7366).
Supportive validation
- Submitted by
- Invitrogen Antibodies (provider)
- Main image
- Experimental details
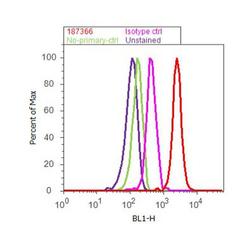
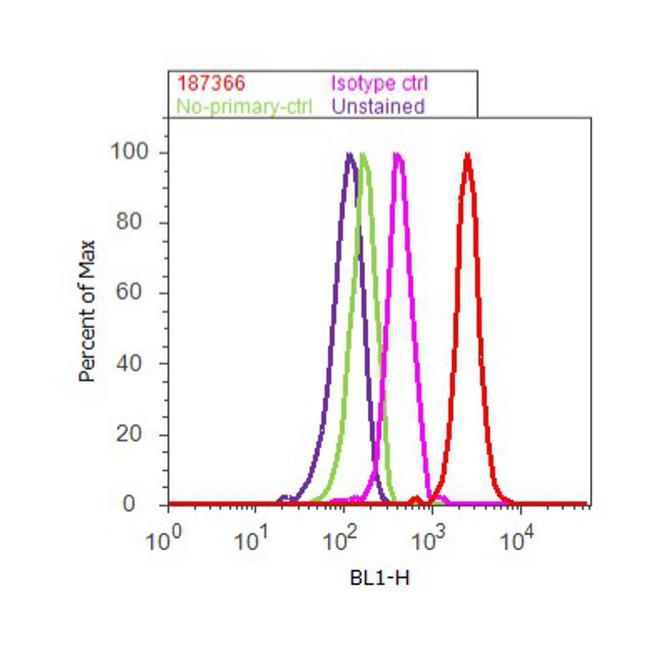
- Flow cytometry analysis of c-Met was done on A549 cells. Cells were fixed with 70% ethanol for 10 minutes, permeabilized with 0.25% Triton™ X-100 for 20 minutes, and blocked with 5% BSA for 30 minutes at room temperature. Cells were labeled with c-Met Mouse Monoclonal Antibody (187366, red histogram) or with mouse isotype control (pink histogram) at 3-5 ug/million cells in 2.5% BSA. After incubation at room temperature for 2 hours, the cells were labeled with Alexa Fluor® 488 Rabbit Anti-Mouse Secondary Antibody (A11059) at a dilution of 1:400 for 30 minutes at room temperature. The representative 10,000 cells were acquired and analyzed for each sample using an Attune® Acoustic Focusing Cytometer. The purple histogram represents unstained control cells and the green histogram represents no-primary-antibody control.
Supportive validation
- Submitted by
- Invitrogen Antibodies (provider)
- Main image
- Experimental details
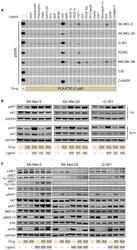
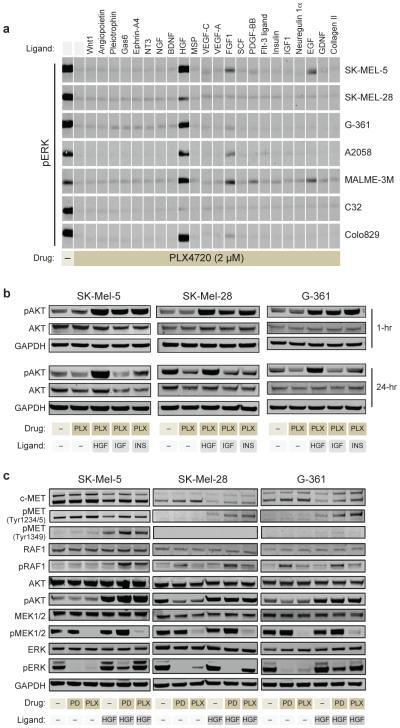
- Figure 4 Characterizing the molecular mechanism of HGF-induced primary resistance a, Activation of ERK by cytokines. Levels of phosphorylated ERK (T202/Y204) were assayed by immunoblotting 1 hour after treatment with media (-) or with 22 cytokines in the presence of PLX4720 or DMSO (DM) control. b, The activation of AKT by HGF, IGF-1 (IGF), and Insulin (INS). Levels of phosphorylated AKT (S473) were assayed 1 hour and 24 hours after treatment with HGF, IGF-1, or insulin in the presence of PLX4720 (2uM). c, Effect of HGF (25ng/ml) on melanoma cell lines treated with 2uM PLX4720 or 1uM PD184352. MAPK and PI3K/AKT pathways activation was assessed after 24 hours of treatment by immunoblot analysis of pRAF1, pMEK, pERK, pAKT and pMET.
- Submitted by
- Invitrogen Antibodies (provider)
- Main image
- Experimental details
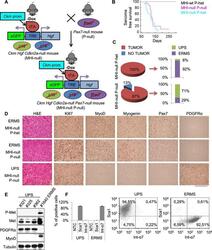
- Figure 4. Genetic ablation of Pax7 results mainly in UPS development. ( A ) Schematic representation of the system used to generate Ckm Hgf Cdkn2a - Pax7 - (MHI- P-) mice. ( B ) Kaplan-Meier curve showing the relative sarcoma-free survival in the indicated genotypes. ( C ) Penetrance (pie charts) and histological distribution (bar graphs) of tumors. ( D ) Representative immunohistochemical analysis of MHI- tumors in Pax7 heterozygous or genetic background. UPS: undifferentiated pleomorphic sarcoma. (Scale bar = 250 um). ( E ) Western blot analysis of murine UPS and ERMS probed for the indicate proteins. ( F ) Sca1 and Int-alpha7 expression analysis in primary murine UPS and ERMS (left panel, single staining; center and right panels, double staining). DOI: http://dx.doi.org/
- Submitted by
- Invitrogen Antibodies (provider)
- Main image
- Experimental details
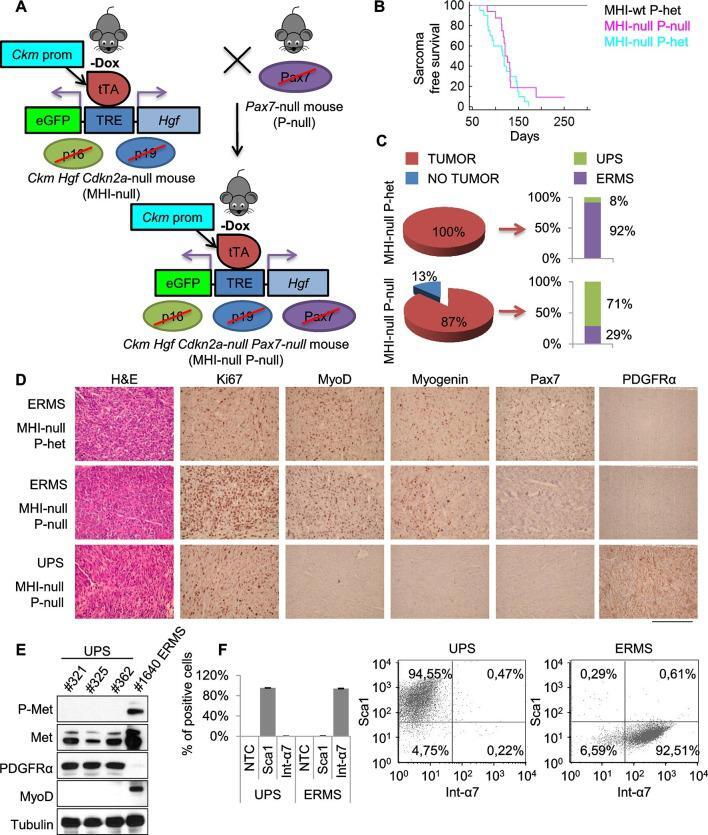
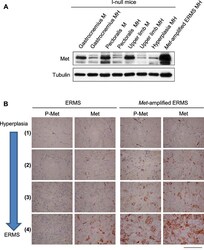
- Figure 5--figure supplement 2. Determination of the level of Met protein and phosphorylation in rhabdomyosarcomagenesis. ( A ) Western blot analysis in the indicated samples of control (MI-) and MHI- mice, probed for the indicate proteins. ( B ) Representative immunohistochemical analysis of Met and P-Met in ERMS carrying or not Met amplification. For the indicated stages of rhabdomyosarcomagenesis see Figure 3D . (Scale bar = 100 um). DOI: http://dx.doi.org/
- Submitted by
- Invitrogen Antibodies (provider)
- Main image

- Experimental details
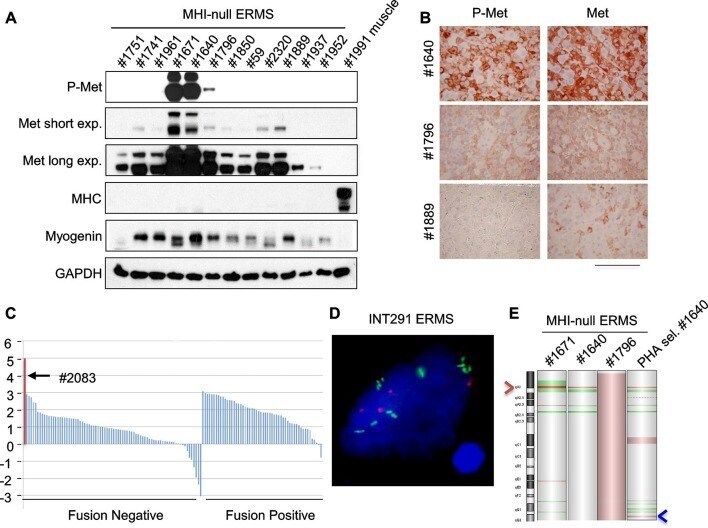
- Figure 5. Only a minor fraction of ERMS harbors MET amplification. ( A ) Western blot analysis in a panel of primary murine MHI- ERMS probed for the indicate proteins. ( B ) Immunohistochemical analysis of primary murine MHI- ERMS shown in A, probed for Met and phosphorylated Met. (Scale bar = 100 um). ( C ) Waterfall plot showing the MET Z-score expression from a panel of previously characterized human RMS tumors ( Shern et al., 2014 ) ( http://pob.abcc.ncifcrf.gov/cgi-bin/JK ). The exceptionally high MET expression in Patient 2083 (highlighted) is associated with focal amplification of chromosome 7q31.2 ( Shern et al., 2014 ). ( D ) FISH for MET in a human ERMS sample (INT291) characterized by small cluster signals (with an average of 9 signals per cell; MET is labeled in green and centromeres in red). ( E ) CGH analysis of murine MHI- ERMS. Red indicates copy number gain, green indicates copy number loss. Arrowheads mark the Met (red) and Kras (blue) loci. DOI: http://dx.doi.org/ Figure 5--figure supplement 1. Transgenic Hgf downmodulation does not impair tumor growth. ( A ) Growth curve (mean +- SEM) of tumors in MHI- mice treated with Dox when tumors became palpable (n=3). ( B ) Representative images of a MHI- mouse described in A. DOI: http://dx.doi.org/ Figure 5--figure supplement 2. Determination of the level of Met protein and phosphorylation in rhabdomyosarcomagenesis. ( A ) Western blot analysis in the indicated samples of control (MI-) and
- Submitted by
- Invitrogen Antibodies (provider)
- Main image

- Experimental details
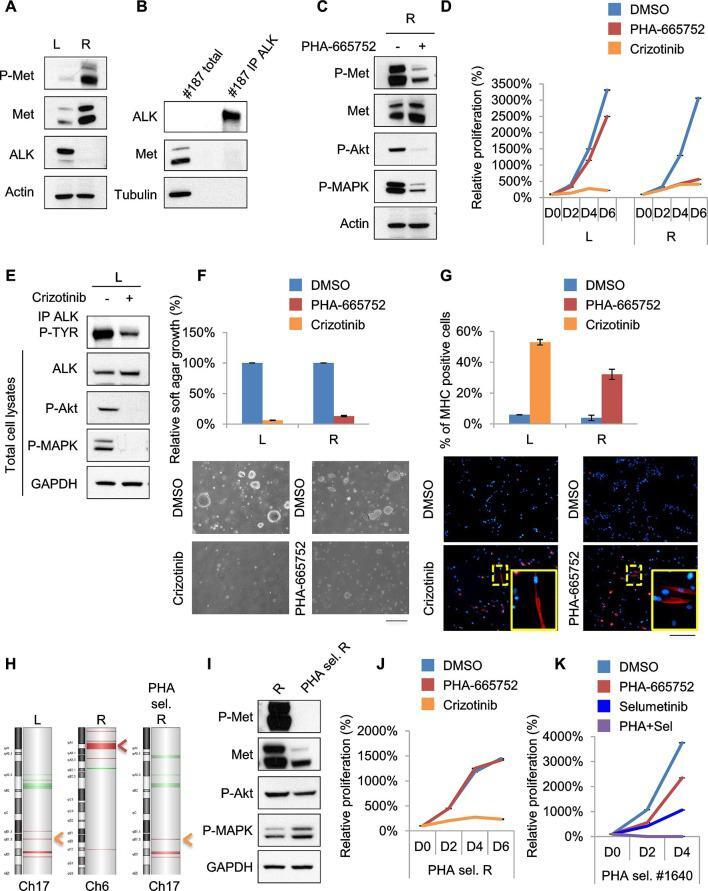
- Figure 7. Treatments based on combination therapy can be effective in preventing ERMS recurrence and clonal evolution. ( A ) Western blot analysis on the indicated proteins in L and R cells. ( B ) Western blot on total lysate and ALK-immunoprecipitated fraction of #187 ERMS tumor. ( C ) Western blot analysis of R cells treated with PHA for 2 hr. ( D ) Proliferation analysis (mean +- SD) of L and R cells treated with the indicated inhibitors. The number of cells at day 0 was set at 100%, representative assay of at least 2 independent experiments. ( E ) Western blot analysis on total cell lysate and ALK-immunoprecipitated fraction of L cells, treated with 500 nM Crizotinib for 2 hr. ( F ) Quantification and representative images of soft agar growth assays of L and R cells treated with the indicated inhibitors. The number of colonies obtained from cells in DMSO control was set at 100% (2 independent experiments, mean +- SEM). (Scale bar = 500 um). ( G ) MHC expression analysis and representative MHC immunostaining of L and R cells, treated with the indicated inhibitors for 3 days (2 independent experiments, mean +- SEM). Dashed areas are shown at threefold magnification. (Scale bar = 250 um). ( H ) CGH analysis of MHI- ERMS cell lines. Red indicates copy number gain, green indicates copy number loss. Arrowheads mark Alk (orange) and Met (red) loci. ( I ) Western blot analysis of R and PHA-selected R cells. ( J ) Proliferation analysis (mean +- SD) of PHA-selected R cells tre
- Submitted by
- Invitrogen Antibodies (provider)
- Main image
- Experimental details
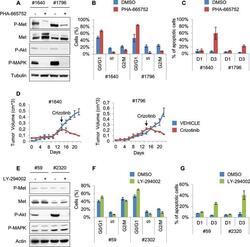
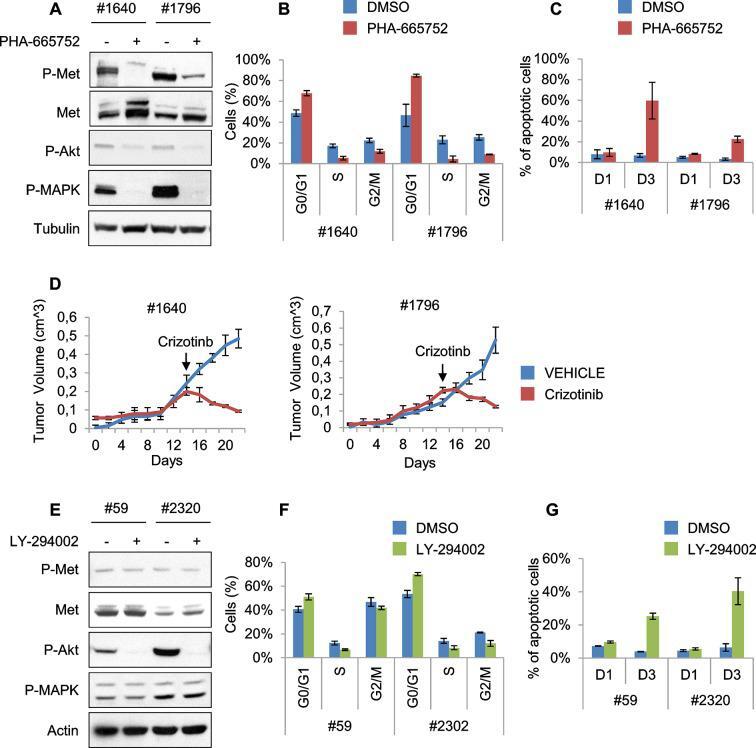
- Figure 6--figure supplement 1. Murine ERMS are genetically heterogeneous, with subsets specifically sensitive to pharmacological inhibition of distinct drivers. ( A ) Western blot analysis of #1640 and #1796 MHI- ERMS cells, treated with PHA for 2 hr. ( B ) Cell cycle distribution of cells treated with PHA for 1 day (2 independent experiments, mean +- SEM). ( C ) Apoptosis assessment in cells treated with PHA for 1 and 3 days (2 independent experiments, mean +- SEM). ( D ) Tumor growth curve (mean +- SEM) of #1640 and #1796 ERMS cells subcutaneously injected in nude mice. Mice were treated with Crizotinib (100 mg/kg/day) starting on the day indicated by the arrow. ( E ) Western blot analysis of #59 and #2320 MHI- ERMS cells, treated with LY for 2 hr. ( F ) Cell cycle distribution of cells treated with LY for 1 day (2 independent experiments, mean +- SEM). ( G ) Apoptosis assessment in cells treated with LY for 1 and 3 days (2 independent experiments, mean +- SEM). DOI: http://dx.doi.org/
- Submitted by
- Invitrogen Antibodies (provider)
- Main image
- Experimental details
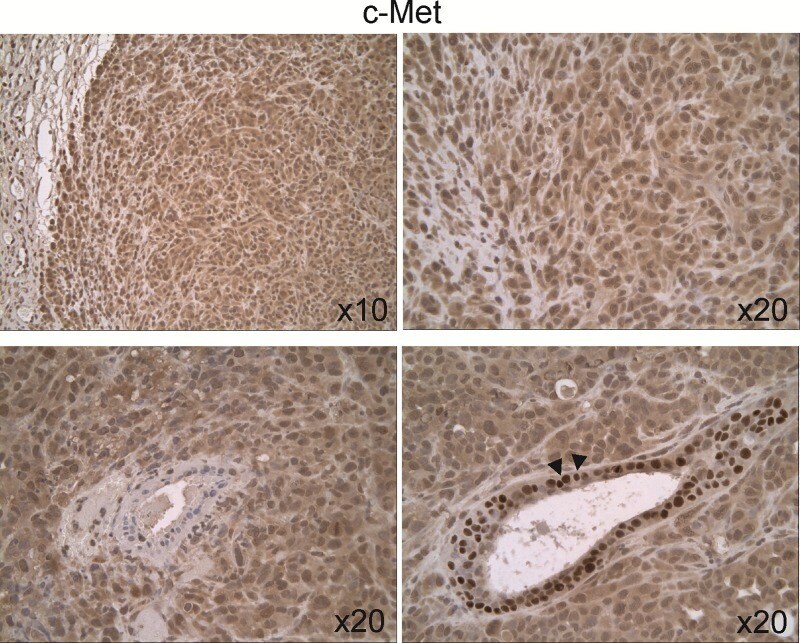
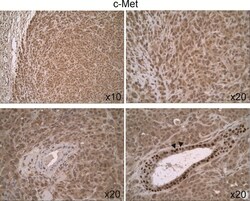
- Fig 5 Expression and cellular distribution of c-Met in untreated 231/LM2-4 tumor xenografts. c-Met staining was relatively homogenous throughout the tumor tissue, and was both cytoplasmic and nuclear. Hyperplastic acini showed cytoplasmic and nuclear staining, with strong staining in the nucleus (down-right arrows).