Explore
 Validate
 Learn
Learn Flow cytometry
 Other assay
Antibody data
- Antibody Data
- Antigen structure
- References [5]
- Comments [0]
- Validations
- Other assay [5]
Submit
Validation data
Reference
Comment
Report error
- Product number
- 11-8858-42 - Provider product page

- Provider
- Invitrogen Antibodies
- Product name
- c-Met Monoclonal Antibody (eBioclone 97), FITC, eBioscience™
- Antibody type
- Monoclonal
- Antigen
- Other
- Description
- Description: The eBioclone 97 monoclonal antibody was generated against a human c-Met-Ig fusion protein, and reacts with human c-Met (HGFR)-transfected cells. Human c-Met is a 145 kDa receptor tyrosine kinase (RTK) expressed by epithelial cells of the brain, kidney, liver and other tissues. Binding of its ligand, Hepatocyte Growth Factor (HGF), triggers receptor autophosphorylation, and activation of several downstream effectors including the mitogen-activated protein kinases ERK-1 and ERK-2, and PLC gamma;. Activation of the c-Met signal transduction pathway leads to mulitple cellular responses including cell motility, scattering, proliferation, survival and angiogenesis. Mutations in human c-Met have been implicated in the development of several malignancies. Applications Reported: This eBioclone 97 antibody has been reported for use in flow cytometric analysis. Applications Tested: This eBioclone 97 antibody has been pre-titrated and tested by flow cytometric analysis of A549 cells. This can be used at 5 µL (1 µg) per test. A test is defined as the amount (µg) of antibody that will stain a cell sample in a final volume of 100 µL. Cell number should be determined empirically but can range from 10^5 to 10^8 cells/test. Excitation: 488 nm; Emission: 520 nm; Laser: Blue Laser. Filtration: 0.2 µm post-manufacturing filtered.
- Reactivity
- Human
- Host
- Rat
- Conjugate
- Green dye
- Isotype
- IgG
- Antibody clone number
- eBioclone 97
- Vial size
- 100 Tests
- Concentration
- 5 µL/Test
- Storage
- 4° C, store in dark, DO NOT FREEZE!
Submitted references Different growth and metastatic phenotypes associated with a cell-intrinsic change of Met in metastatic melanoma.
Establishment and Characterization of Orthotopic Mouse Models for Human Uveal Melanoma Hepatic Colonization.
c-Met inhibitors attenuate tumor growth of small cell hypercalcemic ovarian carcinoma (SCCOHT) populations.
Conditioned medium from umbilical cord mesenchymal stem cells induces migration and angiogenesis.
c-Met signaling promotes IL-6-induced myeloma cell proliferation.
Adachi E, Sakai K, Nishiuchi T, Imamura R, Sato H, Matsumoto K
Oncotarget 2016 Oct 25;7(43):70779-70793
Oncotarget 2016 Oct 25;7(43):70779-70793
Establishment and Characterization of Orthotopic Mouse Models for Human Uveal Melanoma Hepatic Colonization.
Ozaki S, Vuyyuru R, Kageyama K, Terai M, Ohara M, Cheng H, Manser T, Mastrangelo MJ, Aplin AE, Sato T
The American journal of pathology 2016 Jan;186(1):43-56
The American journal of pathology 2016 Jan;186(1):43-56
c-Met inhibitors attenuate tumor growth of small cell hypercalcemic ovarian carcinoma (SCCOHT) populations.
Otte A, Rauprich F, von der Ohe J, Yang Y, Kommoss F, Feuerhake F, Hillemanns P, Hass R
Oncotarget 2015 Oct 13;6(31):31640-58
Oncotarget 2015 Oct 13;6(31):31640-58
Conditioned medium from umbilical cord mesenchymal stem cells induces migration and angiogenesis.
Shen C, Lie P, Miao T, Yu M, Lu Q, Feng T, Li J, Zu T, Liu X, Li H
Molecular medicine reports 2015 Jul;12(1):20-30
Molecular medicine reports 2015 Jul;12(1):20-30
c-Met signaling promotes IL-6-induced myeloma cell proliferation.
Hov H, Tian E, Holien T, Holt RU, Våtsveen TK, Fagerli UM, Waage A, Børset M, Sundan A
European journal of haematology 2009 Apr;82(4):277-87
European journal of haematology 2009 Apr;82(4):277-87
No comments: Submit comment
Supportive validation
- Submitted by
- Invitrogen Antibodies (provider)
- Main image
- Experimental details
- NULL
- Conjugate
- Green dye
- Submitted by
- Invitrogen Antibodies (provider)
- Main image
- Experimental details
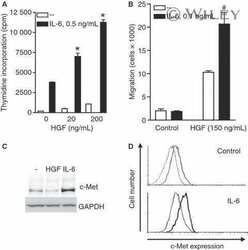
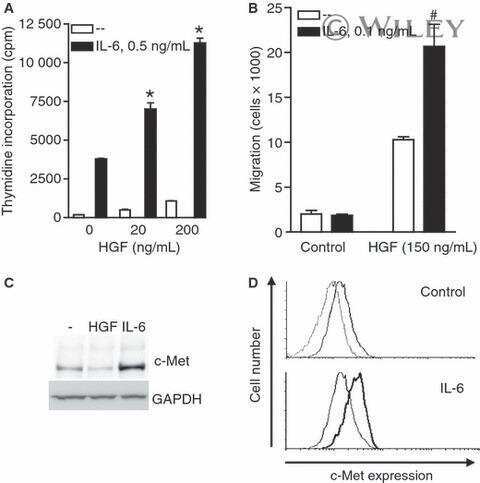
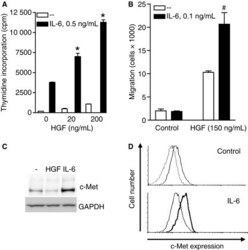
- Figure 1 Synergistic effects between HGF and IL-6 in proliferation and migration of INA-6 cells. (A) INA-6 cells were grown in serum-free media with IL-6 and HGF as indicated for 3 d before estimation of DNA synthesis. Error bars represent SEM of triplicate measurements. * Denotes statistically significant difference from the IL-6 alone situation ( P < 0.05). (B) INA-6 cells were seeded in the top wells of transwell migration chambers. HGF was added to the bottom wells and IL-6 to both top and bottom wells. After 18 h, migration was determined as described in Materials and methods. Error bars represent SEM of duplicate measurements. #Denotes statistical significant difference between HGF with or without IL-6 was not reached ( P -value = 0.14). (C) INA-6 cells were grown in serum-free media with or without 100 ng/mL HGF or 1 ng/mL IL-6 over night, then harvested, lysed, and subjected to gel electrophoresis and Western blotting. The membrane was probed with an anti-c-Met antibody and a GAPDH antibody as loading control. (D) INA-6 cells were grown in serum-free media with or without 1 ng/mL IL-6 over night, labeled with FITC-conjugated antibody against c-Met or isotype control antibody and subjected to flow cytometry analysis. Upper panel - untreated cells labeled with FITC-c-Met antibody (bold line) compared with isotype control antibody (thin line); lower panel - c-Met expression in IL-6 treated cells (bold line) compared to untreated cells (thin line).
- Conjugate
- Green dye

- Submitted by
- Invitrogen Antibodies (provider)
- Main image
- Experimental details
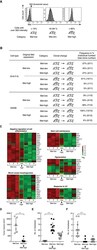
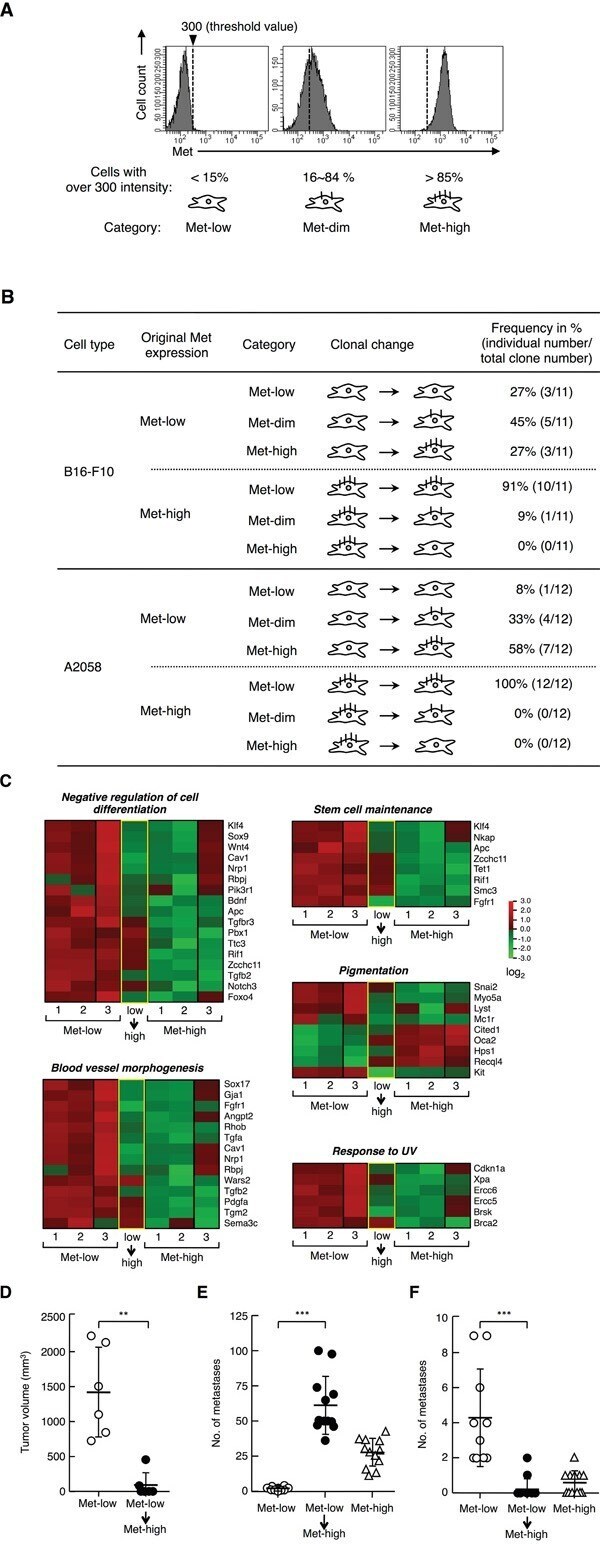
- Figure 6 Clonal change in Met expression, gene expression profile, and tumor characteristics of Met-low and Met-high populations A. Representative histographical profiles defined as ""Met-low,"" ""Met-dim,"" or ""Met-high."" The threshold value for fluorescence intensity for Met expression was set at 300, and the cells were divided into 3 groups: ""Met-low,"" more than 85% of the total cells show a fluorescent intensity of less than 300; ""Met-high,"" more than 85% of the total cells show a fluorescent intensity of more than 300; and, ""Met-dim,"" intermediate cells between Met-low and Met-high. B. Change in Met expression during clonal expansion of B16-F10 and A2058 cells. Met-low and Met-high cells were sorted by flow cytometry, individually subjected to the clonal growth from a single cell, and cell-surface Met expression was analyzed in each population 21 days (B16-F10) or 28 days (A2058) later. Eleven (B16-F10) or twelve (A2058) clonal cell populations derived from Met-low and Met-high cells were analyzed. Met-low or Met-high clonal cells were obtained by independently performed cell sorting in twice. C. Comparison of gene expression profiles between Met-low, Met-high, and the Met-high cells transitted from Met-low (low-high). Among three samples in Met-low or Met-high, the data for two samples (lane 1 and 2) were taken from the same data sets used in Figure 2A and 3D . D. Tumor growth. Tumor growth by Met-low cells (n = 6) and the transitted Met-high cells (Met-low-Met-
- Conjugate
- Green dye
- Submitted by
- Invitrogen Antibodies (provider)
- Main image
- Experimental details
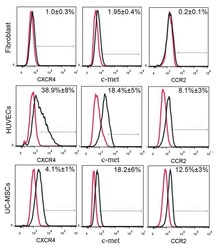
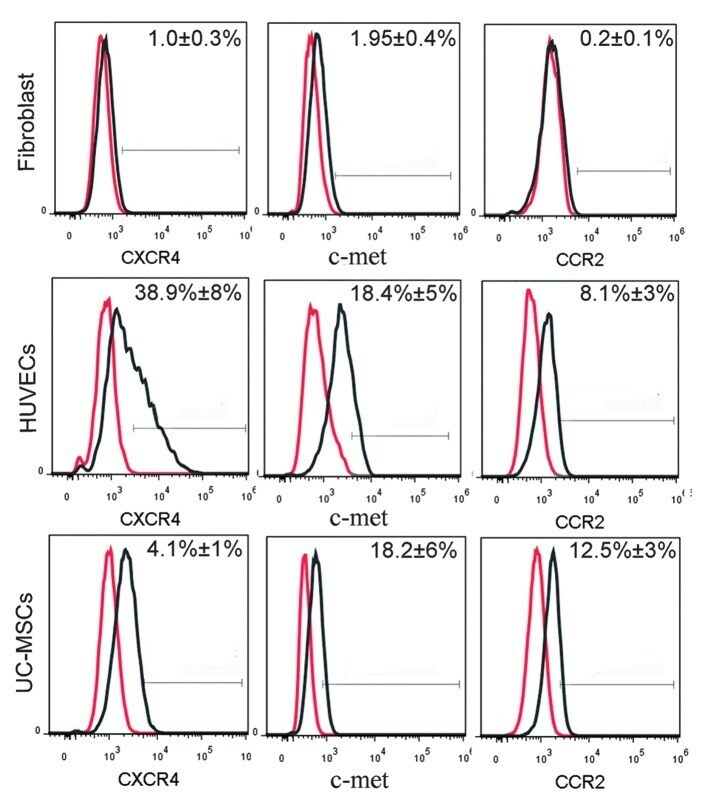
- Figure 4 Analysis of the extracellular expression levels of CXCR4, c-met and CCR2 in fibroblasts, HUVECs and UC-MSC using flow cytometry. The cells were detached using 0.25% trypsin and analyzed using PerCP/Cy5.5-labeled anti-human CCR2, PE-labeled anti-human CXCR4 and fluorescein isothio-cyanate-labeled anti-human c-met antibodies. Red lines represent antibody isotype controls, and black lines represent the expression of the indicated markers. CXCR4, C-X-C chemokine receptor 4; CCR2, C-C chemokine receptor 2; HUVECs, human umbilical vein endothelial cells; UC-MSCs, umbilical cord mesenchymal stem cells.
- Conjugate
- Green dye
- Submitted by
- Invitrogen Antibodies (provider)
- Main image
- Experimental details
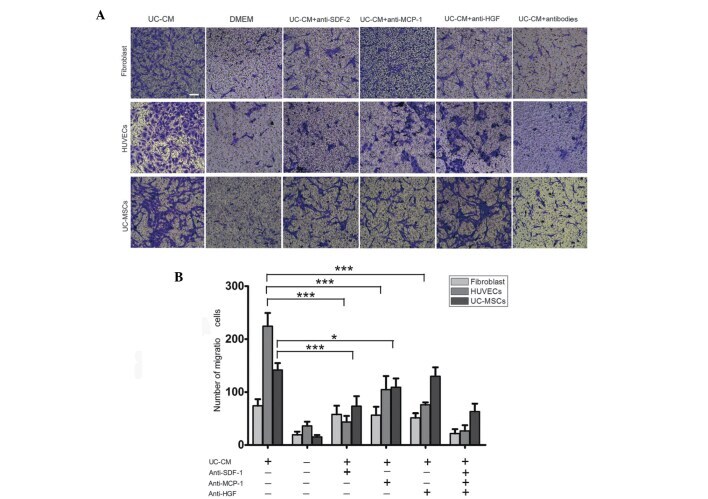
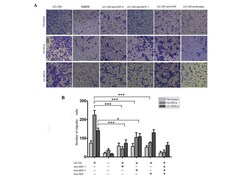
- Figure 5 Migration of fibroblasts, HUVECs and UC-MSCs in response to UC-CM. (A) A total of 5x10 4 cells were collected and allowed to migrate. Lane 1, UC-CM; lane 2, DMEM; lanes 3-6, in the presence or absence of anti-SDF-1 (20 mu g/ml), anti-MCP-1 (20 mu g/ml) or anti-HGF (20 mu g/ml), respectively. Results are from a representative experiment and are expressed as the mean number of migrated cells in three random fields, scale bar=200 mu m. Cells that crossed the matrigel membrane were stained with crystal violet (magnification, x40). (B) Graphical presentation of the quantified data, presented as the number of migrated cells and expressed as the mean +- standard error of the mean. HUVECs, human umbilical vein endothelial cells; UC-MSCs, umbilical cord mesenchymal stem cells; UC-CM, UC-MSCs conditioned medium; DMEM, Dulbecco's modified Eagle's medium; SDF-1, stromal cell-derived factor 1; MCP-1, monocyte chemotactic protein 1; HGF, hepatocyte growth factor.
- Conjugate
- Green dye