Explore
 Validate
 Learn
Learn Flow cytometry
Antibody data
- Antibody Data
- Antigen structure
- References [5]
- Comments [0]
- Validations
- Flow cytometry [1]
- Other assay [9]
Submit
Validation data
Reference
Comment
Report error
- Product number
- 14-8858-82 - Provider product page

- Provider
- Invitrogen Antibodies
- Product name
- c-Met Monoclonal Antibody (eBioclone 97), eBioscience™
- Antibody type
- Monoclonal
- Antigen
- Other
- Description
- Description: 97 monoclonal antibody was generated against a human c-Met-Ig fusion protein, and reacts with human c-Met (HGFR)-transfected cells. Human c-Met is a 145 kDa receptor tyrosine kinase (RTK) expressed by epithelial cells of the brain, kidney, liver and other tissues. Binding of its ligand, Hepatocyte Growth Factor (HGF), triggers receptor autophosphorylation, and activation of several downstream effectors including the mitogen-activated protein kinases ERK-1 and ERK-2, and PLC gamma;. Activation of the c-Met signal transduction pathway leads to mulitple cellular responses including cell motility, scattering, proliferation, survival and angiogenesis. Mutations in human c-Met have been implicated in the development of several malignancies. Applications Reported: This eBioclone 97 antibody has been reported for use in flow cytometric analysis. Applications Tested: This eBioclone 97 antibody has been tested by flow cytometric analysis of human c-Met-transfected cells. This can be used at less than or equal to 1 µg per test. A test is defined as the amount (µg) of antibody that will stain a cell sample in a final volume of 100 µL. Cell number should be determined empirically but can range from 10^5 to 10^8 cells/test. It is recommended that the antibody be carefully titrated for optimal performance in the assay of interest. Purity: Greater than 90%, as determined by SDS-PAGE. Aggregation: Less than 10%, as determined by HPLC. Filtration: 0.2 µm post-manufacturing filtered.
- Reactivity
- Human
- Host
- Rat
- Isotype
- IgG
- Antibody clone number
- eBioclone 97
- Vial size
- 100 µg
- Concentration
- 0.5 mg/mL
- Storage
- 4° C
Submitted references Different growth and metastatic phenotypes associated with a cell-intrinsic change of Met in metastatic melanoma.
Conditioned medium from umbilical cord mesenchymal stem cells induces migration and angiogenesis.
c-Met signaling promotes IL-6-induced myeloma cell proliferation.
Agonistic monoclonal antibodies against the Met receptor dissect the biological responses to HGF.
Intron-exon structure of the MET gene and cloning of an alternatively-spliced Met isoform reveals frequent exon-skipping of a single large internal exon.
Adachi E, Sakai K, Nishiuchi T, Imamura R, Sato H, Matsumoto K
Oncotarget 2016 Oct 25;7(43):70779-70793
Oncotarget 2016 Oct 25;7(43):70779-70793
Conditioned medium from umbilical cord mesenchymal stem cells induces migration and angiogenesis.
Shen C, Lie P, Miao T, Yu M, Lu Q, Feng T, Li J, Zu T, Liu X, Li H
Molecular medicine reports 2015 Jul;12(1):20-30
Molecular medicine reports 2015 Jul;12(1):20-30
c-Met signaling promotes IL-6-induced myeloma cell proliferation.
Hov H, Tian E, Holien T, Holt RU, Våtsveen TK, Fagerli UM, Waage A, Børset M, Sundan A
European journal of haematology 2009 Apr;82(4):277-87
European journal of haematology 2009 Apr;82(4):277-87
Agonistic monoclonal antibodies against the Met receptor dissect the biological responses to HGF.
Prat M, Crepaldi T, Pennacchietti S, Bussolino F, Comoglio PM
Journal of cell science 1998 Jan;111 ( Pt 2):237-47
Journal of cell science 1998 Jan;111 ( Pt 2):237-47
Intron-exon structure of the MET gene and cloning of an alternatively-spliced Met isoform reveals frequent exon-skipping of a single large internal exon.
Lin JC, Naujokas M, Zhu H, Nolet S, Park M
Oncogene 1998 Feb 19;16(7):833-42
Oncogene 1998 Feb 19;16(7):833-42
No comments: Submit comment
Supportive validation
- Submitted by
- Invitrogen Antibodies (provider)
- Main image

- Experimental details
- Staining of human c-Met/GFP-transfected cells with 0.5 µg of Rat IgG1 K Isotype Control Purified (Product # 14-4301-82) (left) or 0.5 µg of Anti-Human c-Met (HGF Receptor) Purified (right) followed by F (ab')2 Anti-Rat IgG PE (Product # 12-4822).Total viable cells were used for analysis.

Supportive validation
- Submitted by
- Invitrogen Antibodies (provider)
- Main image
- Experimental details
- NULL
- Submitted by
- Invitrogen Antibodies (provider)
- Main image
- Experimental details
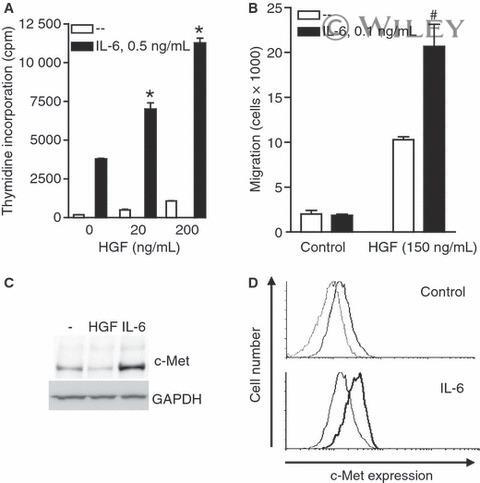
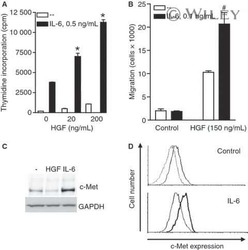
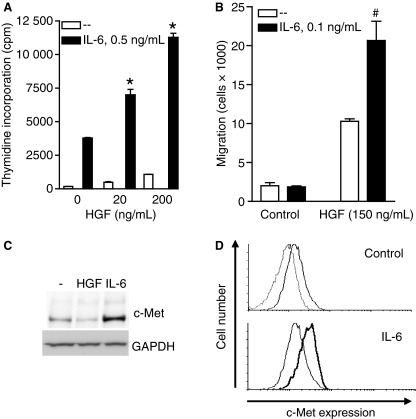
- Figure 1 Synergistic effects between HGF and IL-6 in proliferation and migration of INA-6 cells. (A) INA-6 cells were grown in serum-free media with IL-6 and HGF as indicated for 3 d before estimation of DNA synthesis. Error bars represent SEM of triplicate measurements. * Denotes statistically significant difference from the IL-6 alone situation ( P < 0.05). (B) INA-6 cells were seeded in the top wells of transwell migration chambers. HGF was added to the bottom wells and IL-6 to both top and bottom wells. After 18 h, migration was determined as described in Materials and methods. Error bars represent SEM of duplicate measurements. #Denotes statistical significant difference between HGF with or without IL-6 was not reached ( P -value = 0.14). (C) INA-6 cells were grown in serum-free media with or without 100 ng/mL HGF or 1 ng/mL IL-6 over night, then harvested, lysed, and subjected to gel electrophoresis and Western blotting. The membrane was probed with an anti-c-Met antibody and a GAPDH antibody as loading control. (D) INA-6 cells were grown in serum-free media with or without 1 ng/mL IL-6 over night, labeled with FITC-conjugated antibody against c-Met or isotype control antibody and subjected to flow cytometry analysis. Upper panel - untreated cells labeled with FITC-c-Met antibody (bold line) compared with isotype control antibody (thin line); lower panel - c-Met expression in IL-6 treated cells (bold line) compared to untreated cells (thin line).
- Submitted by
- Invitrogen Antibodies (provider)
- Main image
- Experimental details
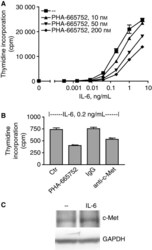
- Figure 3 Inhibition of c-Met signaling reduced IL-6-induced proliferation in ANBL-6 cells. (A and B) ANBL-6 cells were grown in serum-free media for 3 d with combinations of different concentrations of IL-6 and the c-Met tyrosine kinase inhibitor PHA-665752 or 10 mug/mL of an antibody blocking HGF binding to c-Met or 10 mug/mL of a control antibody of the same isotype before estimation of DNA synthesis. The concentration of PHA-665752 in B was 200 n m . Error bars represent SEM of triplicate measurements. In (A) incorporation of thymidine at 50 and 100 n m PHA-665752 were statistically significant different from the control at IL-6 concentrations above 0.1 ng/mL. In (B) * denotes statistically significant difference from the control or IgG-treatment ( P < 0.05). (C) ANBL-6 cells were grown in serum-free media with or without 1 ng/mL IL-6 over night. Immunoblots were probed with antibodies against c-Met and GAPDH.

- Submitted by
- Invitrogen Antibodies (provider)
- Main image
- Experimental details
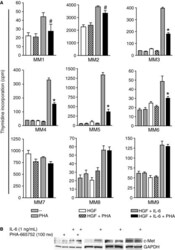
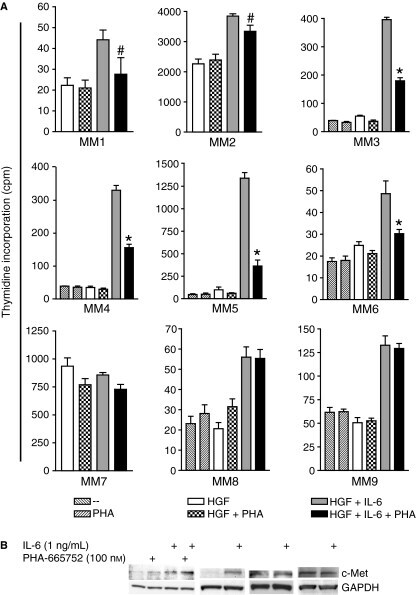
- Figure 4 Inhibition of c-Met by PHA-665752 reduced the effects of IL-6-induced proliferation in purified primary myeloma cells. (A) Purified primary myeloma cells were grown with or without IL-6 or 50 ng/mL HGF in combination with 100 n m PHA-665752 (PHA). The concentrations of IL-6 were 0.1 ng/mL for MM2, 0.5 ng/mL for MM8 and 1 ng/mL for the rest. DNA synthesis was estimated after 2 or 3 d. Error bars represent SEM of triplicate measurements. #The difference in thymidine incorporation between IL-6 with or without PHA-665752 did not reach statistic significance as P -values were 0.13 and 0.08 for MM1 and MM2 respectively. *Denotes statistically significant difference from IL-6 without PHA-665752 ( P < 0.05). (B) Western blots of cells from the patients MM2, 4, 3, and 9 are presented from left to right. Cells were treated the same way as in the thymidine incorporation assays except that serum was omitted and cells lysed after 18 h of incubation. The level of c-Met expression was determined by Western blotting. An anti-GAPDH antibody was used as loading control.
- Submitted by
- Invitrogen Antibodies (provider)
- Main image

- Experimental details
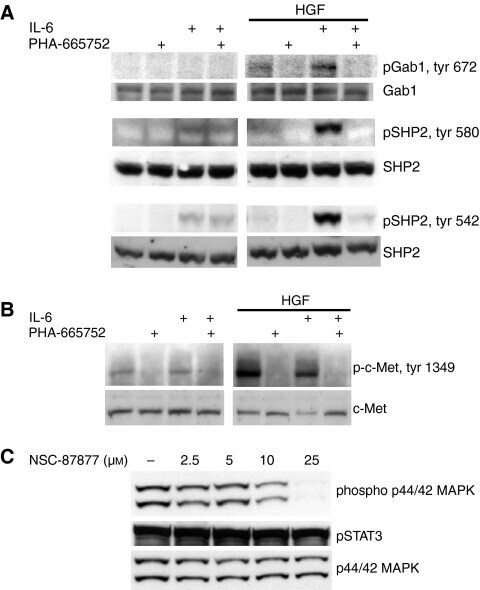
- Figure 6 HGF was necessary for Gab-1-Shp2 activation in ANBL-6 cells. (A) ANBL-6 cells were incubated overnight with a 1 : 750 dilution of anti-HGF serum (to inhibit autocrine HGF-stimulation and subsequently increase c-Met expression), then washed, cultured with or without 200 n m PHA-665752 for 15 min and stimulated for 10 min with or without HGF (100 ng/mL) or IL-6 (1 ng/mL). Lysates were prepared and subjected to Western blot analysis. Membranes were probed with antibodies against phospho-Gab1 tyr 627, phospho-Shp2 tyr 580 or 542. After stripping of membranes, probing with antibodies against total Gab-1 or total Shp2 were used to control gel loading. (B) Cells were treated as in (A). Immunoblots were probed with an antibody detecting phosphorylated tyrosine 1349 of c-Met. After stripping of the membrane, total c-Met level was detected with a c-Met-specific antibody. (C) ANBL-6 cells were preincubated with different concentrations of the Shp2-inhibitor NSC-87877 for 5 h and then stimulated with 1 ng/mL IL-6 for 10 min. Immunoblots were probed with antibodies against phospho-p44/42 MAPK or phospho-STAT3 tyr 705, stripped and reprobed with an antibody against total p44/42 MAPK.
- Submitted by
- Invitrogen Antibodies (provider)
- Main image

- Experimental details
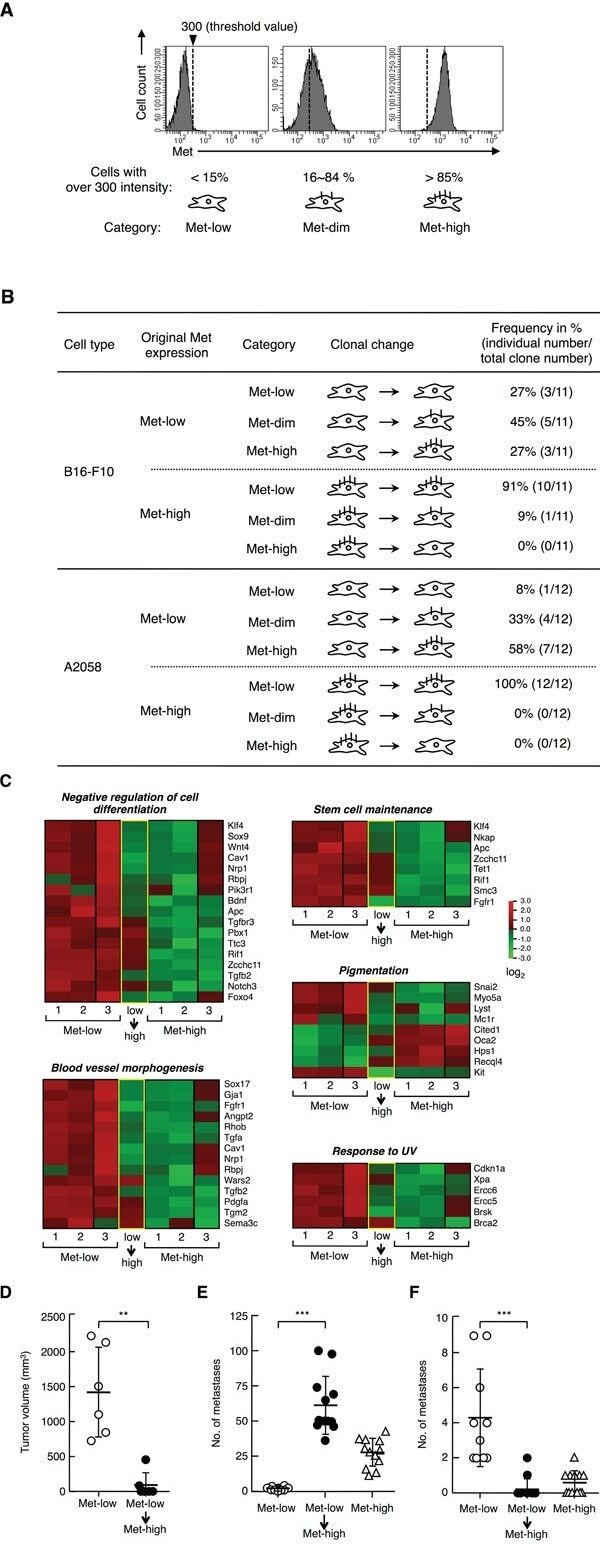
- Figure 6 Clonal change in Met expression, gene expression profile, and tumor characteristics of Met-low and Met-high populations A. Representative histographical profiles defined as ""Met-low,"" ""Met-dim,"" or ""Met-high."" The threshold value for fluorescence intensity for Met expression was set at 300, and the cells were divided into 3 groups: ""Met-low,"" more than 85% of the total cells show a fluorescent intensity of less than 300; ""Met-high,"" more than 85% of the total cells show a fluorescent intensity of more than 300; and, ""Met-dim,"" intermediate cells between Met-low and Met-high. B. Change in Met expression during clonal expansion of B16-F10 and A2058 cells. Met-low and Met-high cells were sorted by flow cytometry, individually subjected to the clonal growth from a single cell, and cell-surface Met expression was analyzed in each population 21 days (B16-F10) or 28 days (A2058) later. Eleven (B16-F10) or twelve (A2058) clonal cell populations derived from Met-low and Met-high cells were analyzed. Met-low or Met-high clonal cells were obtained by independently performed cell sorting in twice. C. Comparison of gene expression profiles between Met-low, Met-high, and the Met-high cells transitted from Met-low (low-high). Among three samples in Met-low or Met-high, the data for two samples (lane 1 and 2) were taken from the same data sets used in Figure 2A and 3D . D. Tumor growth. Tumor growth by Met-low cells (n = 6) and the transitted Met-high cells (Met-low-Met-
- Submitted by
- Invitrogen Antibodies (provider)
- Main image
- Experimental details
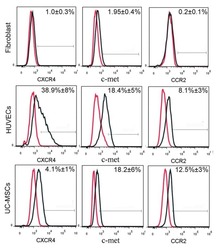
- Figure 4 Analysis of the extracellular expression levels of CXCR4, c-met and CCR2 in fibroblasts, HUVECs and UC-MSC using flow cytometry. The cells were detached using 0.25% trypsin and analyzed using PerCP/Cy5.5-labeled anti-human CCR2, PE-labeled anti-human CXCR4 and fluorescein isothio-cyanate-labeled anti-human c-met antibodies. Red lines represent antibody isotype controls, and black lines represent the expression of the indicated markers. CXCR4, C-X-C chemokine receptor 4; CCR2, C-C chemokine receptor 2; HUVECs, human umbilical vein endothelial cells; UC-MSCs, umbilical cord mesenchymal stem cells.

- Submitted by
- Invitrogen Antibodies (provider)
- Main image
- Experimental details
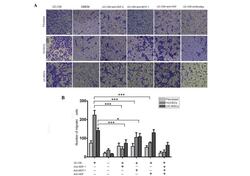
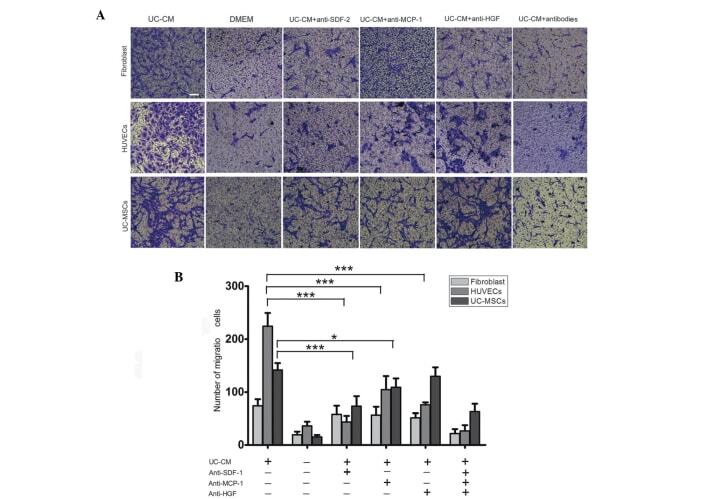
- Figure 5 Migration of fibroblasts, HUVECs and UC-MSCs in response to UC-CM. (A) A total of 5x10 4 cells were collected and allowed to migrate. Lane 1, UC-CM; lane 2, DMEM; lanes 3-6, in the presence or absence of anti-SDF-1 (20 mu g/ml), anti-MCP-1 (20 mu g/ml) or anti-HGF (20 mu g/ml), respectively. Results are from a representative experiment and are expressed as the mean number of migrated cells in three random fields, scale bar=200 mu m. Cells that crossed the matrigel membrane were stained with crystal violet (magnification, x40). (B) Graphical presentation of the quantified data, presented as the number of migrated cells and expressed as the mean +- standard error of the mean. HUVECs, human umbilical vein endothelial cells; UC-MSCs, umbilical cord mesenchymal stem cells; UC-CM, UC-MSCs conditioned medium; DMEM, Dulbecco's modified Eagle's medium; SDF-1, stromal cell-derived factor 1; MCP-1, monocyte chemotactic protein 1; HGF, hepatocyte growth factor.
- Submitted by
- Invitrogen Antibodies (provider)
- Main image

- Experimental details
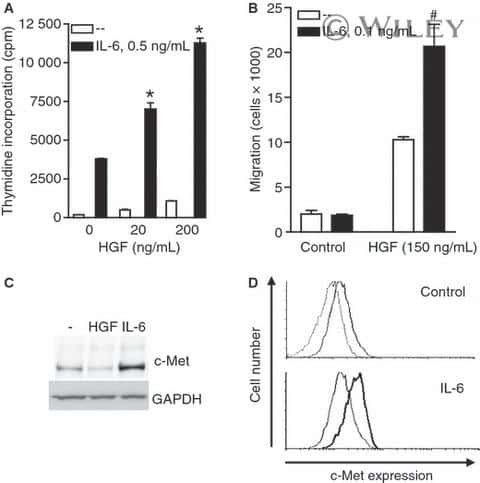
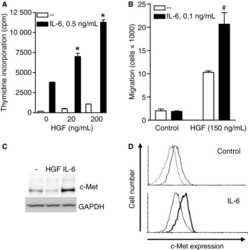
- 1 Synergistic effects between HGF and IL-6 in proliferation and migration of INA-6 cells. (A) INA-6 cells were grown in serum-free media with IL-6 and HGF as indicated for 3 d before estimation of DNA synthesis. Error bars represent SEM of triplicate measurements. * Denotes statistically significant difference from the IL-6 alone situation ( P < 0.05). (B) INA-6 cells were seeded in the top wells of transwell migration chambers. HGF was added to the bottom wells and IL-6 to both top and bottom wells. After 18 h, migration was determined as described in Materials and methods . Error bars represent SEM of duplicate measurements. #Denotes statistical significant difference between HGF with or without IL-6 was not reached ( P -value = 0.14). (C) INA-6 cells were grown in serum-free media with or without 100 ng/mL HGF or 1 ng/mL IL-6 over night, then harvested, lysed, and subjected to gel electrophoresis and Western blotting. The membrane was probed with an anti-c-Met antibody and a GAPDH antibody as loading control. (D) INA-6 cells were grown in serum-free media with or without 1 ng/mL IL-6 over night, labeled with FITC-conjugated antibody against c-Met or isotype control antibody and subjected to flow cytometry analysis. Upper panel - untreated cells labeled with FITC-c-Met antibody (bold line) compared with isotype control antibody (thin line); lower panel - c-Met expression in IL-6 treated cells (bold line) compared to untreated cells (thin line).