Explore
 Validate
 Learn
Learn Western blot
 Flow cytometry
Antibody data
- Antibody Data
- Antigen structure
- References [1]
- Comments [0]
- Validations
- Flow cytometry [1]
- Chromatin Immunoprecipitation [4]
- Other assay [1]
Submit
Validation data
Reference
Comment
Report error
- Product number
- 701168 - Provider product page

- Provider
- Invitrogen Antibodies
- Product name
- SMAD1 Recombinant Rabbit Monoclonal Antibody (12H1L14)
- Antibody type
- Monoclonal
- Antigen
- Synthetic peptide
- Description
- This antibody is predicted to react with equine, mouse, rabbit and rat based on sequence homology. Intact IgG appears on a non-reducing gel as ~150 kDa band and upon reduction generating a ~25 kDa light chain band and a ~50 kDa heavy chain. Recombinant rabbit monoclonal antibodies are produced using in vitro expression systems. The expression systems are developed by cloning in the specific antibody DNA sequences from immunoreactive rabbits. Then, individual clones are screened to select the best candidates for production. The advantages of using recombinant rabbit monoclonal antibodies include: better specificity and sensitivity, lot-to-lot consistency, animal origin-free formulations, and broader immunoreactivity to diverse targets due to larger rabbit immune repertoire.
- Reactivity
- Human, Mouse
- Host
- Rabbit
- Isotype
- IgG
- Antibody clone number
- 12H1L14
- Vial size
- 100 μg
- Concentration
- 0.5 mg/mL
- Storage
- Store at 4°C short term. For long term storage, store at -20°C, avoiding freeze/thaw cycles.
Submitted references Hormone-Responsive BMP Signaling Expands Myoepithelial Cell Lineages and Prevents Alveolar Precocity in Mammary Gland.
Shao C, Lou P, Liu R, Bi X, Li G, Yang X, Sheng X, Xu J, Lv C, Yu Z
Frontiers in cell and developmental biology 2021;9:691050
Frontiers in cell and developmental biology 2021;9:691050
No comments: Submit comment
Supportive validation
- Submitted by
- Invitrogen Antibodies (provider)
- Main image
- Experimental details
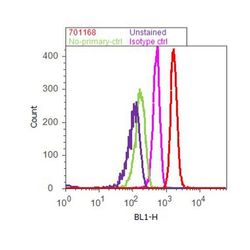
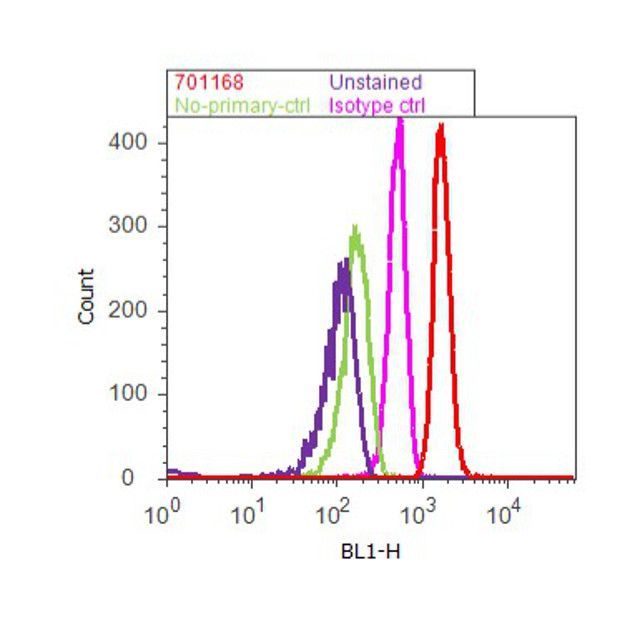
- Flow cytometry analysis of SMAD1 was done on serum starved HeLa cells. Cells were fixed with 70% ethanol for 10 minutes, permeabilized with 0.25% Tritonª X-100 for 20 minutes, and blocked with 5% BSA for 1 hour at room temperature. Cells were labeled with ABfinityª Smad1 Recombinant Rabbit Monoclonal Antibody (701168, red histogram) or with rabbit isotype control (pink histogram) at 1-3 µg/million cells in 2.5% BSA. After incubation at room temperature for 2-3 hours, the cells were labeled with Alexa Fluor¨ 488 Goat Anti-Rabbit Secondary Antibody (A11008) at a dilution of 1:400 for 30 minutes at room temperature. The representative 10,000 cells were acquired and analyzed for each sample using an Attune¨ Acoustic Focusing Cytometer. The purple histogram represents unstained control cells and the green histogram represents no-primary-antibody control.
Supportive validation
- Submitted by
- Invitrogen Antibodies (provider)
- Main image

- Experimental details
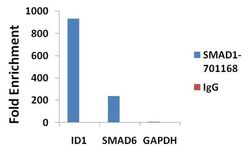
- ChIP- qPCR analysis of SMAD1 was performed with 3 µg/mL of the SMAD1 Recombinant Rabbit Monoclonal Antibody (Product # 701168) on sheared chromatin from 2 million HeLa cells treated with BMP-2 (50 ng/mL for 1h) using the MAGnify Chromatin Immunoprecipitation System (Product # 49-2024). Normal rabbit IgG (3 µg/mL) was used as a negative IP control. The purified DNA from each ChIP sample was analyzed by StepOnePlus Real-Time PCR System (Product # 4376600) with primers for the promoter of active ID-1 and SMAD6 gene, used as positive control targets, and the GAPDH gene, used as negative control target. Data is presented as fold enrichment of the antibody signal versus the negative control IgG using the comparative CT method.

- Submitted by
- Invitrogen Antibodies (provider)
- Main image

- Experimental details
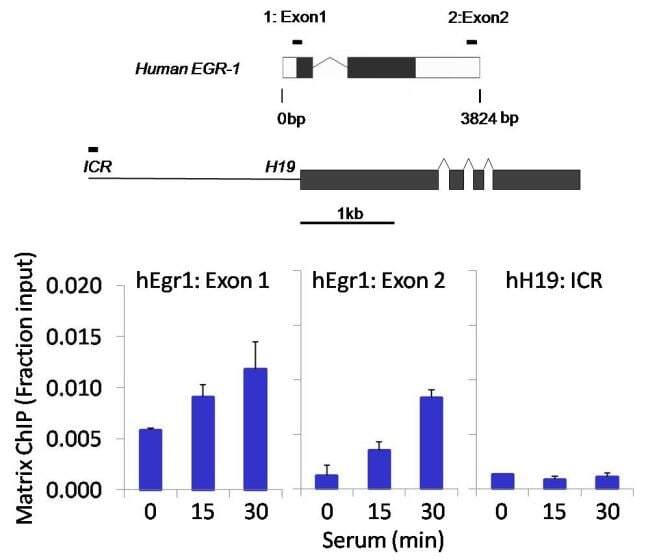
- Chromatin immunoprecipitation analysis of SMAD1 was performed using cross-linked chromatin from 1 x 10^6 HCT116 human colon carcinoma cells treated with serum for 0, 15, and 30 minutes. Immunoprecipitation was performed using a multiplex microplate Matrix ChIP assay (see reference for Matrix ChIP protocol: http://www.ncbi.nlm.nih.gov/pubmed/22098709) with 1.0 µL/100 µL well volume of a SMAD1 rabbit monoclonal antibody (Product # 701168). Chromatin aliquots from ~1 x 10^5 cells were used per ChIP pull-down. Quantitative PCR data were done in quadruplicate using 1 µL of eluted DNA in 2 µL SYBR real-time PCR reactions containing primers to amplify exon-1 or exon-2 of human Egr-1, or the imprinting control region (ICR) of the human H19 locus. PCR calibration curves were generated for each primer pair from a dilution series of sheared total genomic DNA. Quantitation of immunoprecipitated chromatin is presented as signal relative to the total amount of input chromatin. Results represent the mean +/- SEM for three experiments. A schematic representation of the human Egr-1 and H19 loci are shown above the data where boxes represent exons (black boxes = translated regions, white boxes = untranslated regions), the zigzag lines represent introns, and the straight line represents upstream sequence. Regions amplified by Egr-1 and H19 primers are represented by black bars. Data courtesy of the Innovators Program.
- Submitted by
- Invitrogen Antibodies (provider)
- Main image

- Experimental details
- Chromatin immunoprecipitation analysis of SMAD1 was performed using cross-linked chromatin from 1 x 10^6 HCT116 human colon carcinoma cells treated with serum for 0, 15, and 30 minutes. Immunoprecipitation was performed using a multiplex microplate Matrix ChIP assay (see reference for Matrix ChIP protocol: http://www.ncbi.nlm.nih.gov/pubmed/22098709) with 1.0 µL/100 µL well volume of a SMAD1 rabbit monoclonal antibody (Product # 701168). Chromatin aliquots from ~1 x 10^5 cells were used per ChIP pull-down. Quantitative PCR data were done in quadruplicate using 1 µL of eluted DNA in 2 µL SYBR real-time PCR reactions containing primers to amplify exon-1 or exon-2 of human Egr-1, or the imprinting control region (ICR) of the human H19 locus. PCR calibration curves were generated for each primer pair from a dilution series of sheared total genomic DNA. Quantitation of immunoprecipitated chromatin is presented as signal relative to the total amount of input chromatin. Results represent the mean +/- SEM for three experiments. A schematic representation of the human Egr-1 and H19 loci are shown above the data where boxes represent exons (black boxes = translated regions, white boxes = untranslated regions), the zigzag lines represent introns, and the straight line represents upstream sequence. Regions amplified by Egr-1 and H19 primers are represented by black bars. Data courtesy of the Innovators Program.

- Submitted by
- Invitrogen Antibodies (provider)
- Main image
- Experimental details
- ChIP- qPCR analysis of SMAD1 was performed with 3 µg/mL of the SMAD1 Recombinant Rabbit Monoclonal Antibody (Product # 701168) on sheared chromatin from 2 million HeLa cells treated with BMP-2 (50 ng/mL for 1h) using the MAGnify Chromatin Immunoprecipitation System (Product # 49-2024). Normal rabbit IgG (3 µg/mL) was used as a negative IP control. The purified DNA from each ChIP sample was analyzed by StepOnePlus Real-Time PCR System (Product # 4376600) with primers for the promoter of active ID-1 and SMAD6 gene, used as positive control targets, and the GAPDH gene, used as negative control target. Data is presented as fold enrichment of the antibody signal versus the negative control IgG using the comparative CT method.

Supportive validation
- Submitted by
- Invitrogen Antibodies (provider)
- Main image
- Experimental details
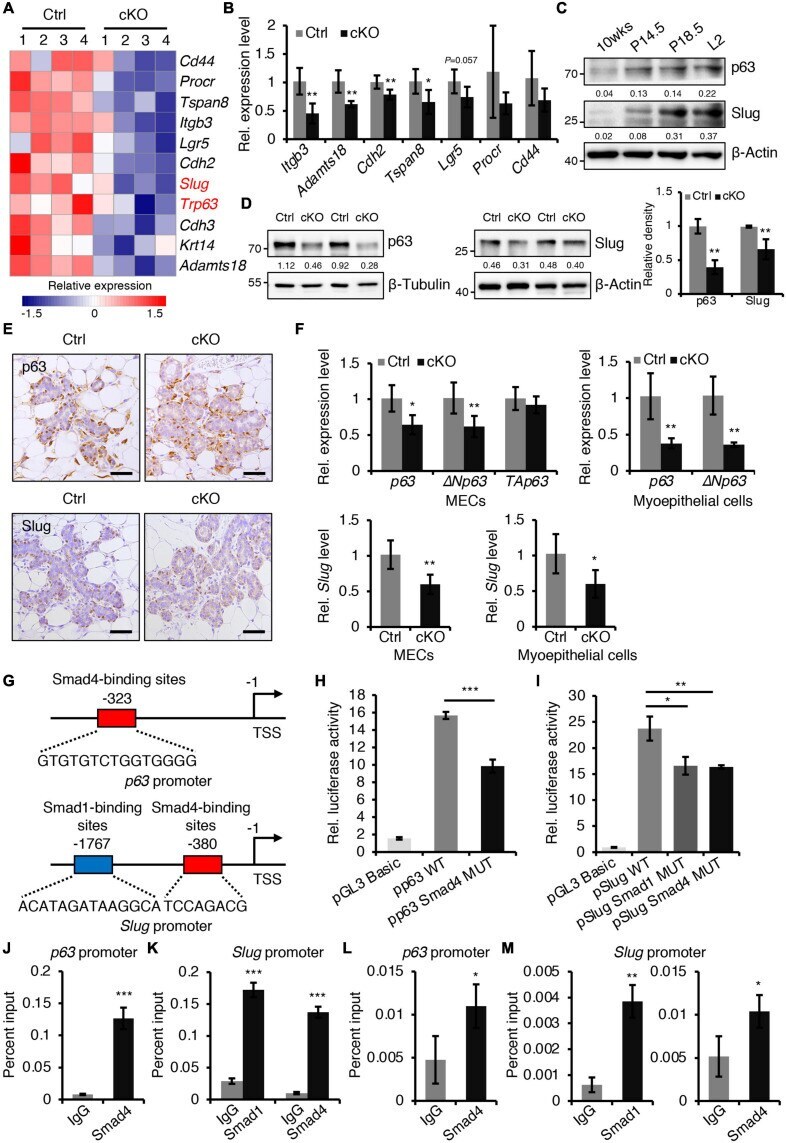
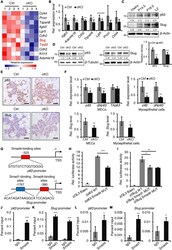
- FIGURE 5 BMPR1a regulated the expression of p63 and Slug through the pSmad1/5-Smad4 complex. (A) Heatmap for myoepithelial layer-related gene expression in control and cKO mammary glands at pregnancy day 14.5. n = 4 mice per group. (B) qRT-PCR analysis of Itgb3, Adamts18, Cdh2, Tspan8, Lgr5, Procr , and Cd44 in FACS-sorted myoepithelial cells from control and cKO mice at pregnancy day 14.5. n = 4-5 biological replicates. (C) Western blotting for p63 and Slug in wild-type mouse mammary glands at the indicated time points (P14.5, pregnancy day 14.5; P18.5, pregnancy day 18.5; L2, lactation day 2). beta-Actin was used as a loading control. (D) Western blotting for p63 and Slug in mammary epithelial cells isolated from control and cKO mice at pregnancy day 14.5. beta-Tubulin and beta-Actin were used as loading controls. Statistical analysis the expression of p63/beta-Tubulin ( n = 3 mice) and Slug/beta-Actin ( n = 4 mice). (E) Immunohistochemistry staining for p63 and Slug in control and cKO mammary glands at pregnancy day 14.5. n = 4 mice per group. Scale bar, 50 mum. (F) qRT-PCR analysis of p63 ,Delta Np63, TAp63 , and Slug in isolated mammary epithelial cells (MECs) and FACS-sorted myoepithelial cells from control and cKO mice at pregnancy day 14.5. n = 4-6 biological replicates. (G) Schematic diagram showing potential Smad4-binding sites (-323 bp) in the p63 promoter and potential Smad1-binding sites (-1767 bp) and Smad4-binding sites (-380 bp) in the Slug promoter. (H) Lucif