 Explore
 Validate
 Learn
Learn Western blot
 Immunocytochemistry
Antibody data
- Antibody Data
- Antigen structure
- References [0]
- Comments [0]
- Validations
- Immunocytochemistry [1]
- Chromatin Immunoprecipitation [1]
- Other assay [4]
Submit
Validation data
Reference
Comment
Report error
- Product number
- 701339 - Provider product page

- Provider
- Invitrogen Antibodies
- Product name
- Ubiquitin Recombinant Rabbit Monoclonal Antibody (10H4L21)
- Antibody type
- Monoclonal
- Antigen
- Synthetic peptide
- Reactivity
- Human
- Host
- Rabbit
- Isotype
- IgG
- Antibody clone number
- 10H4L21
- Vial size
- 100 µg
- Concentration
- 0.5 mg/mL
- Storage
- Store at 4°C short term. For long term storage, store at -20°C, avoiding freeze/thaw cycles.
No comments: Submit comment
Supportive validation
- Submitted by
- Invitrogen Antibodies (provider)
- Main image
- Experimental details
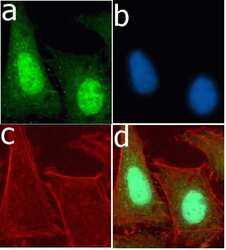
- Immunofluorescent analysis of Ubiquitin in U2OS cells using a Ubiquitin recombinant rabbit monoclonal antibody (Product # 701339) followed by detection using an Alexa Fluor 488-conjugated goat anti-rabbit secondary antibody (green) (Image A). Nuclei were stained using DAPI (Image B) and actin stained with Alexa Fluor 594 phalloidin (red) (image C). Image D is a composite image showing cytoplasmic and nuclear localization of ubiquitin.

Supportive validation
- Submitted by
- Invitrogen Antibodies (provider)
- Main image

- Experimental details
- Chromatin immunoprecipitation analysis of Ubiquitin performed using cross-linked chromatin from 1 x 10^6 HCT116 human colon carcinoma cells treated with serum for 0, 15, and 60 minutes. Immunoprecipitation was performed using a multiplex microplate Matrix ChIP assay (see reference for Matrix ChIP protocol: http://www.ncbi.nlm.nih.gov/pubmed/22098709) with 1.0 µL/100 µL well volume of an Ubiquitin rabbit monoclonal antibody (Product # 710339). Chromatin aliquots from ~1 x 10^5 cells were used per ChIP pull-down. Quantitative PCR data were done in quadruplicate using 1 µL of eluted DNA in 2 µL SYBR real-time PCR reactions containing primers to amplify -15kb upstream of the human Egr-1 locus, or exon-1 or exon-2 of Egr-1. PCR calibration curves were generated for each primer pair from a dilution series of sheared total genomic DNA. Quantitation of immunoprecipitated chromatin is presented as signal relative to the total amount of input chromatin. Results represent the mean +/- SEM for three experiments. A schematic representation of the Egr-1 locus is shown above the data where boxes represent exons (black boxes = translated regions, white boxes = untranslated regions), the zigzag line represents an intron, and the straight line represents upstream sequence. Regions amplified by Egr-1 primers are represented by black bars. Data courtesy of the Innovators Program.

Supportive validation
- Submitted by
- Invitrogen Antibodies (provider)
- Main image

- Experimental details
- NULL

- Submitted by
- Invitrogen Antibodies (provider)
- Main image

- Experimental details
- Extended Data Figure 10 Stability of Gis2-HA and Nog2-HA ( a ) and ( b ) Relative steady state levels of Gis2-HA and Nog2-HA in proteasomal mutants. Data are means +- s.d. of 3 and 5 independent experiments for Gis2-HA and Nog2-HA, respectively (*, P

- Submitted by
- Invitrogen Antibodies (provider)
- Main image

- Experimental details
- FIGURE 7: Western blot analysis shows increased ubiquitination, free ubiquitin, and eEF1alpha expression in cells expressing Ant1. (A) Increased ubiquitination in NP-40 insoluble fractions from cells expressing the wild-type and mutant Ant1. (B) Free ubiquitin levels in cells expressing Ant1. (C, D) eEF1alpha levels in total cell lysate using different detergents (C) and detergent-soluble and -insoluble fractions (D). S, soluble fraction; I, insoluble fraction.

- Submitted by
- Invitrogen Antibodies (provider)
- Main image

- Experimental details
- Figure 6 Neurodegenerative Features of UFM iPSC-Derived Neurons (A) Representative images of staining for ubiquitin and FMRP inside GFP-labeled, isogenic, iPSC-derived neurons with spectrum of CGG repeat sizes corresponding to WT (UFM1-1), classical premutation (UFM1-3), UFM (UFM1-5 and UFM1-9), and FXS (UFM1-11). The iPSC-derived neurons were cultured within murine brain slices for 6 weeks. Ubiquitin (Ubi), red; FMRP, magenta; GFP, green; DAPI, blue. Multiple ubiquitin-positive inclusion bodies (IBs) are detected in UFM lines UFM1-5 and UFM1-9. Punctuated staining of FMRP is observed in UFM1-3, UFM1-5, and UFM1-9. Scale bars, 2 mum. (B) Number of ubiquitin IBs per cell body of GFP-labeled human neuron. IBs >=0.5 mum were counted. Black and gray bars represent FMRP-positive and -negative cells, respectively. Increased number of IBs is observed in both UFM clones but only for cells expressing FMRP. n = 15-50 cells per line coming from three independent rounds of brain slice injections (three mice). Data are presented as mean +- SEM; *** p < 0.0001, unpaired Student's t test. (C) Number of FMRP foci per cell body of GFP-labeled human neuron. FMRP foci >=0.5 mum were counted. For UFM1-9 only cells expressing FMRP are quantified. n = 15-50 cells per line coming from three independent rounds of brain slice injections (three mice). Data are presented as mean +- SEM; *** p < 0.0001, unpaired Student's t test.
