 Explore
 Validate
 Learn
Learn Western blot
 Immunocytochemistry
Antibody data
- Antibody Data
- Antigen structure
- References [2]
- Comments [0]
- Validations
- Immunocytochemistry [2]
- Immunohistochemistry [1]
- Flow cytometry [3]
- Other assay [3]
Submit
Validation data
Reference
Comment
Report error
- Product number
- PA5-26323 - Provider product page

- Provider
- Invitrogen Antibodies
- Product name
- GPX1 Polyclonal Antibody
- Antibody type
- Polyclonal
- Antigen
- Synthetic peptide
- Reactivity
- Human, Mouse, Rat
- Host
- Rabbit
- Isotype
- IgG
- Vial size
- 400 μL
- Concentration
- 1.8 mg/mL
- Storage
- Store at 4°C short term. For long term storage, store at -20°C, avoiding freeze/thaw cycles.
Submitted references Retinal oxidative stress activates the NRF2/ARE pathway: An early endogenous protective response to ocular hypertension.
Oxidative stress and mitochondrial uncoupling protein 2 expression in hepatic steatosis induced by exposure to xenobiotic DDE and high fat diet in male Wistar rats.
Naguib S, Backstrom JR, Gil M, Calkins DJ, Rex TS
Redox biology 2021 Jun;42:101883
Redox biology 2021 Jun;42:101883
Oxidative stress and mitochondrial uncoupling protein 2 expression in hepatic steatosis induced by exposure to xenobiotic DDE and high fat diet in male Wistar rats.
Migliaccio V, Scudiero R, Sica R, Lionetti L, Putti R
PloS one 2019;14(4):e0215955
PloS one 2019;14(4):e0215955
No comments: Submit comment
Supportive validation
- Submitted by
- Invitrogen Antibodies (provider)
- Main image
- Experimental details
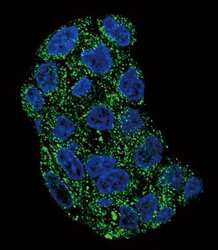
- Immunofluorescent analysis of HepG2 cells using a GPX1 polyclonal antibody (Product # PA5-26323) at a dilution of 1:10-50, followed by a fluor-conjugated goat anti-rabbit secondary antibody (green). Nuclei were stained with DAPI (blue).

- Submitted by
- Invitrogen Antibodies (provider)
- Main image

- Experimental details
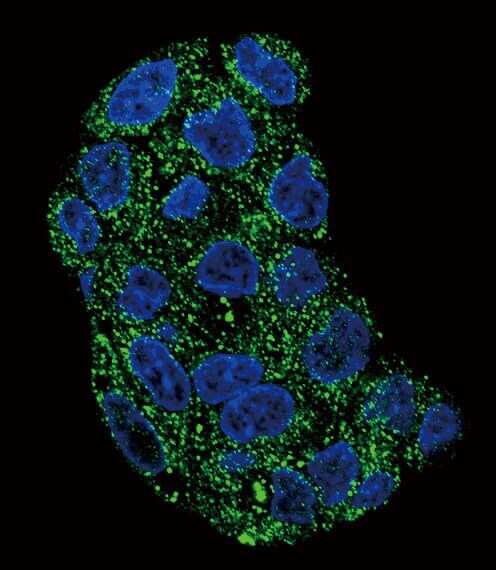
- Immunocytochemistry analysis of GPX1 in HepG2 cells. Samples were incubated in GPX1 polyclonal antibody (Product # PA5-26323) followed by Alexa Fluor 488-conjugated goat anti-rabbit lgG (green). DAPI was used to stain the cell nuclear (blue).
Supportive validation
- Submitted by
- Invitrogen Antibodies (provider)
- Main image
- Experimental details
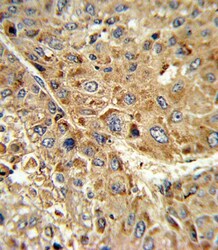
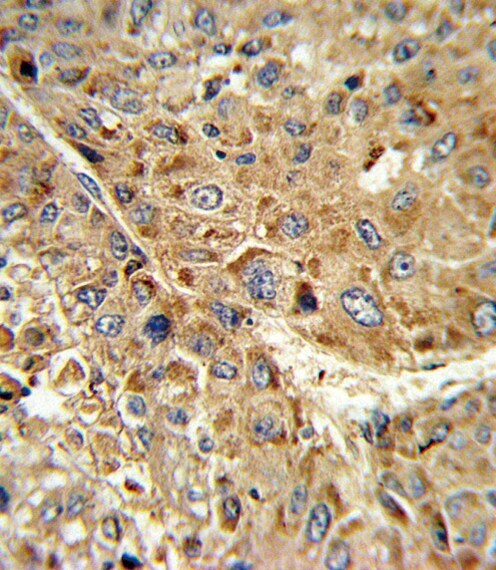
- Immunohistochemistry analysis of GPX1 in formalin-fixed and paraffin-embedded human hepatocarcinoma. Samples were incubated with GPX1 polyclonal antibody (Product # PA5-26323) which was peroxidase-conjugated to the secondary antibody, followed by DAB staining. This data demonstrates the use of this antibody for immunohistochemistry; clinical relevance has not been evaluated.
Supportive validation
- Submitted by
- Invitrogen Antibodies (provider)
- Main image
- Experimental details
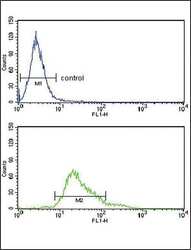
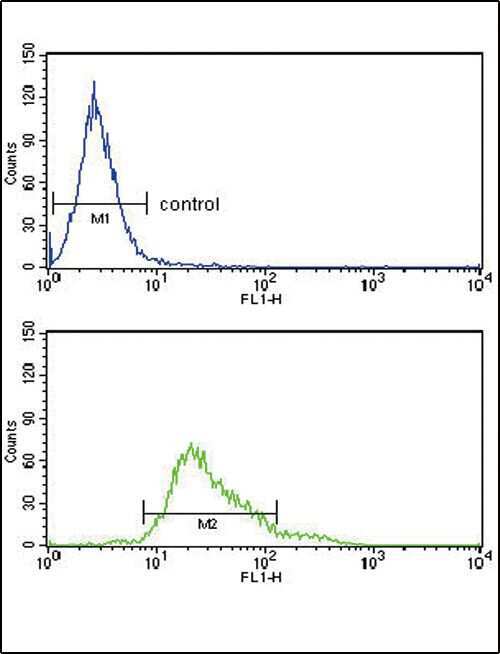
- Flow cytometry analysis of HeLa cells using a GPX1 polyclonal antibody (Product # PA5-26323) (bottom) compared to a negative control cell (top) at a dilution of 1:10-50, followed by a FITC-conjugated goat anti-rabbit antibody
- Submitted by
- Invitrogen Antibodies (provider)
- Main image
- Experimental details
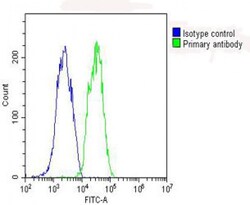
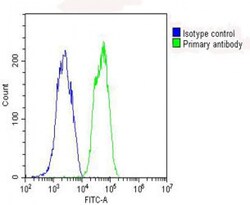
- Flow cytometry of (overlay histogram) of GPX1 in HepG2 cells (green line). Samples were incubated with GPX1 polyclonal antibody (Product # PA5-26323) using a dilution of 1:25 dilution for 60 min at 37°C followed by Goat-Anti-Rabbit IgG, DyLight® 488 Conjugated Highly Cross-Adsorbed at 1:200 dilution for 40 min at 37°C. The cells were fixed with 2% paraformaldehyde (10 min) and then permeabilized with 90% methanol for 10 min. The cells were then incubated in 2% bovine serum albumin to block non-specific protein-protein interactions followed by the primary antibody. Isotype control antibody (blue line) was rabbit IgG (1 μg/1x10^6 cells) used under the same conditions. Acquisition of >10, 000 events was performed.
- Submitted by
- Invitrogen Antibodies (provider)
- Main image
- Experimental details
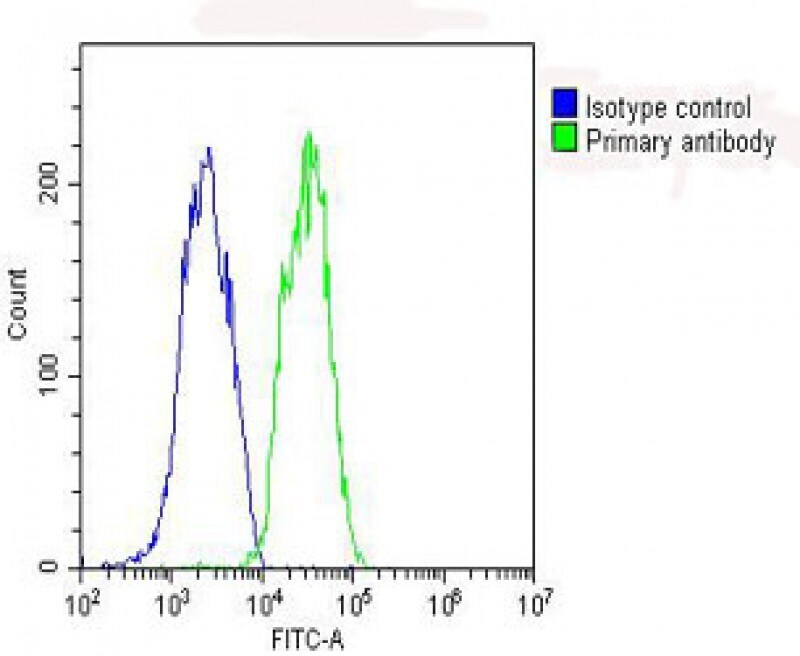
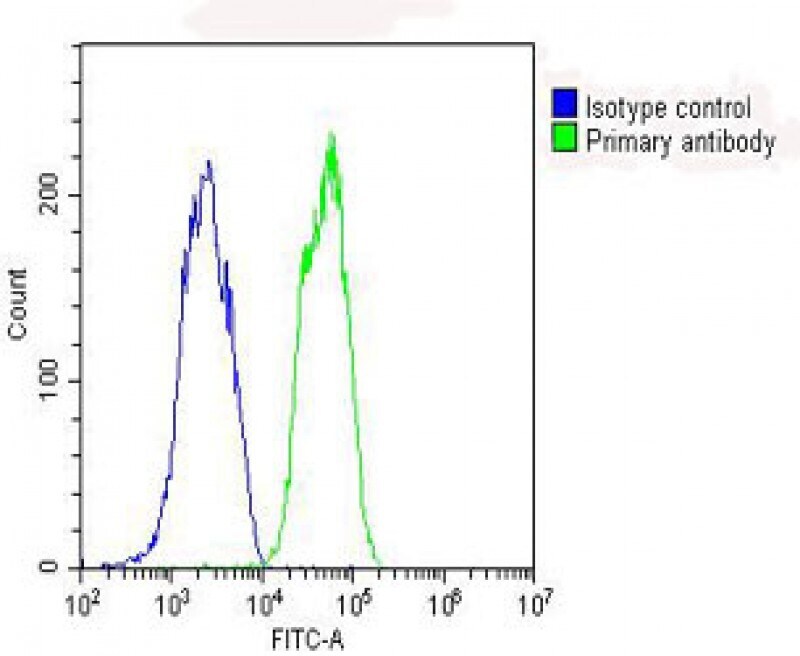
- Flow cytometry of (overlay histogram) of GPX1 in HepG2 cells (green line). Samples were incubated with GPX1 polyclonal antibody (Product # PA5-26323) using a dilution of 1:25 dilution for 60 min at 37°C followed by Goat-Anti-Rabbit IgG, DyLight® 488 Conjugated Highly Cross-Adsorbed at 1:200 dilution for 40 min at 37°C. The cells were fixed with 2% paraformaldehyde (10 min) and then permeabilized with 90% methanol for 10 min. The cells were then incubated in 2% bovine serum albumin to block non-specific protein-protein interactions followed by the primary antibody. Isotype control antibody (blue line) was rabbit IgG (1 μg/1x10^6 cells) used under the same conditions. Acquisition of >10, 000 events was performed.
Supportive validation
- Submitted by
- Invitrogen Antibodies (provider)
- Main image

- Experimental details
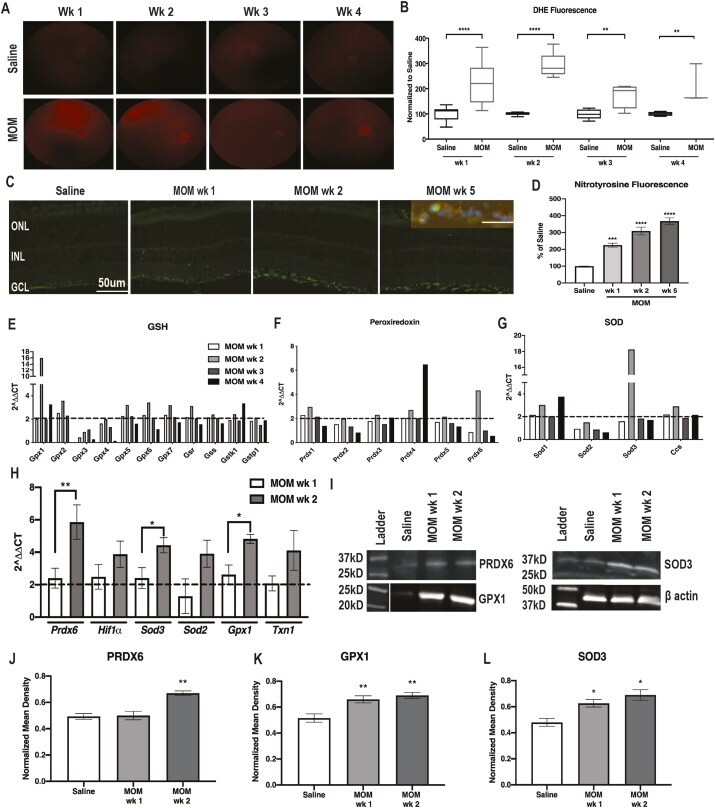
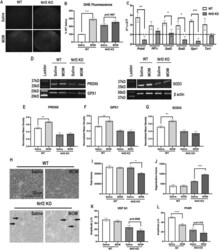
- Fig. 2 ROS and antioxidant proteins increased at 1-wk and 2-wks post-IOP elevation. A) Representative fundus images of DHE fluorescence in all groups. B) Quantification of DHE fluorescence at 1-4 wks post-IOP elevation in comparison to saline-injected controls, showing increases in the microbead injected mice at all time points, **p < 0.001, ****p < 0.0001. C) Fluorescence micrographs of retinas labeled with DAPI (blue) and nitrotyrosine (green). Inset shows double-labeling with anti-nitrotyrosine (green) and anti-NeuN (red). D) Quantification of nitrotyrosine immunofluorescence showing increases at all timepoints after IOP elevation, ***p < 0.001, ****p < 0.0001. E-G) Quantification of fold changes in PCR microarray for: E) GSH-related genes; F) Peroxiredoxin-related genes; and G) SOD-related genes. Dotted line indicates threshold for increase compared to saline. H) Confirmatory qPCR for fold change over saline in antioxidant gene transcription, *p < 0.05, **p < 0.01. I) Representative western blots for beta-actin, PRDX6, SOD3 and GPX1. J-L) Quantification of PRDX6, SOD3 and GPX1, respectively, after normalization to beta-actin, *p < 0.05, **p < 0.001. (For interpretation of the references to color in this figure legend, the reader is referred to the Web version of this article.) Fig. 2
- Submitted by
- Invitrogen Antibodies (provider)
- Main image
- Experimental details
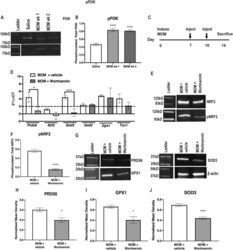
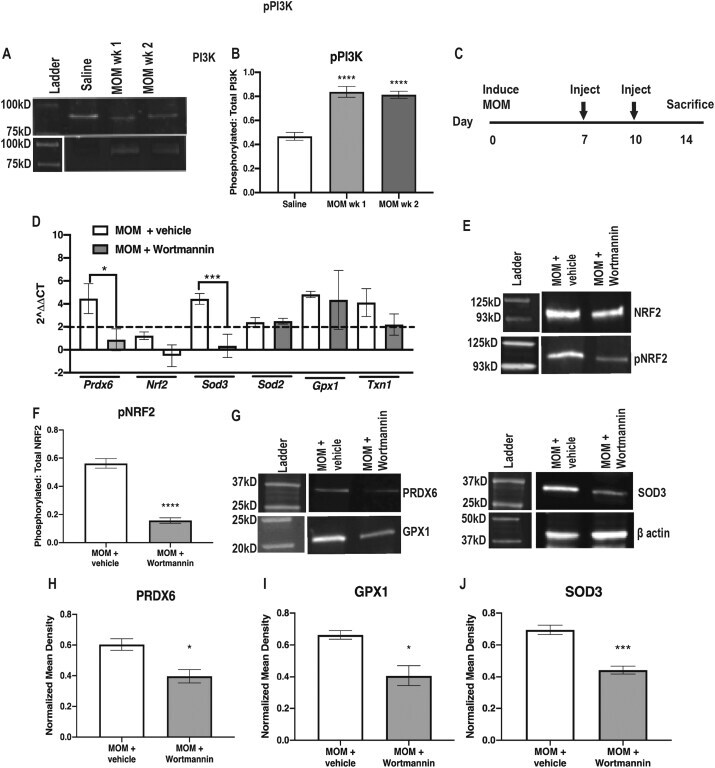
- Fig. 5 PI3K-dependent NRF2 phosphorylation. A) Representative western blots of PI3K and pPI3K B) Quantification of pPI3K to total PI3K, ****p < 0.00001. C) Experiment timeline. D) Representative western blots of pNRF2 to total NRF2. E) Quantification of pNRF2 to total NRF2, ****p < 0.00001. F) Quantification of antioxidant gene transcription shown as fold change over saline, *p < 0.05, ***p < 0.0001. G) Representative western blots for beta-actin, PRDX6, SOD3 and GPX1. H-J) Quantification of PRDX6, GPX1 and SOD3, respectively, after normalization to beta-actin, *p < 0.05, ***p < 0.0001. Fig. 5
- Submitted by
- Invitrogen Antibodies (provider)
- Main image
- Experimental details
- Fig. 6 Decreased antioxidants and increased ROS, axon degeneration, and visual function deficits in ocular hypertensive Nrf2 KO mice. A) Representative fundus images of DHE fluorescence in saline and microbead-injected wildtype and Nrf2 KO mice. B) Quantification of DHE fluorescence at 2-wks post-IOP elevation in both strains of mice. C) Quantification of antioxidant gene transcription shown as fold change over respective saline groups, *p < 0.05, **p < 0.001, ***p < 0.0001. D) Representative western blots for beta-actin, PRDX6, SOD3 and GPX1. E-G) Quantification of PRDX6, GPX1 and SOD3, respectively, after normalization to beta-actin, **p < 0.001. H) Representative micrographs of wildtype and Nrf2 KO optic nerves at 2-wks post-IOP elevation. Scale bar applies to all micrographs. Arrows indicate degenerative axons. I) Quantification of total axons in the optic nerves, showing a decrease only in ocular hypertensive Nrf2 KO mice, **p < 0.001. J) Quantification of number of degenerative axons, showing an increase in ocular hypertensive Nrf2 KO mice, ***p < 0.0001. K) Quantification of the N1 amplitude of the VEP. L) Quantification of the PhNR amplitude. Note: all wild-type data shown in this Figure was copied from Fig. 2 for purposes of comparison. Fig. 6
