PA5-104120
antibody from Invitrogen Antibodies
Targeting: FRZB
FRE, FRITZ, FRP-3, FRZB-1, FRZB-PEN, FRZB1, FZRB, hFIZ, SFRP3, SRFP3
Antibody data
- Antibody Data
- Antigen structure
- References [1]
- Comments [0]
- Validations
- Other assay [1]
Submit
Validation data
Reference
Comment
Report error
- Product number
- PA5-104120 - Provider product page

- Provider
- Invitrogen Antibodies
- Product name
- FRZB Polyclonal Antibody
- Antibody type
- Polyclonal
- Antigen
- Synthetic peptide
- Description
- Antibody detects endogenous levels of total SFRP3.
- Reactivity
- Human, Mouse, Rat
- Host
- Rabbit
- Isotype
- IgG
- Vial size
- 100 μL
- Concentration
- 1 mg/mL
- Storage
- -20°C
Submitted references Perturbation of Wnt/β-catenin signaling and sexual dimorphism in non-alcoholic fatty liver disease.
Yeh MM, Shi X, Yang J, Li M, Fung KM, Daoud SS
Hepatology research : the official journal of the Japan Society of Hepatology 2022 May;52(5):433-448
Hepatology research : the official journal of the Japan Society of Hepatology 2022 May;52(5):433-448
No comments: Submit comment
Supportive validation
- Submitted by
- Invitrogen Antibodies (provider)
- Main image

- Experimental details
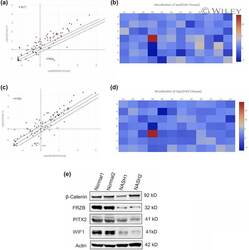
- 4 FIGURE DEGs between male and female cases in NAFLD using Wnt focusing RT 2 profiler Polymerase chain reaction (PCR) arrays. (a) Scatter plot comparing the normalized average expression of each gene of the ""Wnt targets"" PCR array between the two groups (cases 8 & 5 ""NAFLD"" vs. cases 2 & 3 ""normal"" in female samples). The red and green dot stand for up-regulated and down-regulated genes, respectively, whereas black dots indicate unchanged genes; cut-off = +-1.5. (b) Visualization of log2 (Fold Change). Two groups of differential genes in female samples, intersect and merge gene expression colorimetry maps. Based on the expression levels of the DEGs in each in groups, a log2 is taken. Using systematic clustering (Hierarchical Cluster), the overall clustering result of the sample is obtained. Red indicates higher expression and blue indicates lower expression. (c) Scatter plot comparing the normalized average expression of each gene of the ""Wnt targets"" PCR array between the two groups (cases 6 & 7 ""NAFLD"" vs. cases 1 & 4 ""normal"") in male samples. (d) Visualization of log2 (Fold Change) of gene expression in male samples. (e) Protein expression of beta-catenin, FRZB, PITX2 and WIF1 in normal and NASH samples analyzed by immunoblotting. The samples include Normal 1 (male), Normal 2 (female), NASH 1 (male) and NASH 2 (female). Primary antibodies against beta-catenin, FRZB, PITX2 and WIF1 were used for detection. beta-Actin was used as the loading (reference) control.
 Explore
 Validate
 Learn
Learn Western blot
 Immunohistochemistry
 Other assay