Explore
 Validate
 Learn
Learn Flow cytometry
Antibody data
- Antibody Data
- Antigen structure
- References [65]
- Comments [0]
- Validations
- Flow cytometry [1]
- Other assay [41]
Submit
Validation data
Reference
Comment
Report error
- Product number
- 50-5825-80 - Provider product page

- Provider
- Invitrogen Antibodies
- Product name
- T-bet Monoclonal Antibody (eBio4B10 (4B10)), eFluor™ 660, eBioscience™
- Antibody type
- Monoclonal
- Antigen
- Other
- Description
- Description: The eBio4B10 monoclonal antibody reacts with mouse and human T-bet. T-bet is a Th1-specific T-box transcription factor critical to the development of the Th1 CD4+ T cell lineage. This is known based on the observations that T-Bet deficient mice have impaired Th1 cell development, and that ectopic expression of T-Bet results in development skewed to the Th1 lineage. T-Bet expression is induced by the Th1 cytokine IFN gamma, and T-Bet also regulates the expression of IFN gamma, likely, at least in part, through the modification of DNA accessibility and histone remodeling. In addition to IFN gamma, T-Bet is also known to regulate the expression of IL-12R beta and IL-2. Moreover, T-Bet plays a role in class-switch recombination in B-cells. Applications Reported: This eBio4B10 antibody has been reported for use in intracellular staining followed by flow cytometric analysis. Applications Tested: This eBio4B10 antibody has been tested by intracellular staining and flow cytometric analysis of normal human peripheral blood cells. This can be used at less than or equal to 0.5 µg per test. A test is defined as the amount (µg) of antibody that will stain a cell sample in a final volume of 100 µL. Cell number should be determined empirically but can range from 10^5 to 10^8 cells/test. It is recommended that the antibody be carefully titrated for optimal performance in the assay of interest. It is recommended to use the Foxp3/Transcription Factor Staining Buffer Set (Product # 00-5523-00) and protocol. Refer to Best Protocols for Staining Protocol (Protocol B: One step protocol for intracellular (nuclear) proteins) eFluor® 660 is a replacement for Alexa Fluor® 647. eFluor® 660 emits at 659 nm and is excited with the red laser (633 nm). Please make sure that your instrument is capable of detecting this fluorochome. Excitation: 633-647 nm; Emission: 668 nm; Laser: Red Laser. Filtration: 0.2 µm post-manufacturing filtered.
- Reactivity
- Human, Mouse
- Host
- Mouse
- Isotype
- IgG
- Antibody clone number
- eBio4B10 (4B10)
- Vial size
- 25 µg
- Concentration
- 0.2 mg/mL
- Storage
- 4° C, store in dark, DO NOT FREEZE!
Submitted references Development of Tbet- and CD11c-expressing B cells in a viral infection requires T follicular helper cells outside of germinal centers.
Graded RhoA GTPase Expression in Treg Cells Distinguishes Tumor Immunity From Autoimmunity.
Lymph node-resident dendritic cells drive T(H)2 cell development involving MARCH1.
CD4+ effector T cells accelerate Alzheimer's disease in mice.
Role of nuclear localization in the regulation and function of T-bet and Eomes in exhausted CD8 T cells.
Heterologous arenavirus vector prime-boost overrules self-tolerance for efficient tumor-specific CD8 T cell attack.
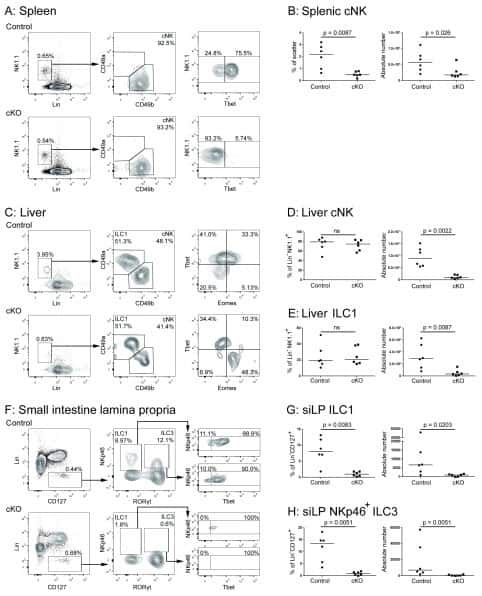
Multi-tissue single-cell analysis deconstructs the complex programs of mouse natural killer and type 1 innate lymphoid cells in tissues and circulation.
Culture, expansion, and flow-cytometry-based functional analysis of pteropid bat MR1-restricted unconventional T cells.
Francisella tularensis induces Th1 like MAIT cells conferring protection against systemic and local infection.
Targeting Phosphatidylserine Enhances the Anti-tumor Response to Tumor-Directed Radiation Therapy in a Preclinical Model of Melanoma.
ADAM12 is a costimulatory molecule that determines Th1 cell fate and mediates tissue inflammation.
Imbalance between T helper 1 and regulatory T cells plays a detrimental role in experimental Parkinson's disease in mice.
Th2 Biased Immunity With Altered B Cell Profiles in Circulation of Patients With Sporotrichosis Caused by Sporothrix globosa.
MiR-1165-3p Suppresses Th2 Differentiation via Targeting IL-13 and PPM1A in a Mouse Model of Allergic Airway Inflammation.
Programming Multifaceted Pulmonary T Cell Immunity by Combination Adjuvants.
CD19-CAR-T Cells Bearing a KIR/PD-1-Based Inhibitory CAR Eradicate CD19(+)HLA-C1(-) Malignant B Cells While Sparing CD19(+)HLA-C1(+) Healthy B Cells.
Antigen discovery unveils resident memory and migratory cell roles in antifungal resistance.
Diversity in medullary thymic epithelial cells controls the activity and availability of iNKT cells.
Heterogenous Populations of Tissue-Resident CD8(+) T Cells Are Generated in Response to Infection and Malignancy.
B cells induced by Schistosoma japonicum infection display diverse regulatory phenotypes and modulate CD4(+) T cell response.
Inhibition of EZH2 ameliorates bacteria-induced liver injury by repressing RUNX1 in dendritic cells.
Ribosome profiling unveils translational regulation of metabolic enzymes in primary CD4(+) Th1 cells.
The Obese Liver Environment Mediates Conversion of NK Cells to a Less Cytotoxic ILC1-Like Phenotype.
Polychromic Reporter Mice Reveal Unappreciated Innate Lymphoid Cell Progenitor Heterogeneity and Elusive ILC3 Progenitors in Bone Marrow.
Single-Cell Profiling Defines Transcriptomic Signatures Specific to Tumor-Reactive versus Virus-Responsive CD4(+) T Cells.
FCRL5(+) Memory B Cells Exhibit Robust Recall Responses.
Keap1-Nrf2 System Plays an Important Role in Invariant Natural Killer T Cell Development and Homeostasis.
The Combination Therapy of Dietary Galacto-Oligosaccharides With Budesonide Reduces Pulmonary Th2 Driving Mediators and Mast Cell Degranulation in a Murine Model of House Dust Mite Induced Asthma.
TRPM2 Exacerbates Central Nervous System Inflammation in Experimental Autoimmune Encephalomyelitis by Increasing Production of CXCL2 Chemokines.
PDL-1 Blockade Prevents T Cell Exhaustion, Inhibits Autophagy, and Promotes Clearance of Leishmania donovani.
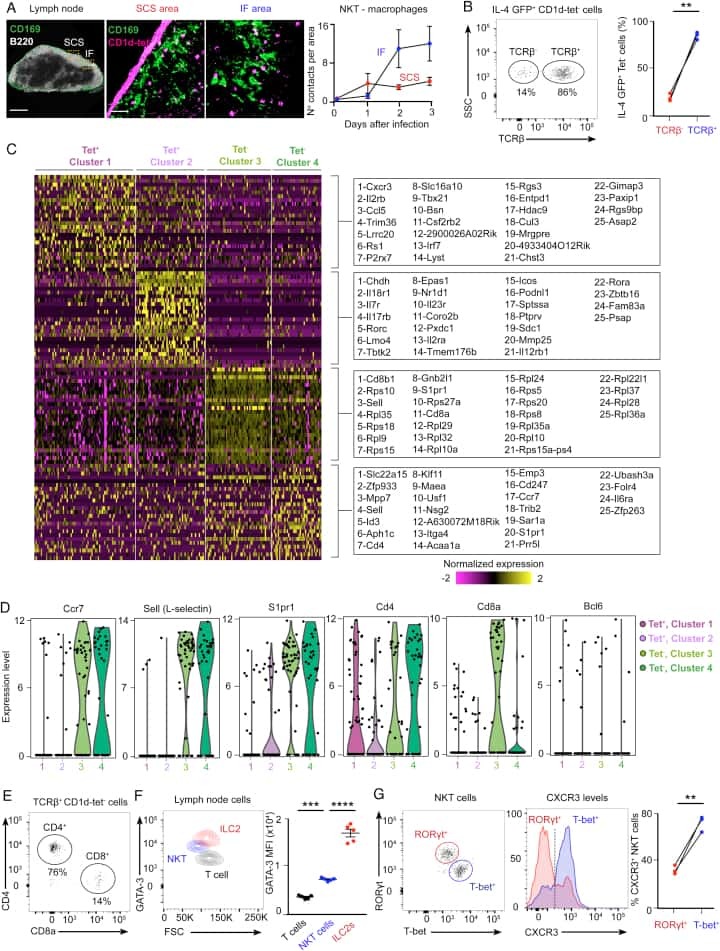
Initiation of Antiviral B Cell Immunity Relies on Innate Signals from Spatially Positioned NKT Cells.
Regulation of chitinase-3-like-1 in T cell elicits Th1 and cytotoxic responses to inhibit lung metastasis.
Conventional NK cells and ILC1 are partially ablated in the livers of Ncr1 (iCre)Tbx21 (fl/fl) mice.
Characterisation of innate lymphoid cell populations at different sites in mice with defective T cell immunity.
Splenic CD4+ T Cells in Progressive Visceral Leishmaniasis Show a Mixed Effector-Regulatory Phenotype and Impair Macrophage Effector Function through Inhibitory Receptor Expression.
Antibiotic-induced perturbations in microbial diversity during post-natal development alters amyloid pathology in an aged APP(SWE)/PS1(ΔE9) murine model of Alzheimer's disease.
Resistance to TGFβ suppression and improved anti-tumor responses in CD8(+) T cells lacking PTPN22.
Eomesodermin and T-bet mark developmentally distinct human natural killer cells.
Regulatory T Cells Promote Myositis and Muscle Damage in Toxoplasma gondii Infection.
Huai Qi Huang corrects the balance of Th1/Th2 and Treg/Th17 in an ovalbumin-induced asthma mouse model.
B-cell anergy induces a Th17 shift in a novel B lymphocyte transgenic NOD mouse model, the 116C-NOD mouse.
The cytotoxic T cell proteome and its shaping by the kinase mTOR.
ILC3 GM-CSF production and mobilisation orchestrate acute intestinal inflammation.
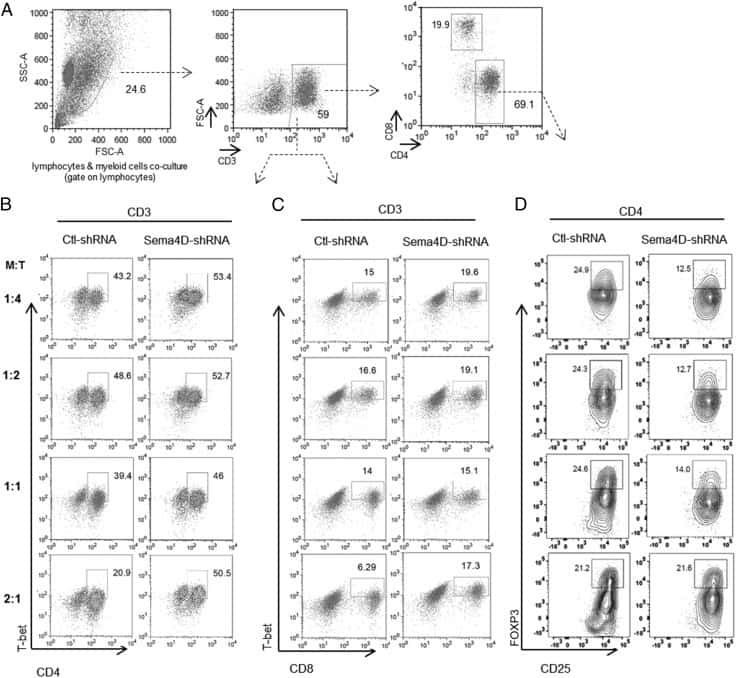
Human Head and Neck Squamous Cell Carcinoma-Associated Semaphorin 4D Induces Expansion of Myeloid-Derived Suppressor Cells.
Characterization of Human CD8 T Cell Responses in Dengue Virus-Infected Patients from India.
Oxygen Sensing by T Cells Establishes an Immunologically Tolerant Metastatic Niche.
Intranasal Administration of Lentiviral miR-135a Regulates Mast Cell and Allergen-Induced Inflammation by Targeting GATA-3.
IFN-γ and IL-21 Double Producing T Cells Are Bcl6-Independent and Survive into the Memory Phase in Plasmodium chabaudi Infection.
Cutaneous Infection with Leishmania major Mediates Heterologous Protection against Visceral Infection with Leishmania infantum.
Diverse roles for T-bet in the effector responses required for resistance to infection.
The transduction pattern of IL-12-encoding lentiviral vectors shapes the immunological outcome.
Clonal analysis of the T-cell response to in vivo expressed Mycobacterium tuberculosis protein Rv2034, using a CD154 expression based T-cell cloning method.
IFN-γ-producing and IL-17-producing γδ T cells differentiate at distinct developmental stages in murine fetal thymus.
Nuclear role of WASp in gene transcription is uncoupled from its ARP2/3-dependent cytoplasmic role in actin polymerization.
CD4CD8αα lymphocytes, a novel human regulatory T cell subset induced by colonic bacteria and deficient in patients with inflammatory bowel disease.
Bhlhe40 controls cytokine production by T cells and is essential for pathogenicity in autoimmune neuroinflammation.
Mitral and tufted cells are potential cellular targets of nitration in the olfactory bulb of aged mice.
Mesenchymal stem cells alleviate TNBS-induced colitis by modulating inflammatory and autoimmune responses.
The cytokines interleukin 27 and interferon-γ promote distinct Treg cell populations required to limit infection-induced pathology.
Distinct requirements for T-bet in gut innate lymphoid cells.
Increase in Th17 and T-reg lymphocytes and decrease of IL22 correlate with the recovery phase of acute EAE in rat.
CD134 plus CD137 dual costimulation induces Eomesodermin in CD4 T cells to program cytotoxic Th1 differentiation.
Cytokine requirements for the differentiation and expansion of IL-17A- and IL-22-producing human Vgamma2Vdelta2 T cells.
Differential expression of T-bet, a T-box transcription factor required for Th1 T-cell development, in peripheral T-cell lymphomas.
A novel transcription factor, T-bet, directs Th1 lineage commitment.
Song W, Antao OQ, Condiff E, Sanchez GM, Chernova I, Zembrzuski K, Steach H, Rubtsova K, Angeletti D, Lemenze A, Laidlaw BJ, Craft J, Weinstein JS
Immunity 2022 Feb 8;55(2):290-307.e5
Immunity 2022 Feb 8;55(2):290-307.e5
Graded RhoA GTPase Expression in Treg Cells Distinguishes Tumor Immunity From Autoimmunity.
Kalim KW, Yang JQ, Modur V, Nguyen P, Li Y, Zheng Y, Guo F
Frontiers in immunology 2021;12:726393
Frontiers in immunology 2021;12:726393
Lymph node-resident dendritic cells drive T(H)2 cell development involving MARCH1.
Castellanos CA, Ren X, Gonzalez SL, Li HK, Schroeder AW, Liang HE, Laidlaw BJ, Hu D, Mak ACY, Eng C, Rodríguez-Santana JR, LeNoir M, Yan Q, Celedón JC, Burchard EG, Zamvil SS, Ishido S, Locksley RM, Cyster JG, Huang X, Shin JS
Science immunology 2021 Oct 15;6(64):eabh0707
Science immunology 2021 Oct 15;6(64):eabh0707
CD4+ effector T cells accelerate Alzheimer's disease in mice.
Machhi J, Yeapuri P, Lu Y, Foster E, Chikhale R, Herskovitz J, Namminga KL, Olson KE, Abdelmoaty MM, Gao J, Quadros RM, Kiyota T, Jingjing L, Kevadiya BD, Wang X, Liu Y, Poluektova LY, Gurumurthy CB, Mosley RL, Gendelman HE
Journal of neuroinflammation 2021 Nov 19;18(1):272
Journal of neuroinflammation 2021 Nov 19;18(1):272
Role of nuclear localization in the regulation and function of T-bet and Eomes in exhausted CD8 T cells.
McLane LM, Ngiow SF, Chen Z, Attanasio J, Manne S, Ruthel G, Wu JE, Staupe RP, Xu W, Amaravadi RK, Xu X, Karakousis GC, Mitchell TC, Schuchter LM, Huang AC, Freedman BD, Betts MR, Wherry EJ
Cell reports 2021 May 11;35(6):109120
Cell reports 2021 May 11;35(6):109120
Heterologous arenavirus vector prime-boost overrules self-tolerance for efficient tumor-specific CD8 T cell attack.
Bonilla WV, Kirchhammer N, Marx AF, Kallert SM, Krzyzaniak MA, Lu M, Darbre S, Schmidt S, Raguz J, Berka U, Vincenti I, Pauzuolis M, Kerber R, Hoepner S, Günther S, Magnus C, Merkler D, Orlinger KK, Zippelius A, Pinschewer DD
Cell reports. Medicine 2021 Mar 16;2(3):100209
Cell reports. Medicine 2021 Mar 16;2(3):100209
Multi-tissue single-cell analysis deconstructs the complex programs of mouse natural killer and type 1 innate lymphoid cells in tissues and circulation.
McFarland AP, Yalin A, Wang SY, Cortez VS, Landsberger T, Sudan R, Peng V, Miller HL, Ricci B, David E, Faccio R, Amit I, Colonna M
Immunity 2021 Jun 8;54(6):1320-1337.e4
Immunity 2021 Jun 8;54(6):1320-1337.e4
Culture, expansion, and flow-cytometry-based functional analysis of pteropid bat MR1-restricted unconventional T cells.
Sia WR, Hey YY, Foo R, Wang LF, Leeansyah E
STAR protocols 2021 Jun 18;2(2):100487
STAR protocols 2021 Jun 18;2(2):100487
Francisella tularensis induces Th1 like MAIT cells conferring protection against systemic and local infection.
Zhao Z, Wang H, Shi M, Zhu T, Pediongco T, Lim XY, Meehan BS, Nelson AG, Fairlie DP, Mak JYW, Eckle SBG, de Lima Moreira M, Tumpach C, Bramhall M, Williams CG, Lee HJ, Haque A, Evrard M, Rossjohn J, McCluskey J, Corbett AJ, Chen Z
Nature communications 2021 Jul 16;12(1):4355
Nature communications 2021 Jul 16;12(1):4355
Targeting Phosphatidylserine Enhances the Anti-tumor Response to Tumor-Directed Radiation Therapy in a Preclinical Model of Melanoma.
Budhu S, Giese R, Gupta A, Fitzgerald K, Zappasodi R, Schad S, Hirschhorn D, Campesato LF, De Henau O, Gigoux M, Liu C, Mazo G, Deng L, Barker CA, Wolchok JD, Merghoub T
Cell reports 2021 Jan 12;34(2):108620
Cell reports 2021 Jan 12;34(2):108620
ADAM12 is a costimulatory molecule that determines Th1 cell fate and mediates tissue inflammation.
Liu Y, Bockermann R, Hadi M, Safari I, Carrion B, Kveiborg M, Issazadeh-Navikas S
Cellular & molecular immunology 2021 Aug;18(8):1904-1919
Cellular & molecular immunology 2021 Aug;18(8):1904-1919
Imbalance between T helper 1 and regulatory T cells plays a detrimental role in experimental Parkinson's disease in mice.
Li W, Luo Y, Xu H, Ma Q, Yao Q
The Journal of international medical research 2021 Apr;49(4):300060521998471
The Journal of international medical research 2021 Apr;49(4):300060521998471
Th2 Biased Immunity With Altered B Cell Profiles in Circulation of Patients With Sporotrichosis Caused by Sporothrix globosa.
Zu J, Yao L, Song Y, Cui Y, Guan M, Chen R, Zhen Y, Li S
Frontiers in immunology 2020;11:570888
Frontiers in immunology 2020;11:570888
MiR-1165-3p Suppresses Th2 Differentiation via Targeting IL-13 and PPM1A in a Mouse Model of Allergic Airway Inflammation.
Wang Z, Ji N, Chen Z, Sun Z, Wu C, Yu W, Hu F, Huang M, Zhang M
Allergy, asthma & immunology research 2020 Sep;12(5):859-876
Allergy, asthma & immunology research 2020 Sep;12(5):859-876
Programming Multifaceted Pulmonary T Cell Immunity by Combination Adjuvants.
Marinaik CB, Kingstad-Bakke B, Lee W, Hatta M, Sonsalla M, Larsen A, Neldner B, Gasper DJ, Kedl RM, Kawaoka Y, Suresh M
Cell reports. Medicine 2020 Sep 22;1(6):100095
Cell reports. Medicine 2020 Sep 22;1(6):100095
CD19-CAR-T Cells Bearing a KIR/PD-1-Based Inhibitory CAR Eradicate CD19(+)HLA-C1(-) Malignant B Cells While Sparing CD19(+)HLA-C1(+) Healthy B Cells.
Tao L, Farooq MA, Gao Y, Zhang L, Niu C, Ajmal I, Zhou Y, He C, Zhao G, Yao J, Liu M, Jiang W
Cancers 2020 Sep 13;12(9)
Cancers 2020 Sep 13;12(9)
Antigen discovery unveils resident memory and migratory cell roles in antifungal resistance.
Dobson HE, Dias LDS, Kohn EM, Fites S, Wiesner DL, Dileepan T, Kujoth GC, Abraham A, Ostroff GR, Klein BS, Wüthrich M
Mucosal immunology 2020 May;13(3):518-529
Mucosal immunology 2020 May;13(3):518-529
Diversity in medullary thymic epithelial cells controls the activity and availability of iNKT cells.
Lucas B, White AJ, Cosway EJ, Parnell SM, James KD, Jones ND, Ohigashi I, Takahama Y, Jenkinson WE, Anderson G
Nature communications 2020 May 4;11(1):2198
Nature communications 2020 May 4;11(1):2198
Heterogenous Populations of Tissue-Resident CD8(+) T Cells Are Generated in Response to Infection and Malignancy.
Milner JJ, Toma C, He Z, Kurd NS, Nguyen QP, McDonald B, Quezada L, Widjaja CE, Witherden DA, Crowl JT, Shaw LA, Yeo GW, Chang JT, Omilusik KD, Goldrath AW
Immunity 2020 May 19;52(5):808-824.e7
Immunity 2020 May 19;52(5):808-824.e7
B cells induced by Schistosoma japonicum infection display diverse regulatory phenotypes and modulate CD4(+) T cell response.
Xiao J, Guan F, Sun L, Zhang Y, Zhang X, Lu S, Liu W
Parasites & vectors 2020 Mar 20;13(1):147
Parasites & vectors 2020 Mar 20;13(1):147
Inhibition of EZH2 ameliorates bacteria-induced liver injury by repressing RUNX1 in dendritic cells.
Wang Y, Wang Q, Wang B, Gu Y, Yu H, Yang W, Ren X, Qian F, Zhao X, Xiao Y, Zhang Y, Jin M, Zhu M
Cell death & disease 2020 Dec 1;11(11):1024
Cell death & disease 2020 Dec 1;11(11):1024
Ribosome profiling unveils translational regulation of metabolic enzymes in primary CD4(+) Th1 cells.
Manfrini N, Ricciardi S, Alfieri R, Ventura G, Calamita P, Favalli A, Biffo S
Developmental and comparative immunology 2020 Aug;109:103697
Developmental and comparative immunology 2020 Aug;109:103697
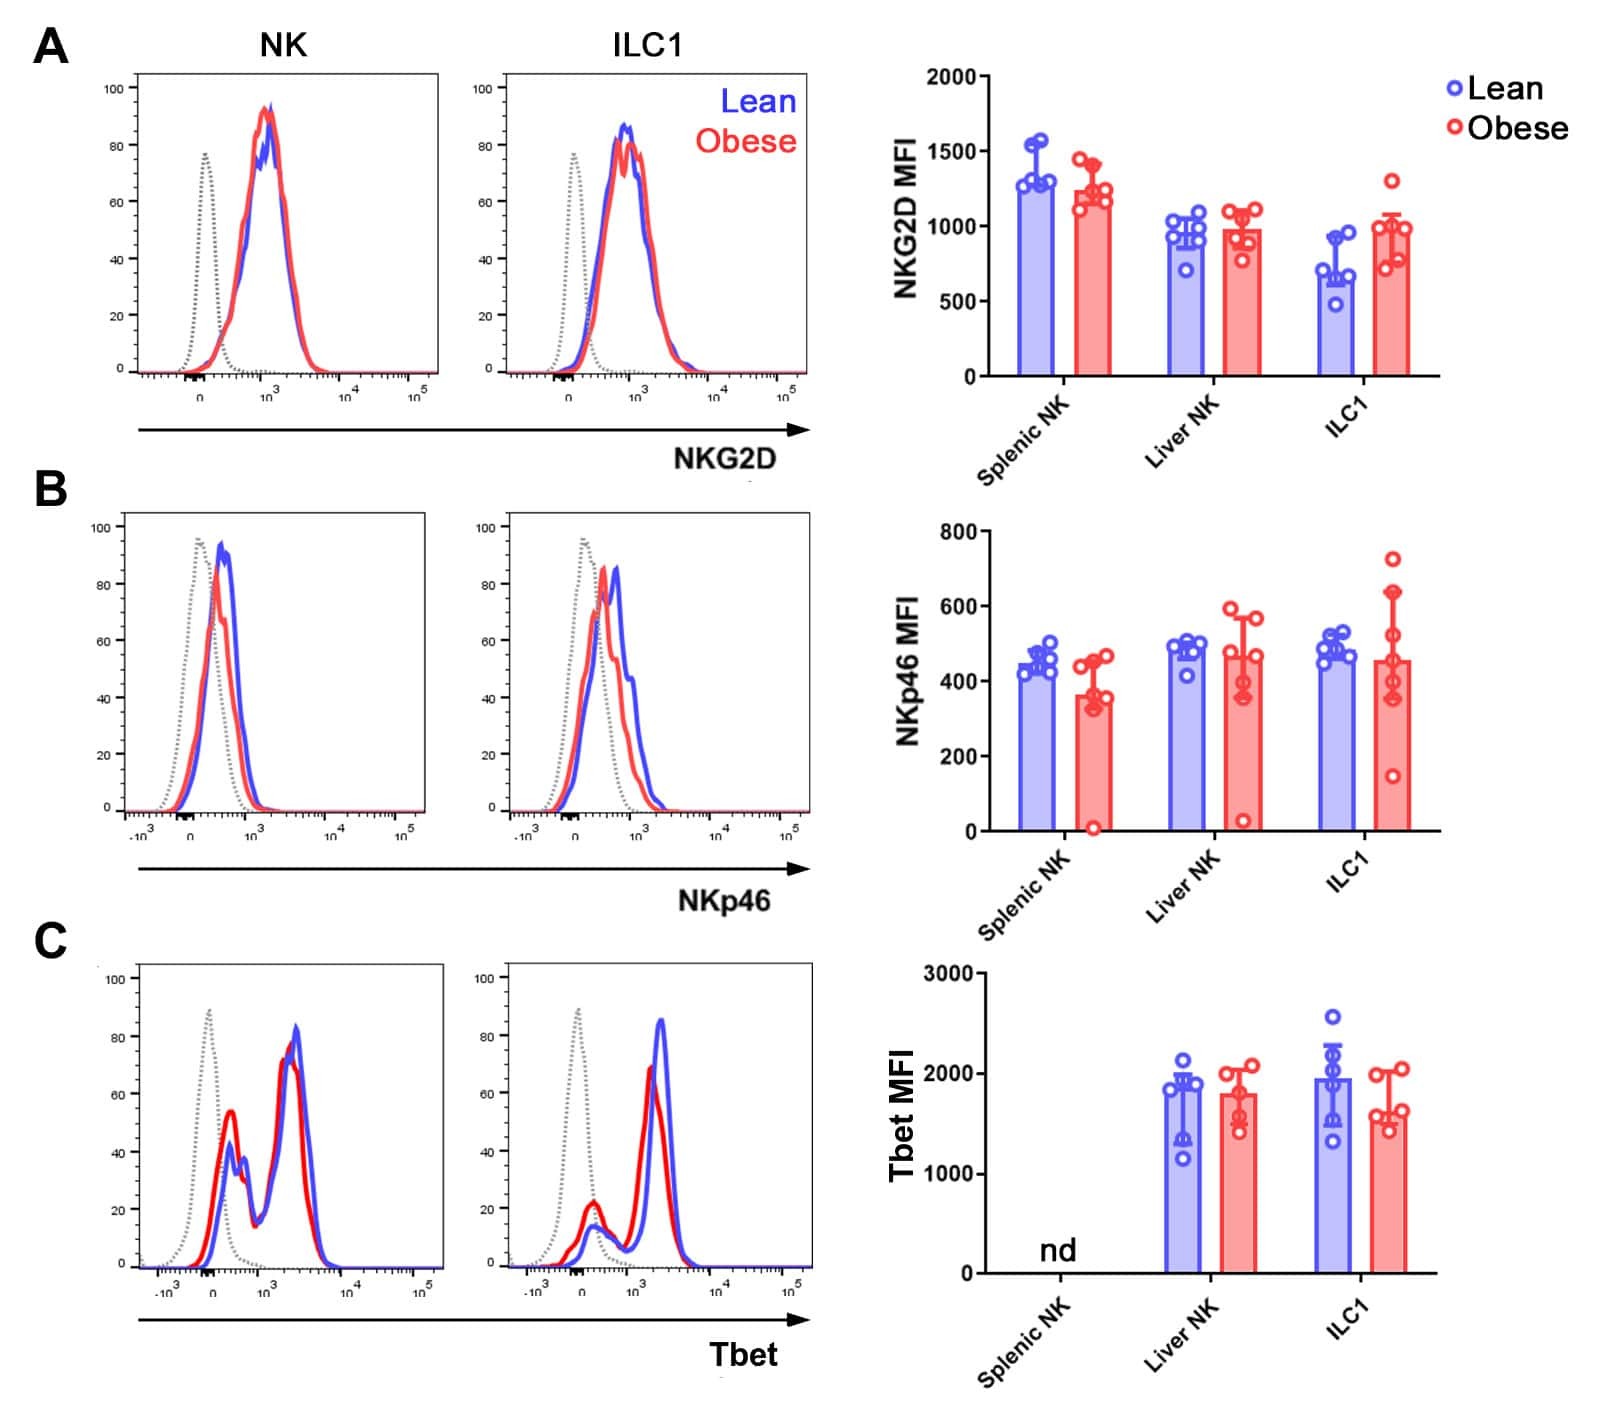
The Obese Liver Environment Mediates Conversion of NK Cells to a Less Cytotoxic ILC1-Like Phenotype.
Cuff AO, Sillito F, Dertschnig S, Hall A, Luong TV, Chakraverty R, Male V
Frontiers in immunology 2019;10:2180
Frontiers in immunology 2019;10:2180
Polychromic Reporter Mice Reveal Unappreciated Innate Lymphoid Cell Progenitor Heterogeneity and Elusive ILC3 Progenitors in Bone Marrow.
Walker JA, Clark PA, Crisp A, Barlow JL, Szeto A, Ferreira ACF, Rana BMJ, Jolin HE, Rodriguez-Rodriguez N, Sivasubramaniam M, Pannell R, Cruickshank J, Daly M, Haim-Vilmovsky L, Teichmann SA, McKenzie ANJ
Immunity 2019 Jul 16;51(1):104-118.e7
Immunity 2019 Jul 16;51(1):104-118.e7
Single-Cell Profiling Defines Transcriptomic Signatures Specific to Tumor-Reactive versus Virus-Responsive CD4(+) T Cells.
Magen A, Nie J, Ciucci T, Tamoutounour S, Zhao Y, Mehta M, Tran B, McGavern DB, Hannenhalli S, Bosselut R
Cell reports 2019 Dec 3;29(10):3019-3032.e6
Cell reports 2019 Dec 3;29(10):3019-3032.e6
FCRL5(+) Memory B Cells Exhibit Robust Recall Responses.
Kim CC, Baccarella AM, Bayat A, Pepper M, Fontana MF
Cell reports 2019 Apr 30;27(5):1446-1460.e4
Cell reports 2019 Apr 30;27(5):1446-1460.e4
Keap1-Nrf2 System Plays an Important Role in Invariant Natural Killer T Cell Development and Homeostasis.
Pyaram K, Kumar A, Kim YH, Noel S, Reddy SP, Rabb H, Chang CH
Cell reports 2019 Apr 16;27(3):699-707.e4
Cell reports 2019 Apr 16;27(3):699-707.e4
The Combination Therapy of Dietary Galacto-Oligosaccharides With Budesonide Reduces Pulmonary Th2 Driving Mediators and Mast Cell Degranulation in a Murine Model of House Dust Mite Induced Asthma.
Verheijden KAT, Braber S, Leusink-Muis T, Jeurink PV, Thijssen S, Kraneveld AD, Garssen J, Folkerts G, Willemsen LEM
Frontiers in immunology 2018;9:2419
Frontiers in immunology 2018;9:2419
TRPM2 Exacerbates Central Nervous System Inflammation in Experimental Autoimmune Encephalomyelitis by Increasing Production of CXCL2 Chemokines.
Tsutsui M, Hirase R, Miyamura S, Nagayasu K, Nakagawa T, Mori Y, Shirakawa H, Kaneko S
The Journal of neuroscience : the official journal of the Society for Neuroscience 2018 Sep 26;38(39):8484-8495
The Journal of neuroscience : the official journal of the Society for Neuroscience 2018 Sep 26;38(39):8484-8495
PDL-1 Blockade Prevents T Cell Exhaustion, Inhibits Autophagy, and Promotes Clearance of Leishmania donovani.
Habib S, El Andaloussi A, Elmasry K, Handoussa A, Azab M, Elsawey A, Al-Hendy A, Ismail N
Infection and immunity 2018 Jun;86(6)
Infection and immunity 2018 Jun;86(6)
Initiation of Antiviral B Cell Immunity Relies on Innate Signals from Spatially Positioned NKT Cells.
Gaya M, Barral P, Burbage M, Aggarwal S, Montaner B, Warren Navia A, Aid M, Tsui C, Maldonado P, Nair U, Ghneim K, Fallon PG, Sekaly RP, Barouch DH, Shalek AK, Bruckbauer A, Strid J, Batista FD
Cell 2018 Jan 25;172(3):517-533.e20
Cell 2018 Jan 25;172(3):517-533.e20
Regulation of chitinase-3-like-1 in T cell elicits Th1 and cytotoxic responses to inhibit lung metastasis.
Kim DH, Park HJ, Lim S, Koo JH, Lee HG, Choi JO, Oh JH, Ha SJ, Kang MJ, Lee CM, Lee CG, Elias JA, Choi JM
Nature communications 2018 Feb 5;9(1):503
Nature communications 2018 Feb 5;9(1):503
Conventional NK cells and ILC1 are partially ablated in the livers of Ncr1 (iCre)Tbx21 (fl/fl) mice.
Cuff AO, Male V
Wellcome open research 2017;2:39
Wellcome open research 2017;2:39
Characterisation of innate lymphoid cell populations at different sites in mice with defective T cell immunity.
Dutton EE, Camelo A, Sleeman M, Herbst R, Carlesso G, Belz GT, Withers DR
Wellcome open research 2017;2:117
Wellcome open research 2017;2:117
Splenic CD4+ T Cells in Progressive Visceral Leishmaniasis Show a Mixed Effector-Regulatory Phenotype and Impair Macrophage Effector Function through Inhibitory Receptor Expression.
Medina-Colorado AA, Osorio EY, Saldarriaga OA, Travi BL, Kong F, Spratt H, Soong L, Melby PC
PloS one 2017;12(1):e0169496
PloS one 2017;12(1):e0169496
Antibiotic-induced perturbations in microbial diversity during post-natal development alters amyloid pathology in an aged APP(SWE)/PS1(ΔE9) murine model of Alzheimer's disease.
Minter MR, Hinterleitner R, Meisel M, Zhang C, Leone V, Zhang X, Oyler-Castrillo P, Zhang X, Musch MW, Shen X, Jabri B, Chang EB, Tanzi RE, Sisodia SS
Scientific reports 2017 Sep 5;7(1):10411
Scientific reports 2017 Sep 5;7(1):10411
Resistance to TGFβ suppression and improved anti-tumor responses in CD8(+) T cells lacking PTPN22.
Brownlie RJ, Garcia C, Ravasz M, Zehn D, Salmond RJ, Zamoyska R
Nature communications 2017 Nov 7;8(1):1343
Nature communications 2017 Nov 7;8(1):1343
Eomesodermin and T-bet mark developmentally distinct human natural killer cells.
Collins A, Rothman N, Liu K, Reiner SL
JCI insight 2017 Mar 9;2(5):e90063
JCI insight 2017 Mar 9;2(5):e90063
Regulatory T Cells Promote Myositis and Muscle Damage in Toxoplasma gondii Infection.
Jin RM, Blair SJ, Warunek J, Heffner RR, Blader IJ, Wohlfert EA
Journal of immunology (Baltimore, Md. : 1950) 2017 Jan 1;198(1):352-362
Journal of immunology (Baltimore, Md. : 1950) 2017 Jan 1;198(1):352-362
Huai Qi Huang corrects the balance of Th1/Th2 and Treg/Th17 in an ovalbumin-induced asthma mouse model.
Liang P, Peng S, Zhang M, Ma Y, Zhen X, Li H
Bioscience reports 2017 Dec 22;37(6)
Bioscience reports 2017 Dec 22;37(6)
B-cell anergy induces a Th17 shift in a novel B lymphocyte transgenic NOD mouse model, the 116C-NOD mouse.
Carrascal J, Carrillo J, Arpa B, Egia-Mendikute L, Rosell-Mases E, Pujol-Autonell I, Planas R, Mora C, Mauricio D, Ampudia RM, Vives-Pi M, Verdaguer J
European journal of immunology 2016 Mar;46(3):593-608
European journal of immunology 2016 Mar;46(3):593-608
The cytotoxic T cell proteome and its shaping by the kinase mTOR.
Hukelmann JL, Anderson KE, Sinclair LV, Grzes KM, Murillo AB, Hawkins PT, Stephens LR, Lamond AI, Cantrell DA
Nature immunology 2016 Jan;17(1):104-12
Nature immunology 2016 Jan;17(1):104-12
ILC3 GM-CSF production and mobilisation orchestrate acute intestinal inflammation.
Pearson C, Thornton EE, McKenzie B, Schaupp AL, Huskens N, Griseri T, West N, Tung S, Seddon BP, Uhlig HH, Powrie F
eLife 2016 Jan 18;5:e10066
eLife 2016 Jan 18;5:e10066
Human Head and Neck Squamous Cell Carcinoma-Associated Semaphorin 4D Induces Expansion of Myeloid-Derived Suppressor Cells.
Younis RH, Han KL, Webb TJ
Journal of immunology (Baltimore, Md. : 1950) 2016 Feb 1;196(3):1419-29
Journal of immunology (Baltimore, Md. : 1950) 2016 Feb 1;196(3):1419-29
Characterization of Human CD8 T Cell Responses in Dengue Virus-Infected Patients from India.
Chandele A, Sewatanon J, Gunisetty S, Singla M, Onlamoon N, Akondy RS, Kissick HT, Nayak K, Reddy ES, Kalam H, Kumar D, Verma A, Panda H, Wang S, Angkasekwinai N, Pattanapanyasat K, Chokephaibulkit K, Medigeshi GR, Lodha R, Kabra S, Ahmed R, Murali-Krishna K
Journal of virology 2016 Dec 15;90(24):11259-11278
Journal of virology 2016 Dec 15;90(24):11259-11278
Oxygen Sensing by T Cells Establishes an Immunologically Tolerant Metastatic Niche.
Clever D, Roychoudhuri R, Constantinides MG, Askenase MH, Sukumar M, Klebanoff CA, Eil RL, Hickman HD, Yu Z, Pan JH, Palmer DC, Phan AT, Goulding J, Gattinoni L, Goldrath AW, Belkaid Y, Restifo NP
Cell 2016 Aug 25;166(5):1117-1131.e14
Cell 2016 Aug 25;166(5):1117-1131.e14
Intranasal Administration of Lentiviral miR-135a Regulates Mast Cell and Allergen-Induced Inflammation by Targeting GATA-3.
Deng YQ, Yang YQ, Wang SB, Li F, Liu MZ, Hua QQ, Tao ZZ
PloS one 2015;10(9):e0139322
PloS one 2015;10(9):e0139322
IFN-γ and IL-21 Double Producing T Cells Are Bcl6-Independent and Survive into the Memory Phase in Plasmodium chabaudi Infection.
Carpio VH, Opata MM, Montañez ME, Banerjee PP, Dent AL, Stephens R
PloS one 2015;10(12):e0144654
PloS one 2015;10(12):e0144654
Cutaneous Infection with Leishmania major Mediates Heterologous Protection against Visceral Infection with Leishmania infantum.
Romano A, Doria NA, Mendez J, Sacks DL, Peters NC
Journal of immunology (Baltimore, Md. : 1950) 2015 Oct 15;195(8):3816-27
Journal of immunology (Baltimore, Md. : 1950) 2015 Oct 15;195(8):3816-27
Diverse roles for T-bet in the effector responses required for resistance to infection.
Harms Pritchard G, Hall AO, Christian DA, Wagage S, Fang Q, Muallem G, John B, Glatman Zaretsky A, Dunn WG, Perrigoue J, Reiner SL, Hunter CA
Journal of immunology (Baltimore, Md. : 1950) 2015 Feb 1;194(3):1131-40
Journal of immunology (Baltimore, Md. : 1950) 2015 Feb 1;194(3):1131-40
The transduction pattern of IL-12-encoding lentiviral vectors shapes the immunological outcome.
Goyvaerts C, Broos K, Escors D, Heirman C, Raes G, De Baetselier P, Thielemans K, Breckpot K
European journal of immunology 2015 Dec;45(12):3351-61
European journal of immunology 2015 Dec;45(12):3351-61
Clonal analysis of the T-cell response to in vivo expressed Mycobacterium tuberculosis protein Rv2034, using a CD154 expression based T-cell cloning method.
Commandeur S, Coppola M, Dijkman K, Friggen AH, van Meijgaarden KE, van den Eeden SJ, Wilson L, van der Ploeg-van Schip JJ, Franken KL, Geluk A, Ottenhoff TH
PloS one 2014;9(6):e99203
PloS one 2014;9(6):e99203
IFN-γ-producing and IL-17-producing γδ T cells differentiate at distinct developmental stages in murine fetal thymus.
Shibata K, Yamada H, Nakamura M, Hatano S, Katsuragi Y, Kominami R, Yoshikai Y
Journal of immunology (Baltimore, Md. : 1950) 2014 Mar 1;192(5):2210-8
Journal of immunology (Baltimore, Md. : 1950) 2014 Mar 1;192(5):2210-8
Nuclear role of WASp in gene transcription is uncoupled from its ARP2/3-dependent cytoplasmic role in actin polymerization.
Sadhukhan S, Sarkar K, Taylor M, Candotti F, Vyas YM
Journal of immunology (Baltimore, Md. : 1950) 2014 Jul 1;193(1):150-60
Journal of immunology (Baltimore, Md. : 1950) 2014 Jul 1;193(1):150-60
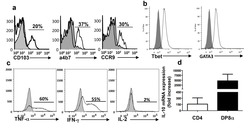
CD4CD8αα lymphocytes, a novel human regulatory T cell subset induced by colonic bacteria and deficient in patients with inflammatory bowel disease.
Sarrabayrouse G, Bossard C, Chauvin JM, Jarry A, Meurette G, Quévrain E, Bridonneau C, Preisser L, Asehnoune K, Labarrière N, Altare F, Sokol H, Jotereau F
PLoS biology 2014 Apr;12(4):e1001833
PLoS biology 2014 Apr;12(4):e1001833
Bhlhe40 controls cytokine production by T cells and is essential for pathogenicity in autoimmune neuroinflammation.
Lin CC, Bradstreet TR, Schwarzkopf EA, Sim J, Carrero JA, Chou C, Cook LE, Egawa T, Taneja R, Murphy TL, Russell JH, Edelson BT
Nature communications 2014 Apr 3;5:3551
Nature communications 2014 Apr 3;5:3551
Mitral and tufted cells are potential cellular targets of nitration in the olfactory bulb of aged mice.
Yang MJ, Sim S, Jeon JH, Jeong E, Kim HC, Park YJ, Kim IB
PloS one 2013;8(3):e59673
PloS one 2013;8(3):e59673
Mesenchymal stem cells alleviate TNBS-induced colitis by modulating inflammatory and autoimmune responses.
Chen QQ, Yan L, Wang CZ, Wang WH, Shi H, Su BB, Zeng QH, Du HT, Wan J
World journal of gastroenterology 2013 Aug 7;19(29):4702-17
World journal of gastroenterology 2013 Aug 7;19(29):4702-17
The cytokines interleukin 27 and interferon-γ promote distinct Treg cell populations required to limit infection-induced pathology.
Hall AO, Beiting DP, Tato C, John B, Oldenhove G, Lombana CG, Pritchard GH, Silver JS, Bouladoux N, Stumhofer JS, Harris TH, Grainger J, Wojno ED, Wagage S, Roos DS, Scott P, Turka LA, Cherry S, Reiner SL, Cua D, Belkaid Y, Elloso MM, Hunter CA
Immunity 2012 Sep 21;37(3):511-23
Immunity 2012 Sep 21;37(3):511-23
Distinct requirements for T-bet in gut innate lymphoid cells.
Sciumé G, Hirahara K, Takahashi H, Laurence A, Villarino AV, Singleton KL, Spencer SP, Wilhelm C, Poholek AC, Vahedi G, Kanno Y, Belkaid Y, O'Shea JJ
The Journal of experimental medicine 2012 Dec 17;209(13):2331-8
The Journal of experimental medicine 2012 Dec 17;209(13):2331-8
Increase in Th17 and T-reg lymphocytes and decrease of IL22 correlate with the recovery phase of acute EAE in rat.
Almolda B, Costa M, Montoya M, González B, Castellano B
PloS one 2011;6(11):e27473
PloS one 2011;6(11):e27473
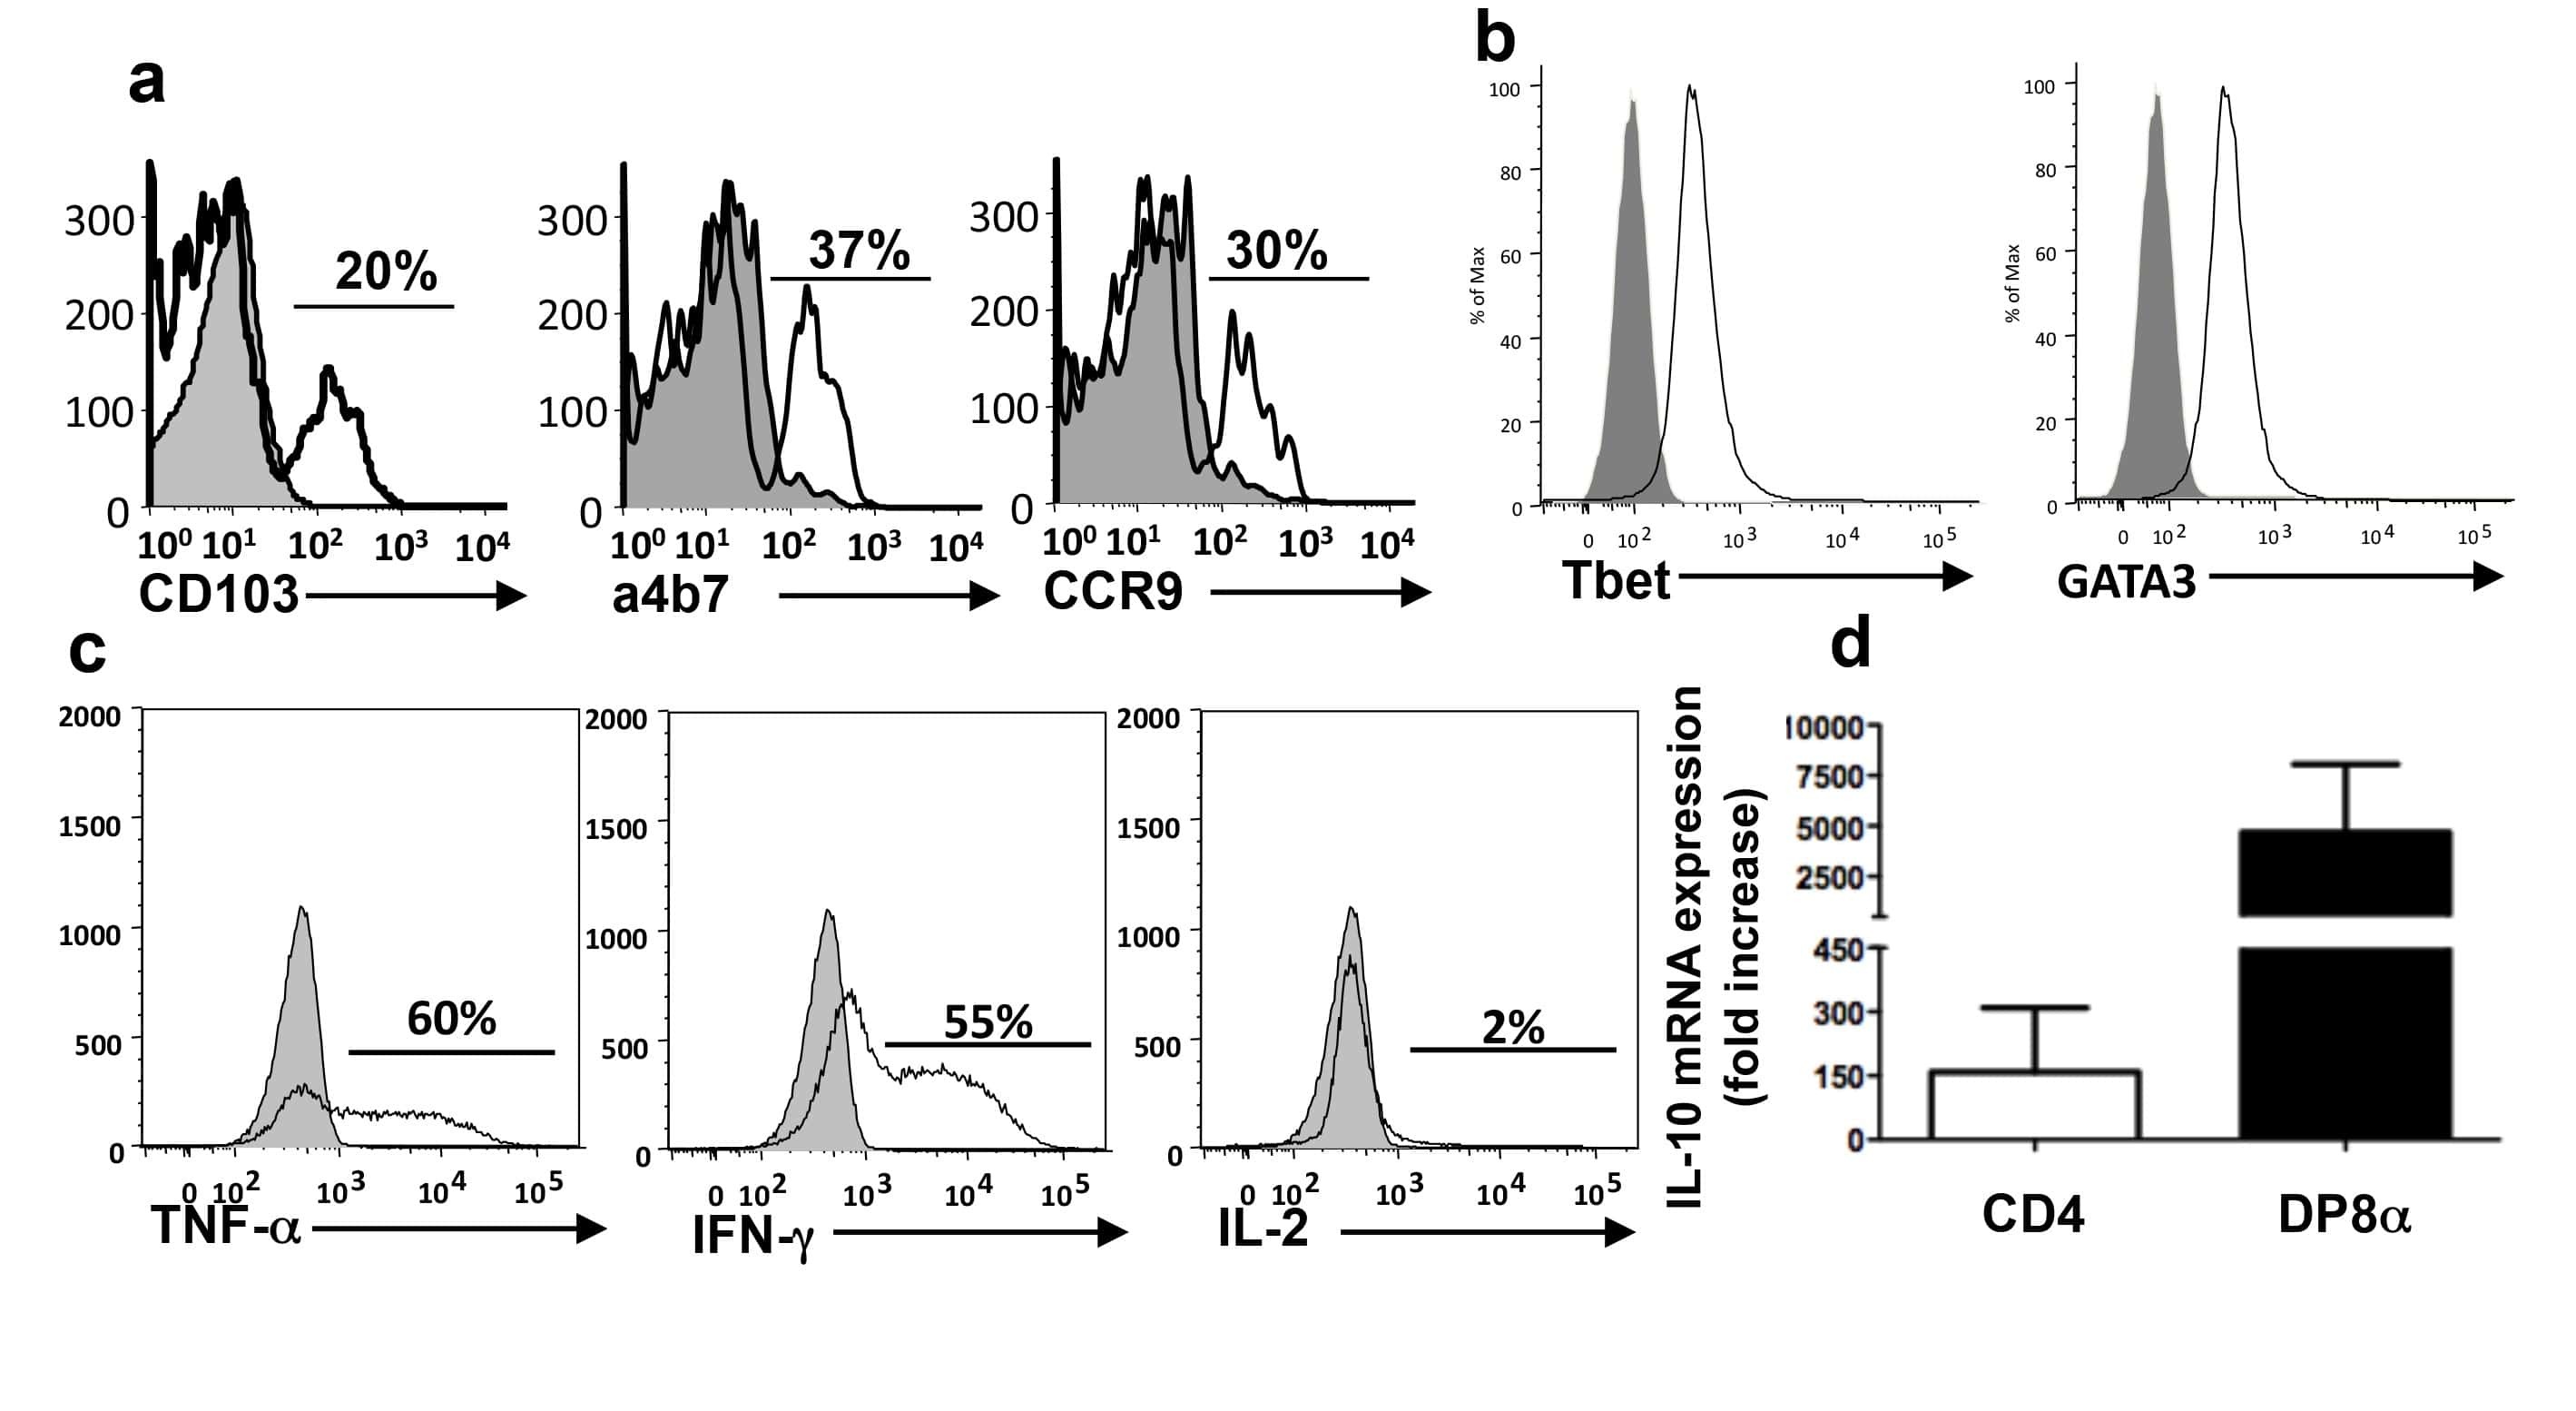
CD134 plus CD137 dual costimulation induces Eomesodermin in CD4 T cells to program cytotoxic Th1 differentiation.
Qui HZ, Hagymasi AT, Bandyopadhyay S, St Rose MC, Ramanarasimhaiah R, Ménoret A, Mittler RS, Gordon SM, Reiner SL, Vella AT, Adler AJ
Journal of immunology (Baltimore, Md. : 1950) 2011 Oct 1;187(7):3555-64
Journal of immunology (Baltimore, Md. : 1950) 2011 Oct 1;187(7):3555-64
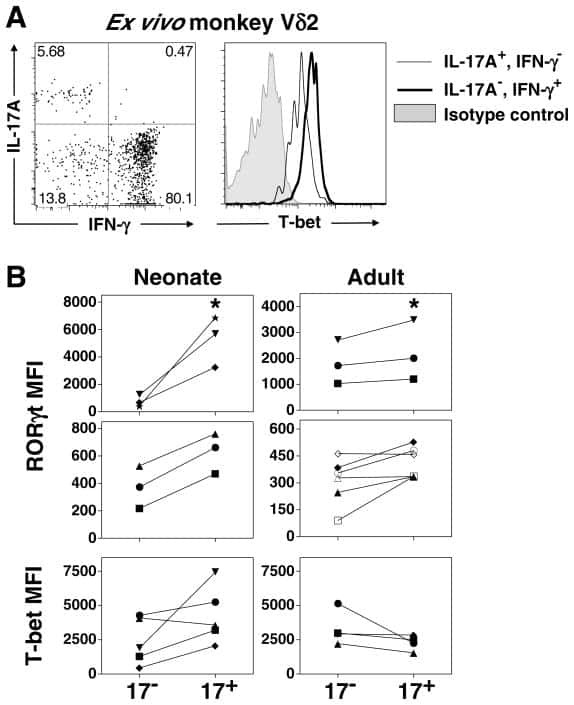
Cytokine requirements for the differentiation and expansion of IL-17A- and IL-22-producing human Vgamma2Vdelta2 T cells.
Ness-Schwickerath KJ, Jin C, Morita CT
Journal of immunology (Baltimore, Md. : 1950) 2010 Jun 15;184(12):7268-80
Journal of immunology (Baltimore, Md. : 1950) 2010 Jun 15;184(12):7268-80
Differential expression of T-bet, a T-box transcription factor required for Th1 T-cell development, in peripheral T-cell lymphomas.
Dorfman DM, van den Elzen P, Weng AP, Shahsafaei A, Glimcher LH
American journal of clinical pathology 2003 Dec;120(6):866-73
American journal of clinical pathology 2003 Dec;120(6):866-73
A novel transcription factor, T-bet, directs Th1 lineage commitment.
Szabo SJ, Kim ST, Costa GL, Zhang X, Fathman CG, Glimcher LH
Cell 2000 Mar 17;100(6):655-69
Cell 2000 Mar 17;100(6):655-69
No comments: Submit comment
Supportive validation
- Submitted by
- Invitrogen Antibodies (provider)
- Main image

- Experimental details
- Intracellular staining of normal human peripheral blood cells with Anti-Human CD8a FITC (Product # 11-0088-42) and 0.25 µg of Mouse IgG1 K Isotype Control eFluor® 660 (Product # 50-4714-82) (left) or 0.25 µg of Anti-Human/Mouse T-bet eFluor® 660 (right) using the Foxp3 Staining Buffer Set (Product # 00-5523-00) and protocol. Cells in the lymphocyte gate were used for analysis.

Supportive validation
- Submitted by
- Invitrogen Antibodies (provider)
- Main image
- Experimental details
- NULL
- Submitted by
- Invitrogen Antibodies (provider)
- Main image

- Experimental details
- NULL
- Submitted by
- Invitrogen Antibodies (provider)
- Main image
- Experimental details
- NULL

- Submitted by
- Invitrogen Antibodies (provider)
- Main image
- Experimental details
- NULL
- Submitted by
- Invitrogen Antibodies (provider)
- Main image

- Experimental details
- NULL
- Submitted by
- Invitrogen Antibodies (provider)
- Main image

- Experimental details
- NULL
- Submitted by
- Invitrogen Antibodies (provider)
- Main image

- Experimental details
- NULL

- Submitted by
- Invitrogen Antibodies (provider)
- Main image
- Experimental details
- NULL
- Submitted by
- Invitrogen Antibodies (provider)
- Main image

- Experimental details
- NULL
- Submitted by
- Invitrogen Antibodies (provider)
- Main image

- Experimental details
- NULL
- Submitted by
- Invitrogen Antibodies (provider)
- Main image
- Experimental details
- NULL
- Submitted by
- Invitrogen Antibodies (provider)
- Main image

- Experimental details
- NULL
- Submitted by
- Invitrogen Antibodies (provider)
- Main image

- Experimental details
- NULL
- Submitted by
- Invitrogen Antibodies (provider)
- Main image

- Experimental details
- NULL
- Submitted by
- Invitrogen Antibodies (provider)
- Main image

- Experimental details
- NULL

- Submitted by
- Invitrogen Antibodies (provider)
- Main image

- Experimental details
- NULL

- Submitted by
- Invitrogen Antibodies (provider)
- Main image

- Experimental details
- NULL
- Submitted by
- Invitrogen Antibodies (provider)
- Main image
- Experimental details
- NULL
- Submitted by
- Invitrogen Antibodies (provider)
- Main image

- Experimental details
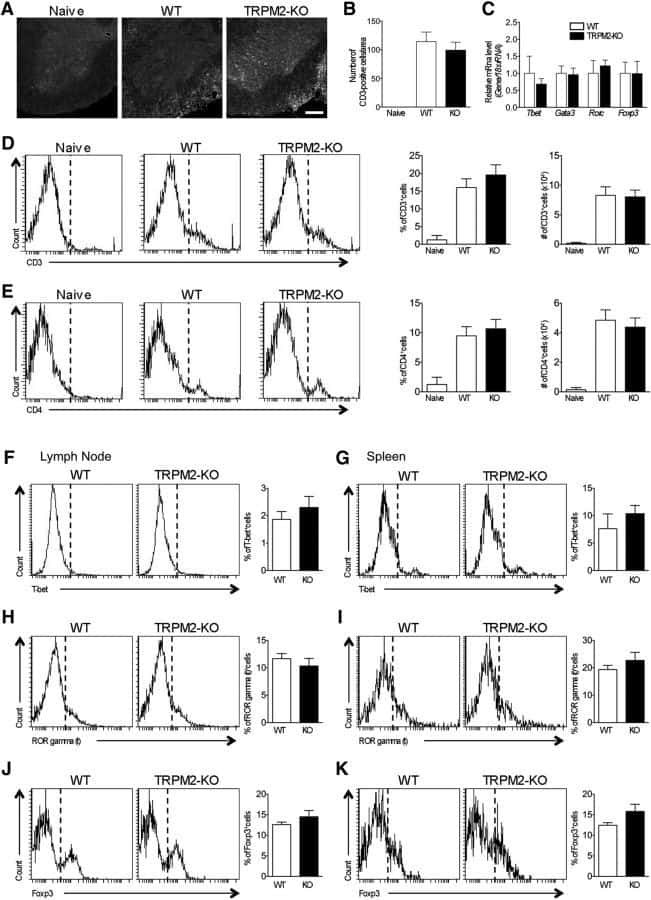
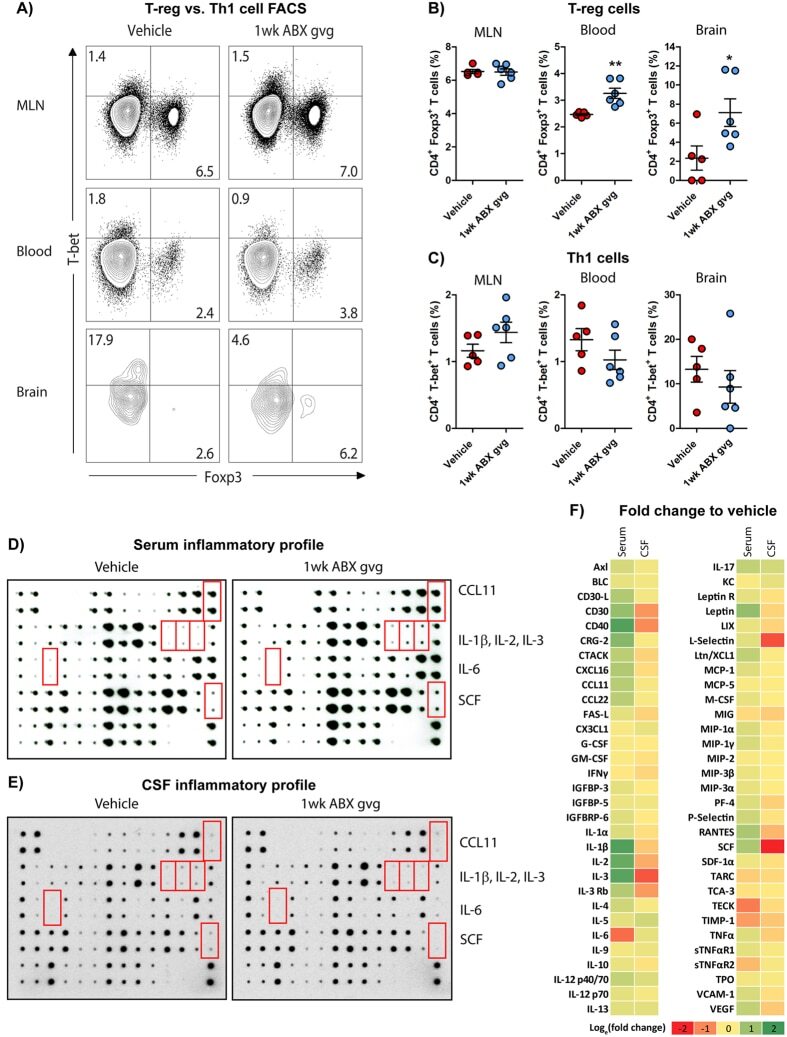
- Figure 2 1 wk ABX gvg-treated APP SWE /PS1 DeltaE9 mice display altered peripheral and brain inflammatory profiles. ( A ) Representative density dot plots of T-bet and Foxp3 intracellular expression in TCRbeta + CD4 + T cell populations isolated from MLN, blood and brain tissue of vehicle and 1 wk ABX gvg-treated APP SWE /PS1 DeltaE9 mice analysed by flow cytometry. Quantified percentages of ( B ) Foxp3 + and ( C ) T-bet + CD4 + T cells, representative of a T-reg and Th1 T cell phenotype respectively, are expressed relative to total live CD4 + T cell counts ( n = 5-6, *p < 0.05, **p < 0.01, un-paired two-tailed Student's t -test). ( D ) Immunoblot-based array of inflammatory mediators present in the serum of vehicle and 1 wk ABX gvg-treated APP SWE /PS1 DeltaE9 mice ( n = 10 pooled sera). ( E ) Immunoblot-based array of inflammatory mediators present in the CSF of vehicle and 1 wk ABX gvg-treated APP SWE /PS1 DeltaE9 mice ( n = 10 pooled CSF). ( F ) Heat map analysis of inflammatory mediator fold change expression in 1 wk ABX gvg-treated APP SWE /PS1 DeltaE9 mice relative to control. Data are displayed as log e (mean) or mean +- SEM. See Supp. Figs 2 , 4 , 5 , 6 , and statistical Table 2 for additional information.
- Submitted by
- Invitrogen Antibodies (provider)
- Main image
- Experimental details
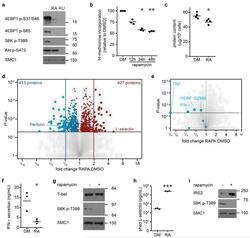
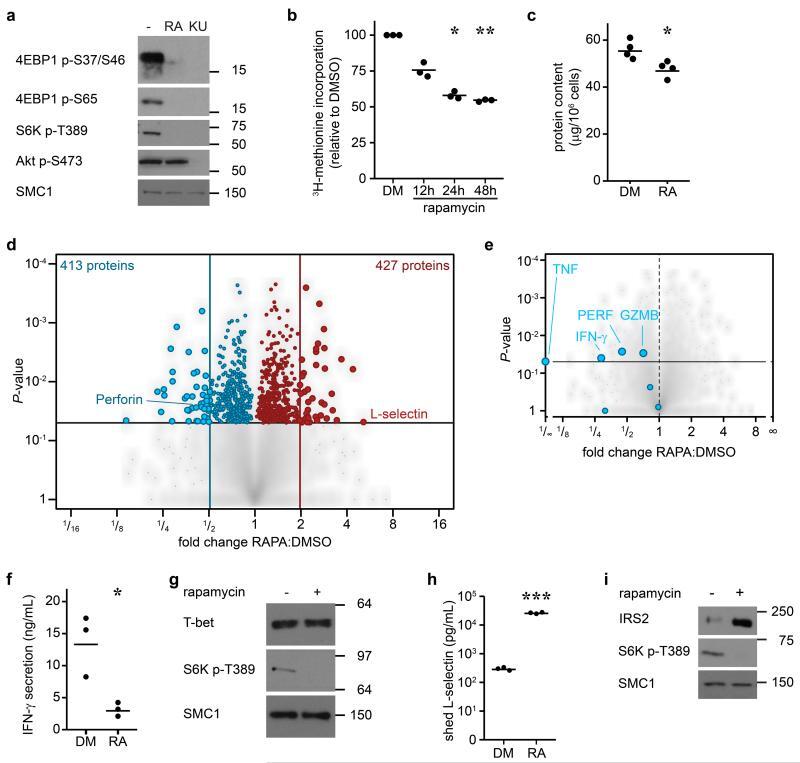
- Figure 4 The mTORC1 regulated CTL proteome (a) Immunoblot analysis of mTORC1/2 substrates in P14 TCR transgenic CTLs cultured with IL-2/IL-12 +- 48 h treatment with either rapamycin or KU-0063794. (b) Protein synthesis was examined by monitoring 3 H-Met incorporation into nascent proteins in CTLs cultured in IL-2/IL-12 and treated with rapamycin for the indicated time. (c) Cellular protein content of CTLs +- 48 h rapamycin. (d, e,) Volcano plots showing fold changes in proteins vs. log-transformed P -values from mass spectrometry analysis of CTLs +- 48 h rapamycin. (d) Total proteins. Known rapamycin sensitive proteins perforin and L-selectin are highlighted. (e) CTL effector molecules. (f) IFN-gamma secretion by CTLs +- 48 h rapamycin measured by ELISA. (h) Immunoblot analysis of T-bet in CTLs +- 48 h rapamycin. (h, i) Validation of up-regulated proteins: (h) ELISA of shed CD62L in cell supernatants prepared from CTLs +- 48 h rapamycin. (i) Immunoblot analysis of IRS2 in CTLs +- 48 h rapamycin. (a, g, i): representive immunoblots of at least three biological replicates. (b, c, f, h): individual data points and means are shown. P -values shown determined by (b): one-way ANOVA (Holm-Sidak) vs. DMSO as control on non-normalized data; (c, f, h): two-tailed Student's t-test. Data based on three (b, f, h) or four (c) biological replicates. * P
- Submitted by
- Invitrogen Antibodies (provider)
- Main image
- Experimental details
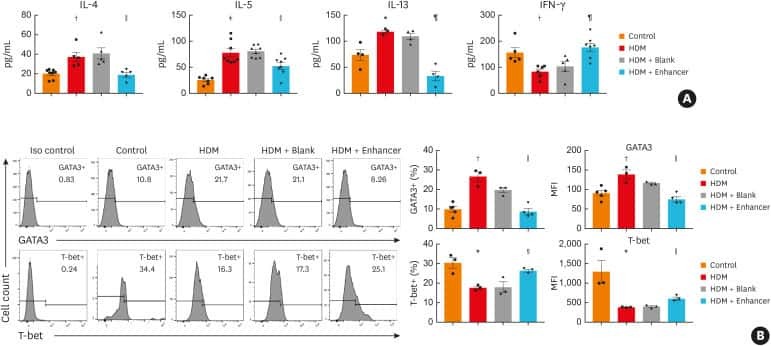
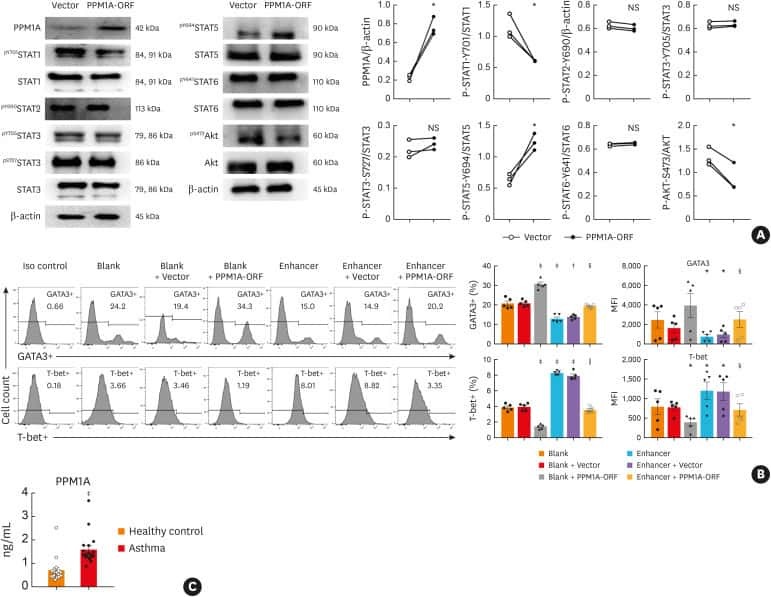
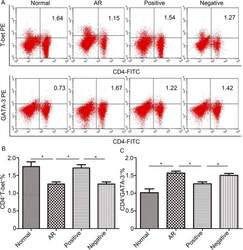
- Fig 5 Lentiviral-mmu-miR-135a treatment influences Th cell polarization. The expression of T-bet and GATA-3 protein in CD4 + T cells was measured in the spleens of normal (control), AR (AR-induced), positive (AR-induced, treated with lentiviral-mmu-miR-135a), and negative (AR-induced, treated with empty lentivirus) mice using flow cytometry. (A) Representative dot plots from each experimental group. The percentages of CD4 + T-bet + T cells (B) and CD4 + GATA-3 + T cells (C) were also calculated. Data are presented as the mean +- SEM. *P

- Submitted by
- Invitrogen Antibodies (provider)
- Main image
- Experimental details
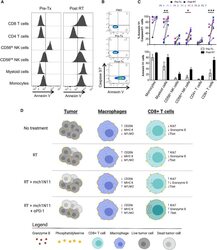
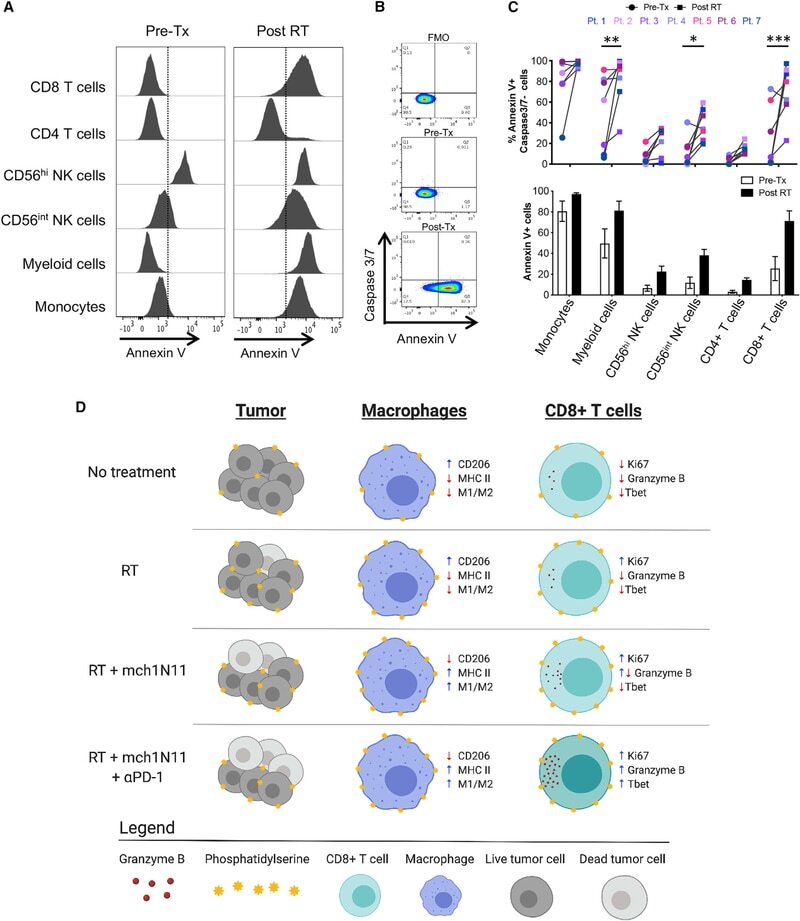
- Figure 7. Melanoma Patients Demonstrated an Overall Increase of PS Expression on Immune Subsets in the Blood 4-7 Days after RT Peripheral blood was collected from 7 melanoma patients before and 4-7 days after receiving tumor-directed RT. Freshly isolated PBMCs from each patient were stained for PS expression using annexin V on the day the blood was collected, as described in STAR Methods . (A) Histogram plots of annexin V staining of viable immune cell subsets in PBMCs from a single patient (Pt. 1) pretreatment (Tx) and post-RT. (B) Representative plots gated on live CD3+ CD8+ T cells of annexin V versus caspase-3/7 activity of PBMCs from a single patient pre-RT and 4 days post-RT. FMO, control. (C) Top: individual values for each patient. Bottom: average percentage +- SEM of annexin V+ immune cell subsets pre-RT and post-RT. *p < 0.05, ***p < 0.005. (D) Model summarizing the effects of targeting PS with RT and anti-PD-1 on immune cell activation.
- Submitted by
- Invitrogen Antibodies (provider)
- Main image
- Experimental details
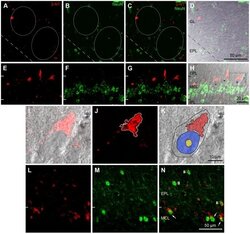
- Figure 5 Cellular localization of 3-NT in the OB of aged mice by double-labeling immunohistochemistry with two neuronal markers, anti-NeuN (A-H) and anti-TBX21 (L-N). A-D: Glomerular layer. A: Small and large 3-NT-labeled puncta (red) are seen within the glomeruli (circles) and in the periglomerular region. B: Numerous periglomerular cells localized in the periglomerular region are labeled with anti-NeuN (green), a neuronal cell marker. C: In this merged image of A and B, few 3-NT labeled puncta are localized in NeuN-labeled periglomerular cells. D: A transmission light micrograph overlaid with C. E-H: Mitral cell layer (MCL) and 2 adjacent regions of the external plexiform layer (EPL) and the inner plexiform layer (IPL). E: Large 3-NT-labeled puncta are clearly seen on the border of the MCL and EPL. F: Many NeuN-labeled granule cells located in the MCL are observed. G: In this merged image of E and F, large 3-NT-labeled puncta are not localized to NeuN-labeled granule cells. H: In a transmission light micrograph overlaid with G, the large 3-NT-labeled puncta are exclusively localized externally to putative NeuN-negative mitral cells (asterisks). The rectangular area is magnified in I-K. I-K: A mitral cell. I: In a transmission light micrograph overlaid with red immunofluorescence, the 3-NT-labeled puncta with triangular shape is clearly seen in the apical portion of a putative mitral cell. J: In the confocal image using the red channel for 3-NT immunoreactivity, the labeled

- Submitted by
- Invitrogen Antibodies (provider)
- Main image
- Experimental details
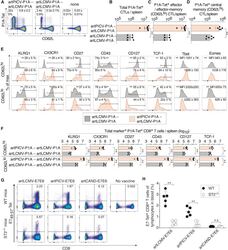
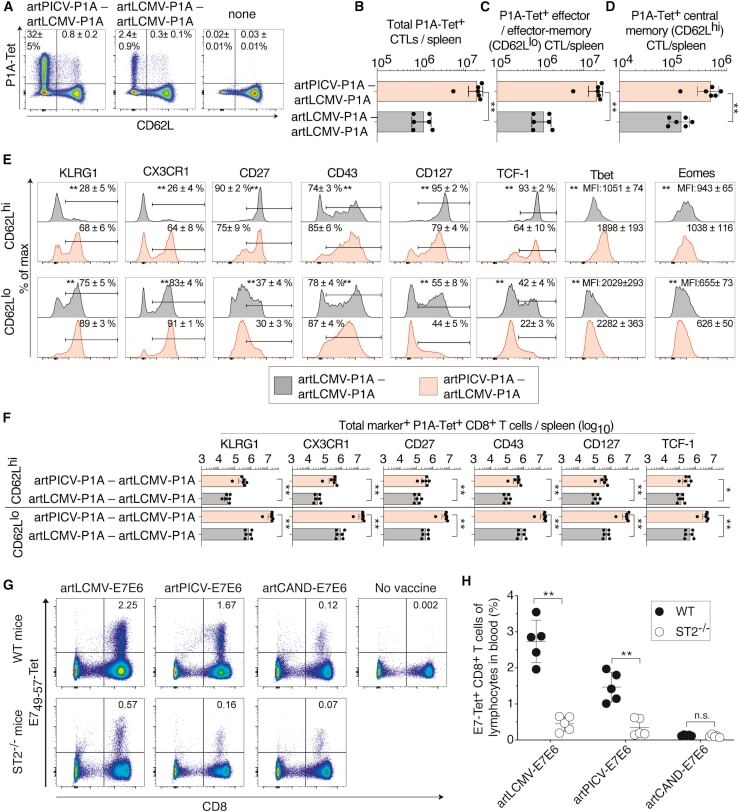
- Figure 4 Phenotype of artARENA-induced CTLs and their dependence on IL-33-ST2 alarmin signaling (A-F) We immunized BALB/c mice with artPICV-P1A and artLCMV-P1A in homologous or heterologous prime-boost vaccination i.v. on day 0 and day 27. On day 34, we analyzed P1A-Tet-binding and CD62L expression by splenic CD8 + T cells (A; gated on CD8 + B220 - lymphocytes). Unimmunized control mice are shown for comparison in (A) only. Numbers in (A) indicate the percentage of cells in the respective quadrant. Total P1A-Tet + CTLs (B), P1A-specific effector/effector memory CTLs (CD62L lo ; C), and P1A-specific central memory CTLs (CD62L hi ; D) were enumerated in the spleen on day 34. In both subsets of P1A-specific CTLs, CD62L hi and CD62L lo , we determined the surface expression of KLRG1, CX3CR1, CD27, CD43, and CD127 as well as the master transcription factors Tcf-1, Tbet, and Eomes (E). Total numbers of marker-expressing P1A-specific CTLs were enumerated in (F). (A) shows representative FACS plots from individual mice. Symbols in (B)-(D) and (F) represent individual mice, and bars in (B)-(D) and (F) indicate the mean +- SD. Numbers in (A) and (E) indicate the percentage of gated cells (mean +- SD) or the mean fluorescence intensity (MFI +- SD). Means were calculated from six mice per immunization group (A-F) or from three unimmunized controls (A). N = 2. **p < 0.01 by unpaired two-tailed Student''s t test. (G and H) We immunized ST2 -/- and WT mice with artLCMV-E7E6, artPICV-E7E6 or
- Submitted by
- Invitrogen Antibodies (provider)
- Main image
- Experimental details
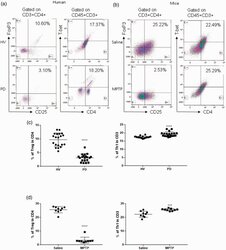
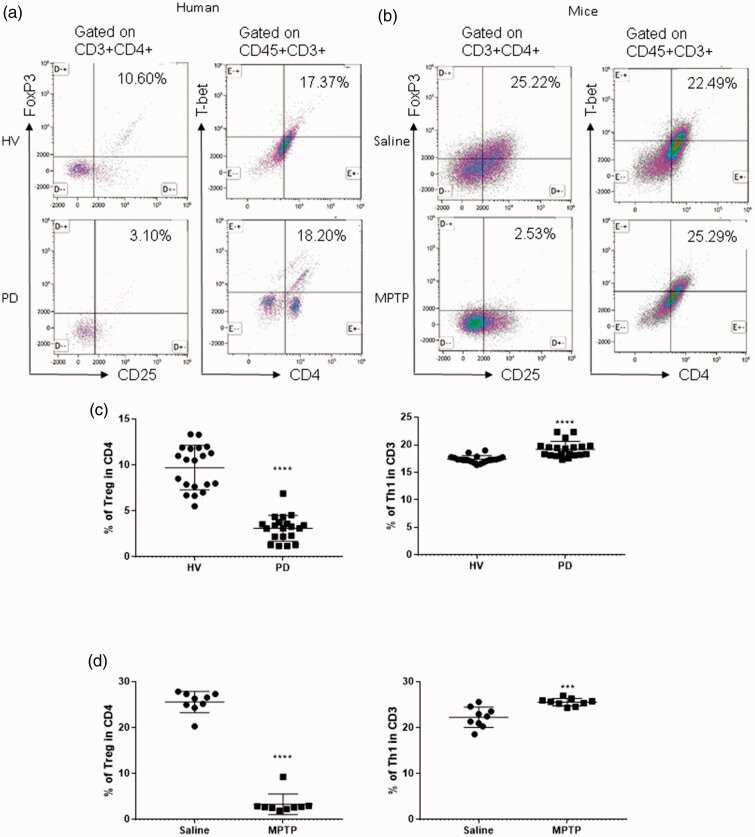
- Figure 1. Patients with Parkinson's disease (PD) and mice with experimental PD exhibit decreased regulatory T (Treg) and increased T helper 1 (Th1) cell numbers in the blood. Treg cells were defined as CD3+CD4+CD25+FoxP3+ cells, whereas Th1 cells were identified as CD3+CD4+T-bet+ cells. (a) Representative plots of Treg and Th1 cells in patients with PD and healthy volunteers (HVs). (b) Representative plots of Treg and Th1 cells in control mice (Saline) and 1-methyl-4-phenyl-1,2,3,6-tetrahydropyridine (MPTP)-treated mice. (c) Patients with PD exhibited lower Treg cell levels and greater Th1 cell levels in the blood than HVs. n = 20. ****, p < 0.0001 by a two-tailed Student's t tests. (d) MPTP-induced experimental PD mice had fewer Treg and more Th1 cells in the circulation than saline-treated mice. n = 9/group in each experiment performed in triplicate. ***, p < 0.001; ****, p < 0.0001, according to Student's t test.
- Submitted by
- Invitrogen Antibodies (provider)
- Main image
- Experimental details
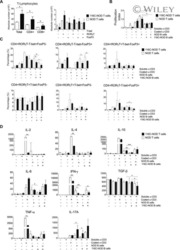
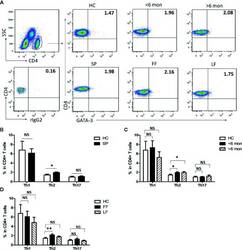
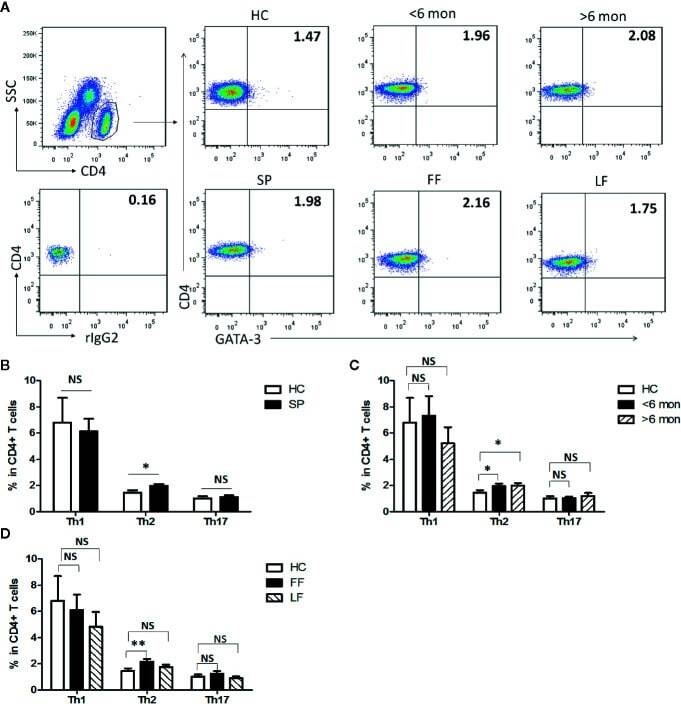
- Figure 1 Altered distribution of Th1, Th2, and Th17 in PBMCs of patients. (A) PBMCs were stained intracellularly with T-bet, GATA-3, and ROR-gammat mAbs after surface staining of CD4 mAb. According to CD4 staining and SSC, CD4 + T cells were gated. The parameters shown in quadrants of the representative graphs are mean frequency of GATA-3 for each group. (B-D) The average percentages of CD4 + T-bet + Th1, CD4 + GATA-3 + Th2, CD4 + ROR-gammat + Th17 are compared between HC (n = 24) and whole patients (n = 50) as well as subgroups of patients (SD, n = 24; LD, n = 26; FF, n = 33; LF, n = 17). Error bars represent mean+-SD. ** P < 0.01, * P < 0.05, and NS P >= 0.05.
- Submitted by
- Invitrogen Antibodies (provider)
- Main image

- Experimental details
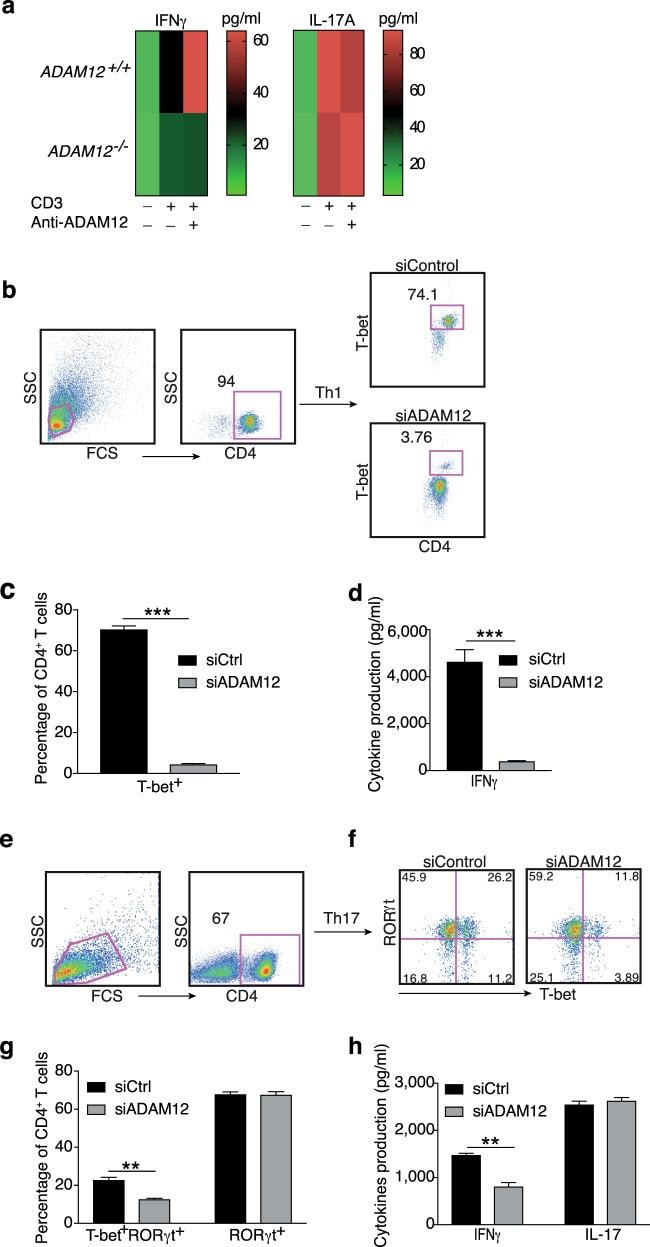
- Fig. 3 ADAM12 is essential for T-bet expression in T cells and IFNgamma production. a ADAM12 +/+ and ADAM12 -/- T cells were treated with plate-bound anti-CD3 (5 mug/ml) and anti-ADAM12 (10 mug/ml) for 3 days. Cell-culture supernatants were collected for ELISA. MOG 35-55 -specific T cells treated with MOG 35-55 (50 mug/ml), IL-12 (20 ng/ml), anti-IL-4 (10 mug/ml), and siRNAs (siControl or siADAM12) for 72 h. b FACS dot plots of the gating strategy and T-bet staining in CD4 + T cells. c Quantification of FACS results from b . d IFNgamma production in Th1 cell cultures by ELISA. Graphs in c, d are mean +- SEM from three independent experiments. *** P < 0.001 by Student's t test. Th17 cells polarized in vitro. e , f Representative FACS plots of gating strategy and T-bet- and RORgammat-stained CD4 + T cells. g Quantification of FACS results from a representative experiment--i.e., from two independent experiments. Graphs are mean +- SEM, N = 3. h IFNgamma and IL-17 production in Th17 cell cultures, by ELISA from three independent experiments. ** P < 0.01 by two-way ANOVA with post-Tukey's multiple comparisons test
- Submitted by
- Invitrogen Antibodies (provider)
- Main image
- Experimental details
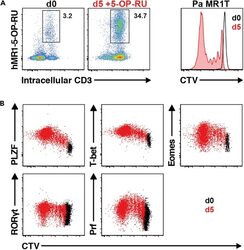
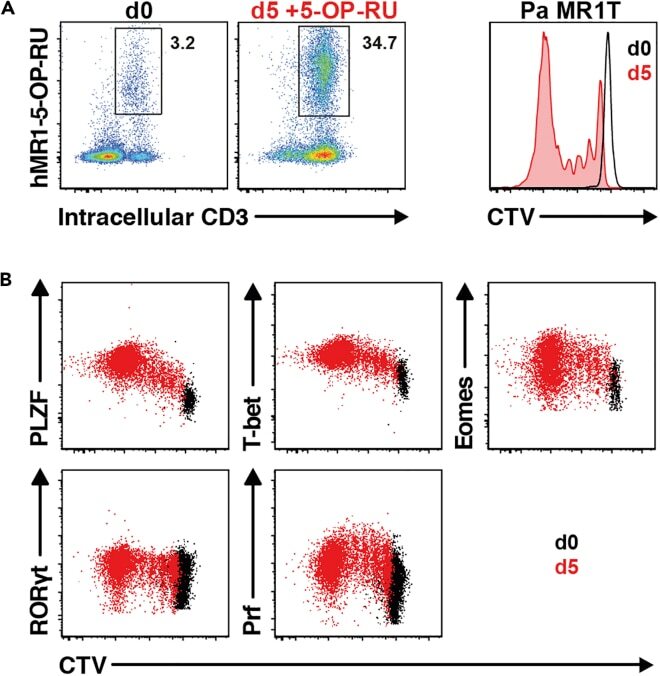
- Figure 13 Pa MR1T cell antigen-specific proliferation assay (A) Representative FACS plots showing frequencies of Pa MR1T cells (defined as CD3 + hMR1-5-OP-RU + ) and CTV dilution on day 0 and day 5 of culture with 5-OP-RU from a single Pa donor. (B) Representative FACS plots showing the expression levels of different transcription factors (PLZF, T-bet, Eomes, and RORgammat) and Perforin against CTV at the two different timepoints. Figure adapted and reprinted with permission from ().
- Submitted by
- Invitrogen Antibodies (provider)
- Main image

- Experimental details
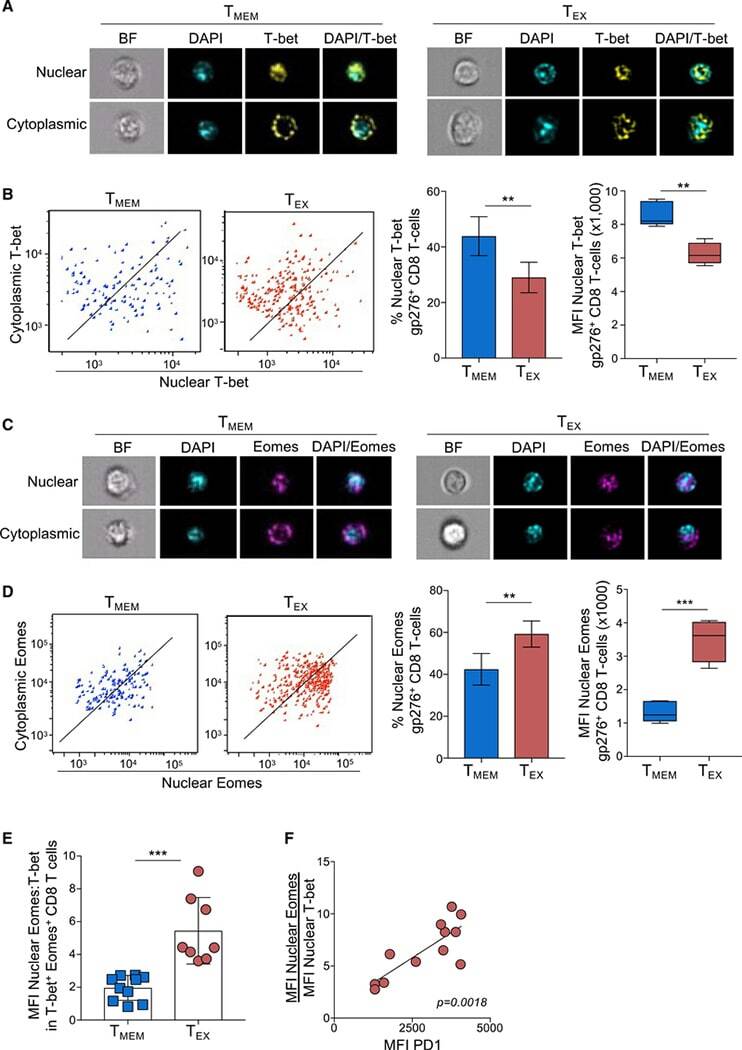
- Figure 1. Exhausted CD8 T cells have a high ratio of nuclear Eomes to T-bet that correlates with PD-1 expression during LCMV infection ImageStream analysis was performed on CD8 + T cells from Armstrong-immune (T MEM , blue)- or clone 13 (T EX , red)-infected mice at day 30 p.i. (A) Representative cell images acquired in IDEAS software from an Armstrong-immune mouse (T MEM , left) or chronic clone 13 mouse (T EX, right) are shown. Splenocytes were permeabilized and stained with T-bet (yellow). The location of the nucleus is indicated by DAPI (cyan). (B) Representative ImageStream flow plots displaying T-bet localization in T MEM s or T EX s are shown (left). Bar graphs display the frequency and median fluorescence intensity (MFI) of nuclear T-bet in LCMV-specific H-2D b gp276 + CD8 + T cells (right). (C) Representative cell images acquired in IDEAS software from an Armstrong-immune mouse (T MEM , left) or chronic clone 13 mouse (T EX , right) are shown. Splenocytes were permeabilized and stained with Eomes (magenta). The location of the nucleus is indicated by DAPI (cyan). (D) Representative ImageStream flow plots displaying Eomes localization are shown (left). Bar graphs show the frequency and MFI of nuclear Eomes in LCMV-specific H-2D b gp276 + CD8 + T cells (right). (E) The ratio of the MFI of nuclear Eomes:T-bet in LCMV-specific H-2D b gp276 + T-bet + Eomes + CD8 T cells is shown. (F) A correlation plot displaying the ratio of the MFI of nuclear Eomes:T-bet versus MFI of P
- Submitted by
- Invitrogen Antibodies (provider)
- Main image
- Experimental details
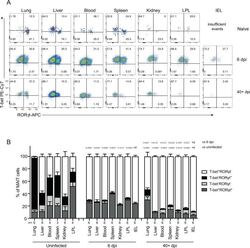
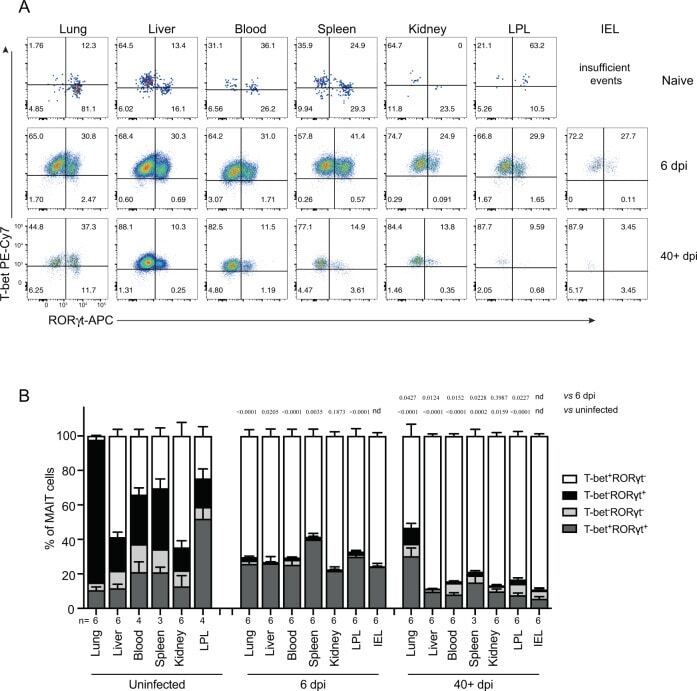
- Fig. 4 MAIT cells were polarized to functional MAIT-1 phenotype upon F. tularensis infection. A Representative flow cytometry plots showing intranuclear staining for T-bet (representing Th1) and RORgammat (Th17) in gated MAIT cells from the liver, lungs, spleen, kidneys, LPL, IEL, and blood of naive and infected mice on 6 and 40+ dpi (41 and 68 dpi in two experiments) with 10 4 CFU F. tularensis LVS i.v. Numbers in quadrants represent cell percentage. It is noteworthy that IEL from naive mice yielded insufficient numbers of MAIT cells for accurate assessment of transcription factor expression and, thus, were omitted from our analysis. B Percentage of MAIT cells expressing combinations of T-bet and RORgammat from the same mice in A . Pooled data from two independent experiments (mean +- SEM, n = 3-6 mice per group, as indicated). One-way ANOVA with Tukey's multiple comparisons test was performed on MAIT-1% in each organ (except for IEL) between time points as indicated; p -values are indicated, nd; not determined. Source data are provided as a Source Data file.
- Submitted by
- Invitrogen Antibodies (provider)
- Main image
- Experimental details
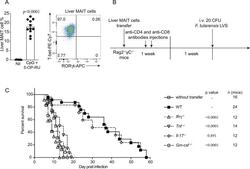
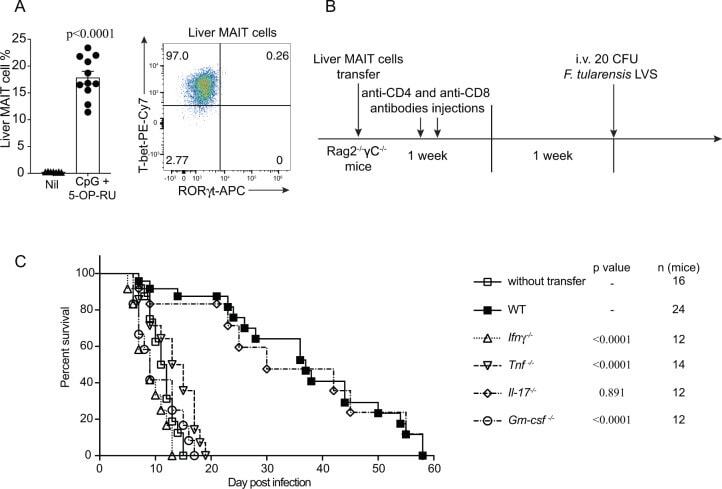
- Fig. 7 MAIT cell-mediated protection in immune-compromised mice requires IFNgamma, TNF, and GM-CSF. A MAIT cell percentage of alphabeta-T cells in the liver and representative FACS plot showing intranuclear staining for T-bet and RORgammat of MAIT cells from donor C57BL/6 mice vaccinated with CpG and 5-OP-RU i.v. for 7 days, prior cell sorting for adoptive cell transfer. Pooled data from 7 (nil) or 11 (vaccinated) mice from 3 independent experiments (mean +- SEM). Unpaired t -test (two-tailed). P < 0.0001. B Schematic of protocol for MAIT cell adoptive transfer and F. tularensis LVS challenge: 10 5 liver MAIT cells from C57BL/6 (WT, shown in A ), Ifngamma -/- , Tnf -/- , Gm-csf -/- , or Il-17 -/- mice vaccinated with CpG (10 nmol) and 5-OP-RU (2 nmol) i.v. for 7 days were sorted by flow cytometry and transferred i.v. into Rag2 -/- gammaC -/- mice. The mice were treated with anti-CD4 and anti-CD8 mAb injection (i.p., 0.1 mg each) at days 1 and 3 post MAIT cell transfer, to deplete contaminating conventional T cells. After 2 weeks, mice were infected with an otherwise lethal dose (20 CFU) of F. tularensis LVS i.v. C Survival of untreated Rag2 -/- gammaC -/- mice or Rag2 -/- gammaC -/- mice following transfer of MAIT cells from WT, Ifngamma -/- , Tnf -/- , Gm-csf -/- , or Il-17 -/- mice according to schematic shown in B . Pooled data from two independent experiments with similar results ( n = 12-24 mice per group, as indicated). Log-rank tests ( Ifngamma -/- , Tnf -/- , Gm-csf -
- Submitted by
- Invitrogen Antibodies (provider)
- Main image
- Experimental details
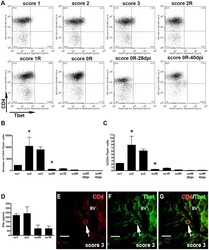
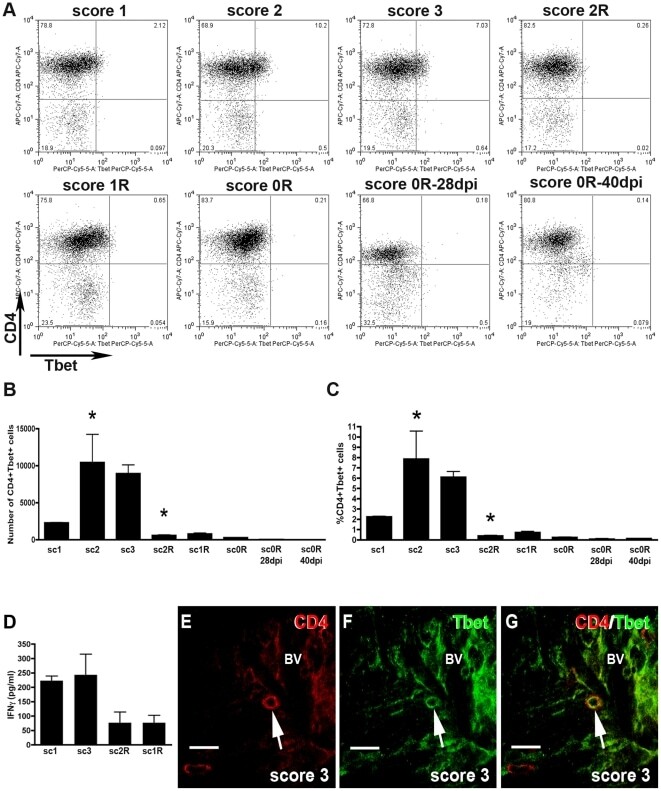
- Figure 3 Dynamics of Th1 cell population. A) Representative dot-plots of the population of CD4+Tbet+ cells of EAE animals. Dot-plots were obtained by previously gating in the CD3+ T cell population. Different quadrants were defined by application of the appropriate isotype control. A minimum of three animals per group was pooled and three replicates per score were analyzed. B and C) Histogrammes showing, respectively, the values corresponding to the total number and the percentage of CD4+Tbet+ cell population along EAE. Note that CD4+Tbet+ lymphocytes are found during the induction and peak phases and markedly decreased at score 2R of the recovery phase (ANOVA and Tukey's post-hoc test, *p
- Submitted by
- Invitrogen Antibodies (provider)
- Main image

- Experimental details
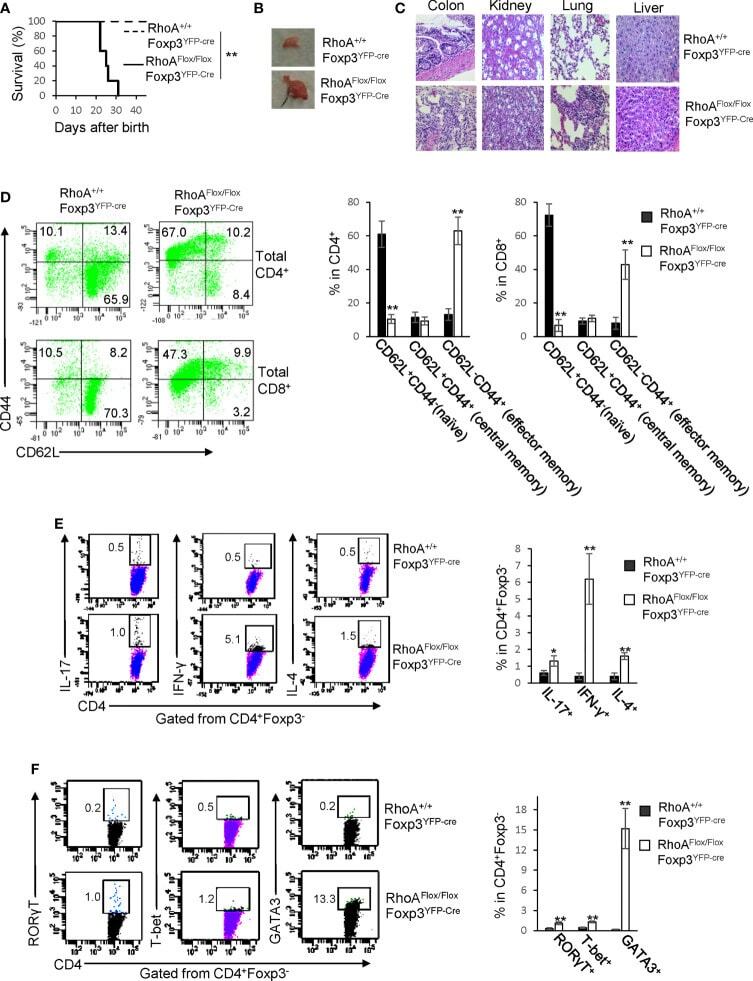
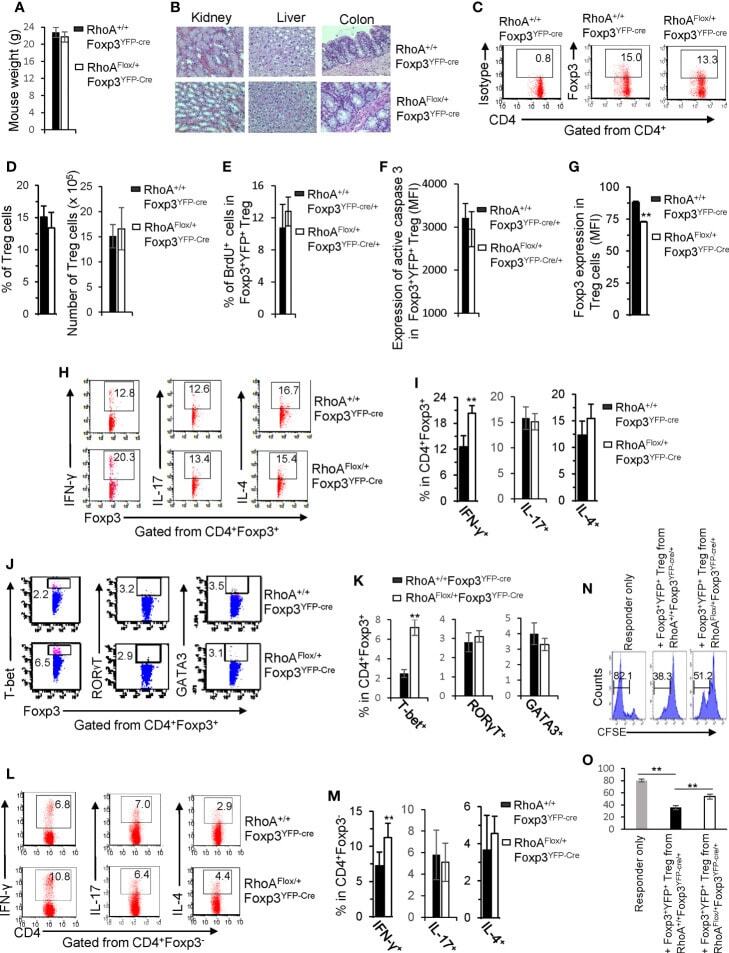
- Figure 1 Homozygous RhoA deletion in Treg cells leads to early, fatal spontaneous inflammatory disorders. (A) Survival outcome of RhoA +/+ Foxp3 YFP-Cre and RhoA Flox/Flox Foxp3 YFP-Cre mice. Results were analyzed with a log-rank (Mantel-Cox) test and expressed as Kaplan-Meier survival curves. (B) Image of lymphadenopathy in RhoA Flox/Flox Foxp3 YFP-Cre mice. Inguinal lymph nodes are shown. (C) Images of H&E staining of the indicated organs from RhoA +/+ Foxp3 YFP-Cre and RhoA Flox/Flox Foxp3 YFP-Cre mice (original magnification X 400). (D) Left, representative flow cytogram of CD44 and CD62L staining in CD4 + and CD8 + cells from the spleen of RhoA +/+ Foxp3 YFP-Cre and RhoA Flox/Flox Foxp3 YFP-Cre mice. The numbers indicate percentages of CD44 + , CD44 + CD62L + , and CD62L + cells. Right, average percentages of CD44 + , CD44 + CD62L + , and CD62L + cells. (E) Left, representative flow cytogram of IL-17, IFN-gamma, and IL-4 staining in CD4 + Foxp3 - cells from the spleen of RhoA +/+ Foxp3 YFP-Cre and RhoA Flox/Flox Foxp3 YFP-Cre mice. The numbers indicate percentages of IL-17 + , IFN-gamma + , and IL-4 + cells. Right, average percentages of IL-17 + , IFN-gamma + , and IL-4 + cells. (F) Left, representative flow cytogram of RORgammaT, T-bet and GATA3 staining in CD4 + Foxp3 - cells from the spleen of RhoA +/+ Foxp3 YFP-Cre and RhoA Flox/Flox Foxp3 YFP-Cre mice. The numbers indicate percentages of RORgammaT + , T-bet + , and GATA3 + cells. Right, average percentages of RORgam
- Submitted by
- Invitrogen Antibodies (provider)
- Main image
- Experimental details
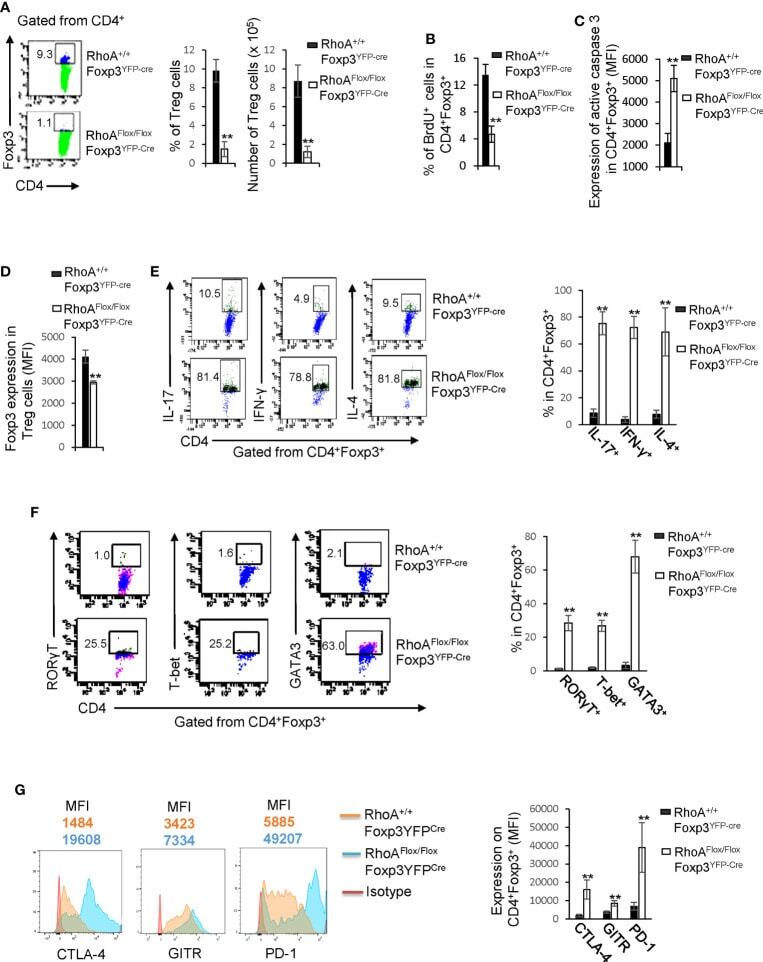
- Figure 2 Homozygous RhoA deletion in Treg cells dampens Treg cell homeostasis and induces Treg cell plasticity. (A) Left, representative flow cytogram of Foxp3 staining in CD4 + cells from the spleen of RhoA +/+ Foxp3 YFP-Cre and RhoA Flox/Flox Foxp3 YFP-Cre mice. The numbers indicate percentages of CD4 + Foxp3 + Treg cells. Middle, average percentages of CD4 + Foxp3 + Treg cells. Right, average numbers of CD4 + Foxp3 + Treg cells. (B) Treg cell proliferation. Percentages of CD4 + Foxp3 + Treg cells incorporated with BrdU are shown. (C) Treg cell apoptosis. The expression levels (MFI: Mean fluorescence intensity) of active caspase 3 in CD4 + Foxp3 + Treg cells are shown. (D) The expression levels of Foxp3 in Treg cells. (E) Left, representative flow cytogram of IL-17, IFN-gamma, and IL-4 staining in CD4 + Foxp3 + Treg cells. The numbers indicate percentages of IL-17 + , IFN-gamma + , and IL-4 + Treg cells. Right, average percentages of IL-17 + , IFN-gamma + , and IL-4 + Treg cells. (F) Left, representative flow cytogram of RORgammaT, T-bet and GATA3 staining in CD4 + Foxp3 + Treg cells. The numbers indicate percentages of RORgammaT + , T-bet + , and GATA3 + Treg cells. Right, average percentages of RORgammaT + , T-bet + , and GATA3 + Treg cells. (G) Left, representative histogram of the expression levels of CTLA-4, GITR and PD-1 in CD4 + Foxp3 + Treg cells. The numbers above the graphs indicate MFI. Right, average MFI of CTLA-4, GITR and PD-1 in CD4 + Foxp3 + Treg cells. n =
- Submitted by
- Invitrogen Antibodies (provider)
- Main image
- Experimental details
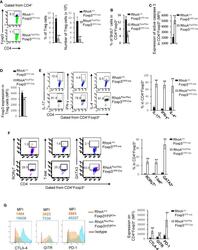
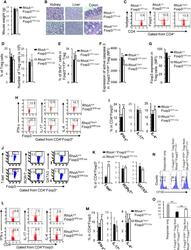
- Figure 5 Heterozygous RhoA deletion in Treg cells induces Treg cell plasticity and increases CD4 + effector T cells but does not result in autoimmunity. (A) Body weight of RhoA +/+ Foxp3 YFP-Cre and RhoA Flox/+ Foxp3 YFP-Cre mice. (B) Images of H&E staining of the indicated organs. (C) Representative flow cytogram of Foxp3 staining in CD4 + cells from the spleen of RhoA +/+ Foxp3 YFP-Cre and RhoA Flox/+ Foxp3 YFP-Cre mice. The numbers indicate percentages of CD4 + Foxp3 + Treg cells. (D) Left, average percentages of CD4 + Foxp3 + Treg cells. Right, cell numbers of CD4 + Foxp3 + Treg cells. (E) Proliferation of Foxp3 + YFP + Treg cells from RhoA +/+ Foxp3 YFP-Cre/+ and RhoA Flox/+ Foxp3 YFP-Cre/+ female mice. Percentages of Foxp3 + YFP + Treg cells incorporated with BrdU are shown. (F) Apoptosis of Foxp3 + YFP + Treg cells from RhoA +/+ Foxp3 YFP-Cre/+ and RhoA Flox/+ Foxp3 YFP-Cre/+ female mice. The expression levels (MFI: mean fluorescence intensity) of active caspase 3 in Foxp3 + YFP + Treg cells are shown. (G) The expression levels of Foxp3 in Treg cells from RhoA +/+ Foxp3 YFP-Cre and RhoA Flox/+ Foxp3 YFP-Cre mice. (H) Representative flow cytogram of IFN-gamma, IL-17 and IL-4 staining in CD4 + Foxp3 + Treg cells. The numbers indicate percentages of IFN-gamma + , IL-17 + and IL-4 + Treg cells. (I) Average percentages of IFN-gamma + , IL-17 + and IL-4 + Treg cells. (J) Representative flow cytogram of RORgammaT, T-bet and GATA3 staining in CD4 + Foxp3 + Treg cells. The numb
- Submitted by
- Invitrogen Antibodies (provider)
- Main image
- Experimental details
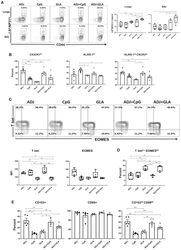
- Figure 2 Effector CD4 T Cell Response to Adjuvanted Vaccines Groups of C57BL/6 mice were vaccinated IN, as in Figure 1 . At day 8 PV, cells from lungs and BAL were stained with I-A b /NP311 tetramers along with antibodies to cell surface molecules and transcription factors. (A) FACS plots show the percentages of I-A b /NP311 tetramer-binding cells among CD4 T cells. (B) Percentages of the indicated cell population among NP311-specific, tetramer-binding CD4 T cells. (C) FACS plots are gated on I-A b /NP311 tetramer-binding cells, and the numbers in each quadrant are the percentages of cells among the gated population; MFIs for transcription factors in NP311-specific CD4 T cells are plotted in the adjoining graphs. (D) FACS plots in (C) were used to quantify the percentages of T-bet LO EOMES HI cells (quadrant 4) among NP311-specific CD4 T cells. (E) Percentages of CD103 HI and CD69 HI cells among NP311-specific CD4 T cells. Data are representative of two independent experiments. Comparisons were made using one-way ANOVA test with Tukey-corrected multiple comparisons; *p < 0.05, **p < 0.01, and ***p < 0.001.

- Submitted by
- Invitrogen Antibodies (provider)
- Main image
- Experimental details
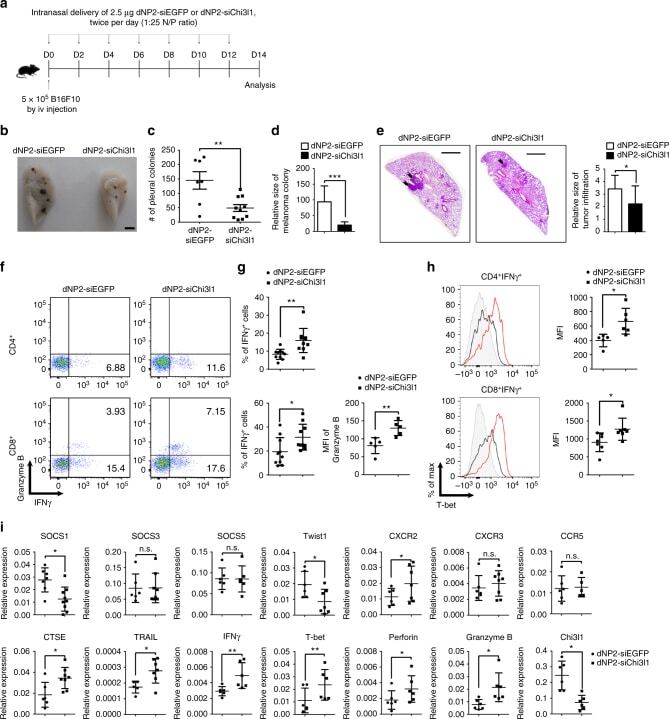
- Fig. 9 In vivo administration of dNP2-siChi3l1 complex inhibits pulmonary metastasis with enhanced Th1 and CTL effector molecules. a Experimental scheme of dNP2-siRNA complex treatment in pulmonary melanoma metastasis model. b Representative lung image of dNP2-siEGFP and dNP2-siChi3l1-treated mice. Scale bar, 2 mm c Number of pleural colonies in each lung was counted. Data are mean +- SEM of three sets of independent experiments and each dot in graphs represent an individual mouse. d Relative total tumor area in the lung was measured by Image J software 1.48 v. e Histology of lung sections by H&E staining, and infiltrated tumor region was measured by Image J software 1.48 v. Scale bar, 200 m f , g IFNgamma producing CD4 and CD8 T cells, and Granzyme B expression level in IFNgamma + CD8 T cells in the lung was analyzed by intracellular staining. % of IFNgamma + , and MFI of Granzyme B was represented as scattered graph. h Intracellular T-bet expression level in CD4 + IFNgamma + and CD8 + IFNgamma + population. MFI was represented as scattered graph. i mRNA expression of genes related to cytotoxicity and Th1 effector functions was analyzed by quantitative RT-PCR. Each gene expression level was normalized to beta-actin. Data are mean +- SD of three sets of independent experiments and each dot in graphs represent an individual mouse. n.s., not significant; * p < 0.05, ** p < 0.01, *** p < 0.001 (two-tailed Student's t -test)
- Submitted by
- Invitrogen Antibodies (provider)
- Main image
- Experimental details
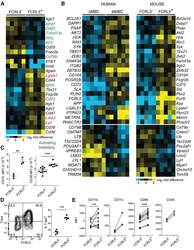
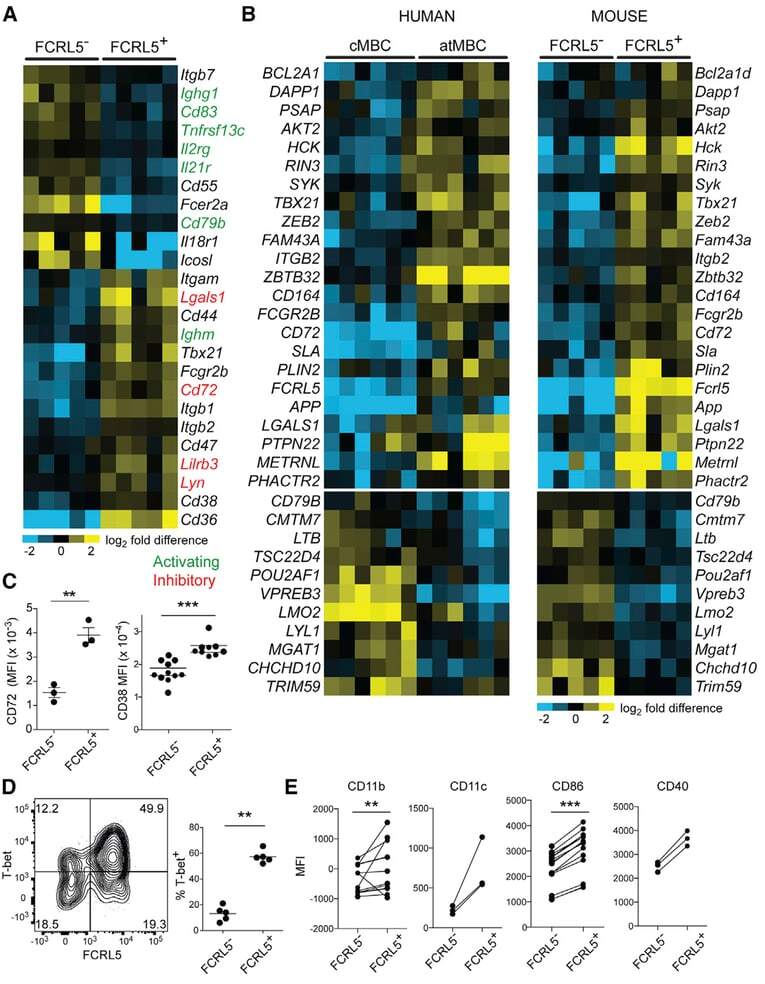
- Figure 2. Similarities between Infection-Induced Mouse FCRL5 + B Cells and atMBCs from Plasmodium -Infected Humans (A) RNA-seq was performed on class-switched (IgM - IgD - ), FCRL5 - or FCRL5 + B cells sorted from the blood of Ifngr1 - / - mice infected for 21 days with P. chabaudi . Columns represent individual mice (n = 5). Select genes involved in immune signaling are shown. Genes with putative activating function are labeled in green; those with putative inhibitory function are labeled in red. (B) Heatmaps depict all genes that are differentially regulated in both human atMBCs (left) and mouse FCRL5 + B cells, relative to cMBCs and FCRL5 - B cells, respectively. Human data are from . (C-E) Expression of (C) CD72 and CD38, (D) T-bet, and (E) CD11b, CD11c, CD86, and CD40 were measured by flow cytometry in blood B cells 21 d.p.i. **p < 0.01; ***p < 0.001 by paired t test (Wilcoxon rank-sum test). See also Figure S2 and Tables S1 and S2 .
- Submitted by
- Invitrogen Antibodies (provider)
- Main image

- Experimental details
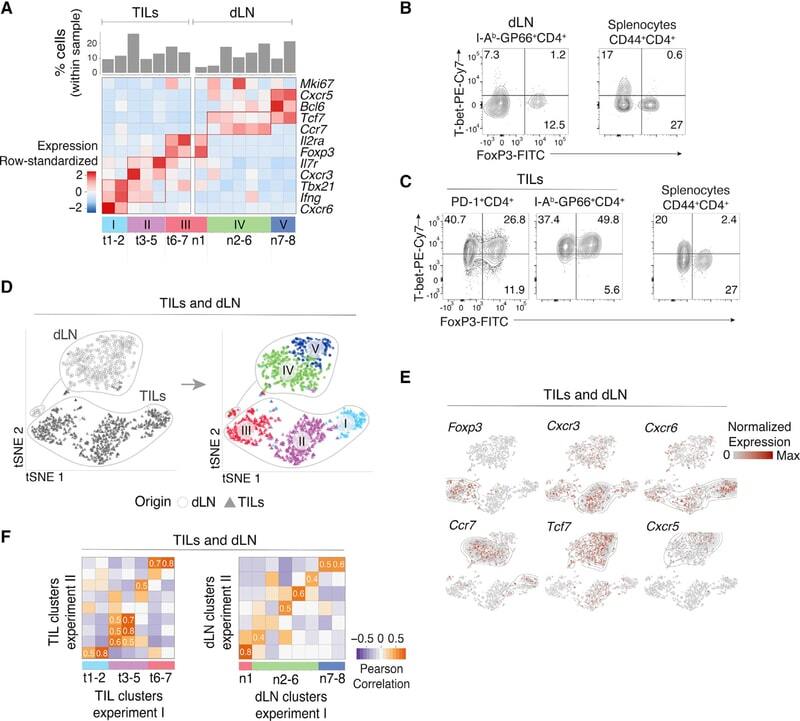
- Figure 1. Characterization of CD4 + TIL, dLN, and Arm Transcriptomes by scRNA-Seq (A-D) TILs and dLN cells from wild-type (WT) mice at day 14 after MC38-GP injection analyzed by scRNA-seq and flow cytometry. (A) Heatmap shows row-standardized expression of selected genes across TIL and dLN clusters. Bar plot indicates the percentage of cells in each cluster relative to the total TIL or dLN cell number. (B) Flow cytometry contour plots of Foxp3 versus T-bet in CD44 hi GP66 + dLN cells (left) and in CD44 hi CD4 + splenocytes from tumor-free control mice (right). (C) Flow cytometry contour plots of Foxp3 versus T-bet in PD-1 + and GP66 + TILs (left) and in CD44 hi CD4 + splenocytes from tumor-free control mice (right). (B and C) Data representative from 18 tumor-bearing mice analyzed in four separate experiments. (D) t-SNE display of TILs and dLN cells, shaded gray by tissue origin (left) or color coded by main group (right, as defined in A). (E) t-SNE (TIL and dLN cell positioning as shown in B) display of normalized expression levels of selected genes. (F) Heatmap shows Pearson correlation between cluster fold change vectors (as defined in the text) across the two replicate experiments for TILs (left) and dLN cells (right). See also Figures S1 and S2 and Tables S1 and S6 .
- Submitted by
- Invitrogen Antibodies (provider)
- Main image

- Experimental details
- Figure 3. Th1-like Transcriptomic Patterns (A) Heatmap defines meta-clusters based on Pearson correlation among TIL, dLN, and Arm cluster fold change vectors (as defined in the text) (left). Tables show tissue origin and cell-type color code per cluster (right). (B and C) Comparison of TIL Th1 and Isc (clusters t1-2 and t3-4, respectively, as shown in Figure 1A ), as well as Arm Th1 (as shown in Figures 2 and S2A ). (B) Contour plots of Th1 (orange) and Isc (blue) TIL distribution according to scRNA-seq-detected normalized expression of Irf7 versus Ifit3b (left) and Klrc1 versus Lag3 (right). (C) Heatmap shows row-standardized expression of differentially expressed genes across TIL group II Isc, TIL group I Th1, and Arm Th1. (D) (Left) Flow cytometry contour plots of NKG2A versus CD94 (top) or IRF7 (bottom) in Foxp3 - GP66 + dLN, TIL, and Arm cells. (Right) Percentage of NKG2A + CD94 + cells (top) and IRF7 hi NKG2A - cells (bottom) among Foxp3 - GP66 + CD4 + T cells; each symbol represents an individual mouse. (E) Overlaid protein expression of T-bet in NKG2A + and NKG2A - Foxp3 - GP66 + TILs (left). The graph on the right summarizes quantification (mean fluorescence intensity, MFI) of T-bet in each subset, expressed relative to naive CD4 + splenocytes from tumor-free control mice. Each symbol represents an individual mouse; lines indicate pairing. (F) Flow cytometry contour plots of T-bet versus IRF7 in Foxp3 - GP66+ dLN, TILs, and Arm cells; data from naive CD4 + splenocyte

- Submitted by
- Invitrogen Antibodies (provider)
- Main image
- Experimental details
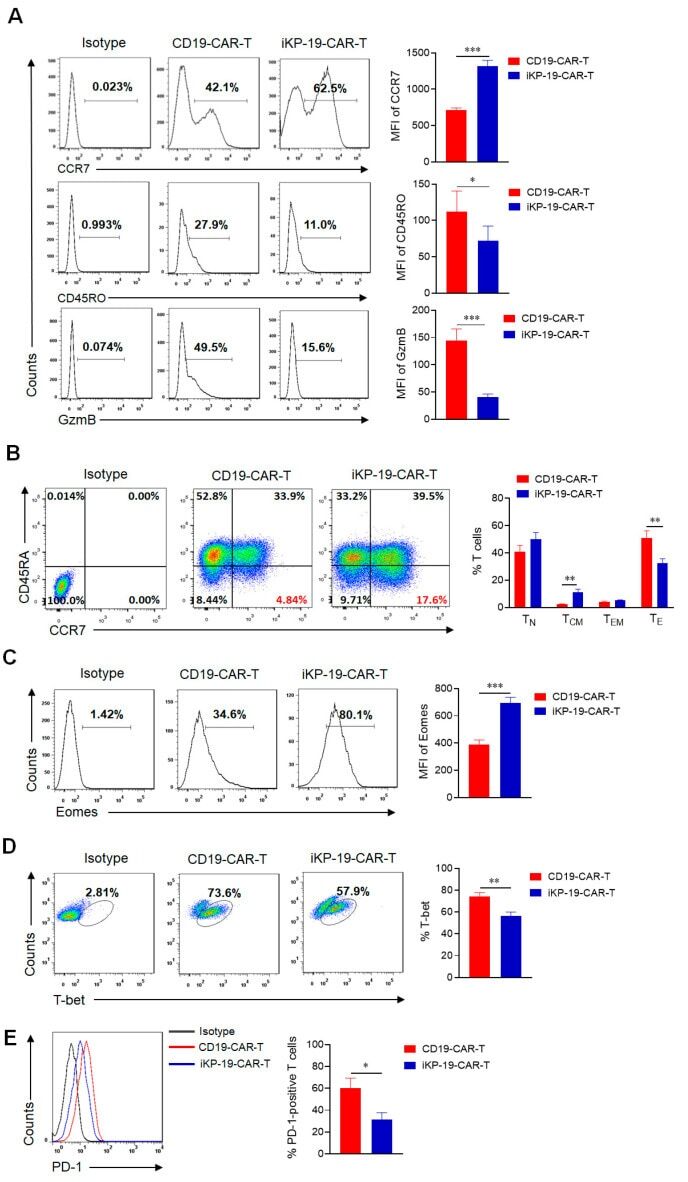
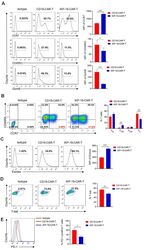
- Figure 3 Characteristics of iKP-19-CAR-T cells and CD19-CAR-T cells. iKP-19-CAR-T cells or CD19-CAR-T cells were cultured for 10 days in X-VIVO media supplemented with 100 U/mL IL-2. ( A ) The expression of T cell differentiation markers in CAR-T cells was analyzed by flow cytometry using PE/Cy7-anti-human CCR7 antibody, PE-anti-human-CD45RO antibody and PE-anti-human GzmB antibody ( n = 4 different donors). ( B ) The frequency of naive (T N ; CCR7 + CD45RA + ), T CM (CCR7 + CD45RA - ), effector memory (T EM ; CCR7 - CD45RA - ) or effector (T E ; CCR7 - CD45RA + ) T cells were analyzed by flow cytometry using PE/Cy7-anti-human CCR7 antibody and FITC-anti-human CD45RA antibody ( n = 4 different donors). ( C ) The expression of transcription factor Eomes in CAR-T cells was analyzed by flow cytometry using FITC-anti-human Eomes antibody ( n = 4 different donors). ( D ) The expression of transcription factor T-bet in CAR-T cells was analyzed by flow cytometry using PE-anti-human T-bet antibody ( n = 4 different donors). ( E ) The expression of T cell exhaustion marker PD-1 in CAR-T cells was analyzed by flow cytometry using FITC-anti-human PD-1 antibody ( n = 4 different donors). All experiments were performed in triplicate manner using PBMCs from each donor and MFI or percentage was statistically analyzed. * p < 0.05, ** p < 0.01, *** p < 0.001. Error bars represent +- SD.