Explore
 Validate
 Learn
Learn Flow cytometry
Antibody data
- Antibody Data
- Antigen structure
- References [14]
- Comments [0]
- Validations
- Flow cytometry [2]
- Other assay [18]
Submit
Validation data
Reference
Comment
Report error
- Product number
- 48-5825-82 - Provider product page

- Provider
- Invitrogen Antibodies
- Product name
- T-bet Monoclonal Antibody (eBio4B10 (4B10)), eFluor™ 450, eBioscience™
- Antibody type
- Monoclonal
- Antigen
- Other
- Description
- Description: The eBio4B10 monoclonal antibody reacts with mouse and human T-bet. T-bet is a Th1-specific T-box transcription factor critical to the development of the Th1 CD4+ T cell lineage. This is known based on the observations that T-Bet deficient mice have impaired Th1 cell development, and that ectopic expression of T-Bet results in development skewed to the Th1 lineage. T-Bet expression is induced by the Th1 cytokine IFN gamma, and T-Bet also regulates the expression of IFN gamma, likely, at least in part, through the modification of DNA accessibility and histone remodeling. In addition to IFN gamma, T-Bet is also known to regulate the expression of IL-12R beta and IL-2. Moreover, T-Bet plays a role in class-switch recombination in B-cells. Applications Reported: This eBio4B10 antibody has been reported for use in flow cytometric analysis. Applications Tested: This eBio4B10 antibody has been tested by flow cytometric analysis of normal human peripheral blood cells using the Foxp3/Transcription Factor Staining Buffer Set (Product # 00-5523-00) and protocol. Please refer to "Staining Intracellular Antigens for Flow Cytometry, Protocol B: One step protocol for intracellular (nuclear) proteins" located at www.thermofisher.com/flowprotocols . This may be used at less than or equal to 0.5 µg per test. A test is defined as the amount (µg) of antibody that will stain a cell sample in a final volume of 100 µL. Cell number should be determined empirically but can range from 10^5 to 10^8 cells/test. It is recommended that the antibody be carefully titrated for optimal performance in the assay of interest. eFluor 450 is an alternative to Pacific Blue. eFluor 450 emits at 446 nm and is excited with the violet laser line (405 nm). Please make sure that your instrument is capable of detecting this fluorochrome. Excitation: 405 nm; Emission: 445 nm; Laser: Violet Laser.
- Reactivity
- Human, Mouse
- Host
- Mouse
- Isotype
- IgG
- Antibody clone number
- eBio4B10 (4B10)
- Vial size
- 100 µg
- Concentration
- 0.2 mg/mL
- Storage
- 4°C, store in dark, DO NOT FREEZE!
Submitted references Graded RhoA GTPase Expression in Treg Cells Distinguishes Tumor Immunity From Autoimmunity.
Role of nuclear localization in the regulation and function of T-bet and Eomes in exhausted CD8 T cells.
Heterologous arenavirus vector prime-boost overrules self-tolerance for efficient tumor-specific CD8 T cell attack.
Culture, expansion, and flow-cytometry-based functional analysis of pteropid bat MR1-restricted unconventional T cells.
Francisella tularensis induces Th1 like MAIT cells conferring protection against systemic and local infection.
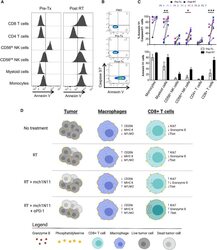
Targeting Phosphatidylserine Enhances the Anti-tumor Response to Tumor-Directed Radiation Therapy in a Preclinical Model of Melanoma.
ADAM12 is a costimulatory molecule that determines Th1 cell fate and mediates tissue inflammation.
Imbalance between T helper 1 and regulatory T cells plays a detrimental role in experimental Parkinson's disease in mice.
Th2 Biased Immunity With Altered B Cell Profiles in Circulation of Patients With Sporotrichosis Caused by Sporothrix globosa.
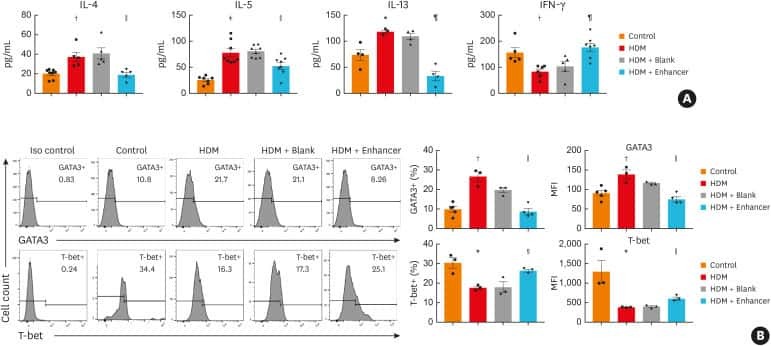
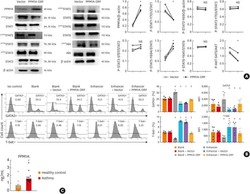
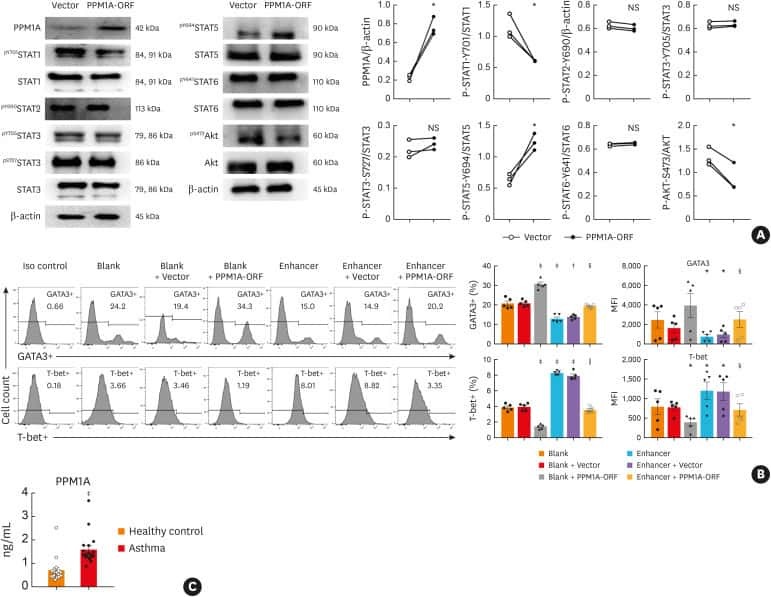
MiR-1165-3p Suppresses Th2 Differentiation via Targeting IL-13 and PPM1A in a Mouse Model of Allergic Airway Inflammation.
Programming Multifaceted Pulmonary T Cell Immunity by Combination Adjuvants.
CD19-CAR-T Cells Bearing a KIR/PD-1-Based Inhibitory CAR Eradicate CD19(+)HLA-C1(-) Malignant B Cells While Sparing CD19(+)HLA-C1(+) Healthy B Cells.
Single-Cell Profiling Defines Transcriptomic Signatures Specific to Tumor-Reactive versus Virus-Responsive CD4(+) T Cells.
FCRL5(+) Memory B Cells Exhibit Robust Recall Responses.
Kalim KW, Yang JQ, Modur V, Nguyen P, Li Y, Zheng Y, Guo F
Frontiers in immunology 2021;12:726393
Frontiers in immunology 2021;12:726393
Role of nuclear localization in the regulation and function of T-bet and Eomes in exhausted CD8 T cells.
McLane LM, Ngiow SF, Chen Z, Attanasio J, Manne S, Ruthel G, Wu JE, Staupe RP, Xu W, Amaravadi RK, Xu X, Karakousis GC, Mitchell TC, Schuchter LM, Huang AC, Freedman BD, Betts MR, Wherry EJ
Cell reports 2021 May 11;35(6):109120
Cell reports 2021 May 11;35(6):109120
Heterologous arenavirus vector prime-boost overrules self-tolerance for efficient tumor-specific CD8 T cell attack.
Bonilla WV, Kirchhammer N, Marx AF, Kallert SM, Krzyzaniak MA, Lu M, Darbre S, Schmidt S, Raguz J, Berka U, Vincenti I, Pauzuolis M, Kerber R, Hoepner S, Günther S, Magnus C, Merkler D, Orlinger KK, Zippelius A, Pinschewer DD
Cell reports. Medicine 2021 Mar 16;2(3):100209
Cell reports. Medicine 2021 Mar 16;2(3):100209
Culture, expansion, and flow-cytometry-based functional analysis of pteropid bat MR1-restricted unconventional T cells.
Sia WR, Hey YY, Foo R, Wang LF, Leeansyah E
STAR protocols 2021 Jun 18;2(2):100487
STAR protocols 2021 Jun 18;2(2):100487
Francisella tularensis induces Th1 like MAIT cells conferring protection against systemic and local infection.
Zhao Z, Wang H, Shi M, Zhu T, Pediongco T, Lim XY, Meehan BS, Nelson AG, Fairlie DP, Mak JYW, Eckle SBG, de Lima Moreira M, Tumpach C, Bramhall M, Williams CG, Lee HJ, Haque A, Evrard M, Rossjohn J, McCluskey J, Corbett AJ, Chen Z
Nature communications 2021 Jul 16;12(1):4355
Nature communications 2021 Jul 16;12(1):4355
Targeting Phosphatidylserine Enhances the Anti-tumor Response to Tumor-Directed Radiation Therapy in a Preclinical Model of Melanoma.
Budhu S, Giese R, Gupta A, Fitzgerald K, Zappasodi R, Schad S, Hirschhorn D, Campesato LF, De Henau O, Gigoux M, Liu C, Mazo G, Deng L, Barker CA, Wolchok JD, Merghoub T
Cell reports 2021 Jan 12;34(2):108620
Cell reports 2021 Jan 12;34(2):108620
ADAM12 is a costimulatory molecule that determines Th1 cell fate and mediates tissue inflammation.
Liu Y, Bockermann R, Hadi M, Safari I, Carrion B, Kveiborg M, Issazadeh-Navikas S
Cellular & molecular immunology 2021 Aug;18(8):1904-1919
Cellular & molecular immunology 2021 Aug;18(8):1904-1919
Imbalance between T helper 1 and regulatory T cells plays a detrimental role in experimental Parkinson's disease in mice.
Li W, Luo Y, Xu H, Ma Q, Yao Q
The Journal of international medical research 2021 Apr;49(4):300060521998471
The Journal of international medical research 2021 Apr;49(4):300060521998471
Th2 Biased Immunity With Altered B Cell Profiles in Circulation of Patients With Sporotrichosis Caused by Sporothrix globosa.
Zu J, Yao L, Song Y, Cui Y, Guan M, Chen R, Zhen Y, Li S
Frontiers in immunology 2020;11:570888
Frontiers in immunology 2020;11:570888
MiR-1165-3p Suppresses Th2 Differentiation via Targeting IL-13 and PPM1A in a Mouse Model of Allergic Airway Inflammation.
Wang Z, Ji N, Chen Z, Sun Z, Wu C, Yu W, Hu F, Huang M, Zhang M
Allergy, asthma & immunology research 2020 Sep;12(5):859-876
Allergy, asthma & immunology research 2020 Sep;12(5):859-876
Programming Multifaceted Pulmonary T Cell Immunity by Combination Adjuvants.
Marinaik CB, Kingstad-Bakke B, Lee W, Hatta M, Sonsalla M, Larsen A, Neldner B, Gasper DJ, Kedl RM, Kawaoka Y, Suresh M
Cell reports. Medicine 2020 Sep 22;1(6):100095
Cell reports. Medicine 2020 Sep 22;1(6):100095
CD19-CAR-T Cells Bearing a KIR/PD-1-Based Inhibitory CAR Eradicate CD19(+)HLA-C1(-) Malignant B Cells While Sparing CD19(+)HLA-C1(+) Healthy B Cells.
Tao L, Farooq MA, Gao Y, Zhang L, Niu C, Ajmal I, Zhou Y, He C, Zhao G, Yao J, Liu M, Jiang W
Cancers 2020 Sep 13;12(9)
Cancers 2020 Sep 13;12(9)
Single-Cell Profiling Defines Transcriptomic Signatures Specific to Tumor-Reactive versus Virus-Responsive CD4(+) T Cells.
Magen A, Nie J, Ciucci T, Tamoutounour S, Zhao Y, Mehta M, Tran B, McGavern DB, Hannenhalli S, Bosselut R
Cell reports 2019 Dec 3;29(10):3019-3032.e6
Cell reports 2019 Dec 3;29(10):3019-3032.e6
FCRL5(+) Memory B Cells Exhibit Robust Recall Responses.
Kim CC, Baccarella AM, Bayat A, Pepper M, Fontana MF
Cell reports 2019 Apr 30;27(5):1446-1460.e4
Cell reports 2019 Apr 30;27(5):1446-1460.e4
No comments: Submit comment
Supportive validation
- Submitted by
- Invitrogen Antibodies (provider)
- Main image
- Experimental details
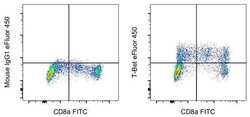
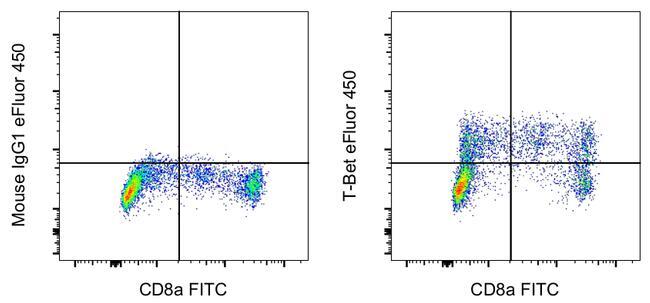
- Normal human peripheral blood cells were surface-stained with CD8a Monoclonal Antibody, FITC (Product # 11-0087-42), and then stained intracellularly using the Foxp3/Transcription Factor Staining Buffer Set (Product # 00-5523-00) and protocol with 0.25 µg of Mouse IgG1 kappa Isotype Control, eFluor 450 (Product # 48-4714-82) (left) or 0.25 µg of T-bet Monoclonal Antibody, eFluor 450 (right). Cells in the lymphocyte gate were used for analysis.

- Submitted by
- Invitrogen Antibodies (provider)
- Main image
- Experimental details
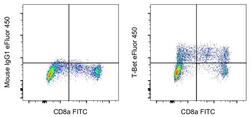
- Normal human peripheral blood cells were surface-stained with CD8a Monoclonal Antibody, FITC (Product # 11-0087-42), and then stained intracellularly using the Foxp3/Transcription Factor Staining Buffer Set (Product # 00-5523-00) and protocol with 0.25 µg of Mouse IgG1 kappa Isotype Control, eFluor 450 (Product # 48-4714-82) (left) or 0.25 µg of T-bet Monoclonal Antibody, eFluor 450 (right). Cells in the lymphocyte gate were used for analysis.
Supportive validation
- Submitted by
- Invitrogen Antibodies (provider)
- Main image

- Experimental details
- NULL
- Submitted by
- Invitrogen Antibodies (provider)
- Main image
- Experimental details
- NULL
- Submitted by
- Invitrogen Antibodies (provider)
- Main image
- Experimental details
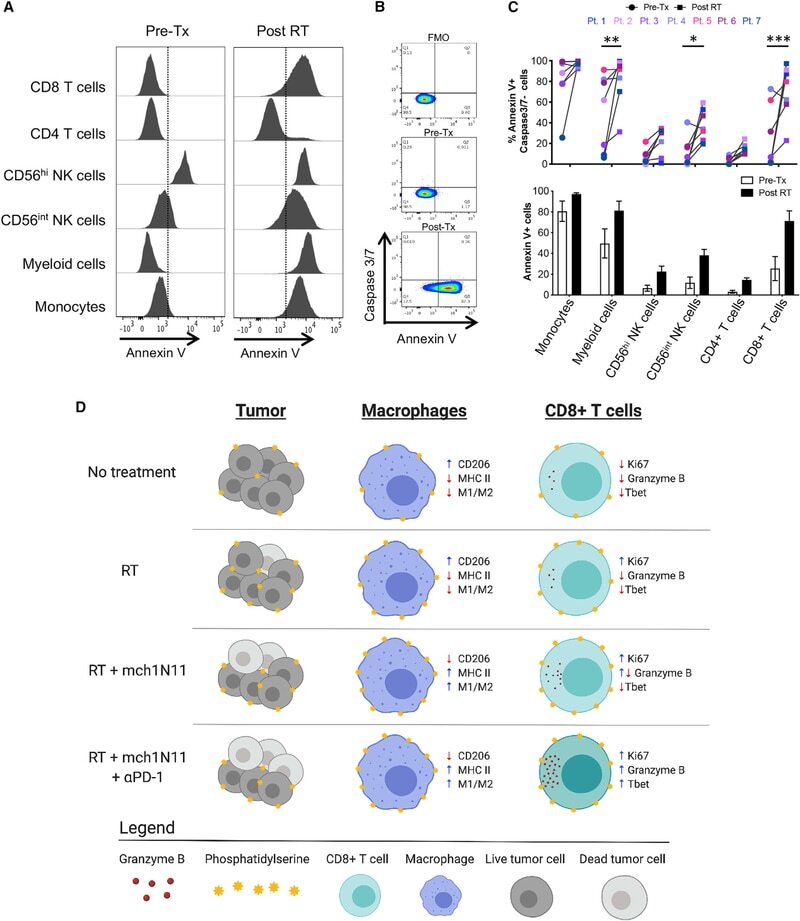
- Figure 7. Melanoma Patients Demonstrated an Overall Increase of PS Expression on Immune Subsets in the Blood 4-7 Days after RT Peripheral blood was collected from 7 melanoma patients before and 4-7 days after receiving tumor-directed RT. Freshly isolated PBMCs from each patient were stained for PS expression using annexin V on the day the blood was collected, as described in STAR Methods . (A) Histogram plots of annexin V staining of viable immune cell subsets in PBMCs from a single patient (Pt. 1) pretreatment (Tx) and post-RT. (B) Representative plots gated on live CD3+ CD8+ T cells of annexin V versus caspase-3/7 activity of PBMCs from a single patient pre-RT and 4 days post-RT. FMO, control. (C) Top: individual values for each patient. Bottom: average percentage +- SEM of annexin V+ immune cell subsets pre-RT and post-RT. *p < 0.05, ***p < 0.005. (D) Model summarizing the effects of targeting PS with RT and anti-PD-1 on immune cell activation.
- Submitted by
- Invitrogen Antibodies (provider)
- Main image
- Experimental details
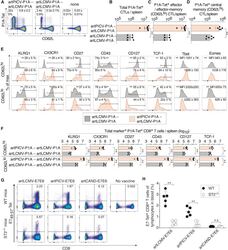
- Figure 4 Phenotype of artARENA-induced CTLs and their dependence on IL-33-ST2 alarmin signaling (A-F) We immunized BALB/c mice with artPICV-P1A and artLCMV-P1A in homologous or heterologous prime-boost vaccination i.v. on day 0 and day 27. On day 34, we analyzed P1A-Tet-binding and CD62L expression by splenic CD8 + T cells (A; gated on CD8 + B220 - lymphocytes). Unimmunized control mice are shown for comparison in (A) only. Numbers in (A) indicate the percentage of cells in the respective quadrant. Total P1A-Tet + CTLs (B), P1A-specific effector/effector memory CTLs (CD62L lo ; C), and P1A-specific central memory CTLs (CD62L hi ; D) were enumerated in the spleen on day 34. In both subsets of P1A-specific CTLs, CD62L hi and CD62L lo , we determined the surface expression of KLRG1, CX3CR1, CD27, CD43, and CD127 as well as the master transcription factors Tcf-1, Tbet, and Eomes (E). Total numbers of marker-expressing P1A-specific CTLs were enumerated in (F). (A) shows representative FACS plots from individual mice. Symbols in (B)-(D) and (F) represent individual mice, and bars in (B)-(D) and (F) indicate the mean +- SD. Numbers in (A) and (E) indicate the percentage of gated cells (mean +- SD) or the mean fluorescence intensity (MFI +- SD). Means were calculated from six mice per immunization group (A-F) or from three unimmunized controls (A). N = 2. **p < 0.01 by unpaired two-tailed Student''s t test. (G and H) We immunized ST2 -/- and WT mice with artLCMV-E7E6, artPICV-E7E6 or
- Submitted by
- Invitrogen Antibodies (provider)
- Main image
- Experimental details
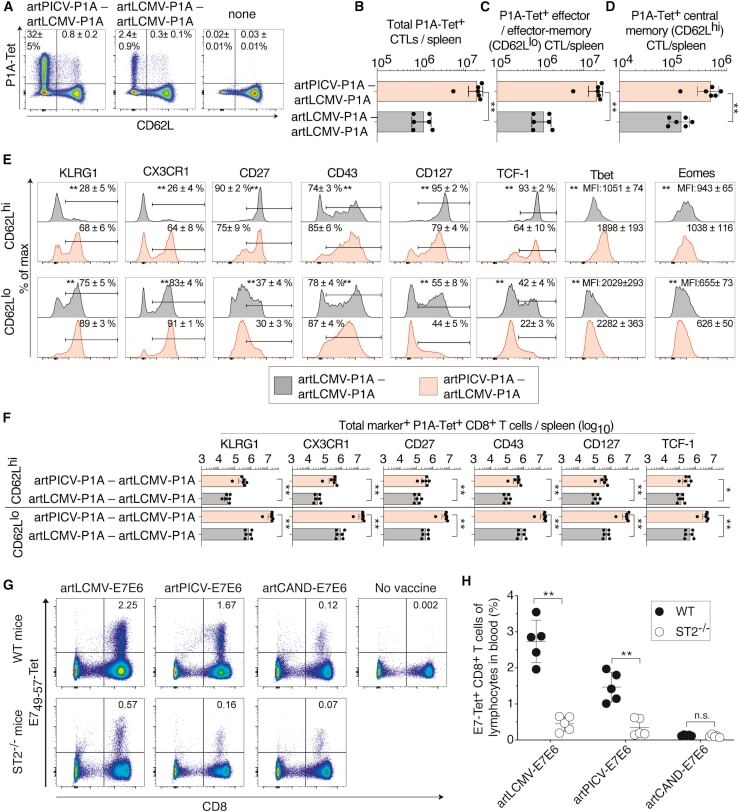
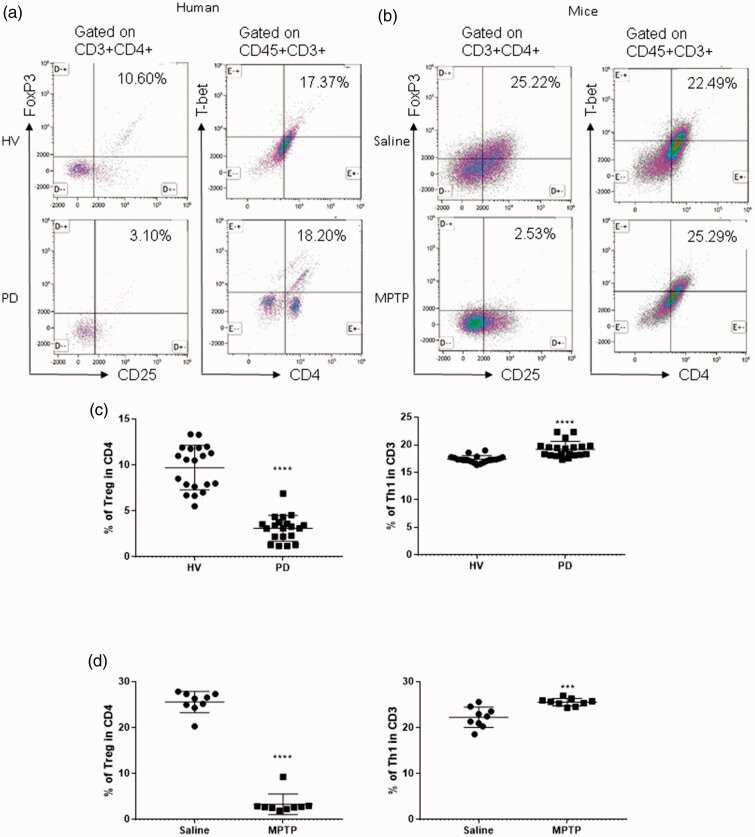
- Figure 1. Patients with Parkinson's disease (PD) and mice with experimental PD exhibit decreased regulatory T (Treg) and increased T helper 1 (Th1) cell numbers in the blood. Treg cells were defined as CD3+CD4+CD25+FoxP3+ cells, whereas Th1 cells were identified as CD3+CD4+T-bet+ cells. (a) Representative plots of Treg and Th1 cells in patients with PD and healthy volunteers (HVs). (b) Representative plots of Treg and Th1 cells in control mice (Saline) and 1-methyl-4-phenyl-1,2,3,6-tetrahydropyridine (MPTP)-treated mice. (c) Patients with PD exhibited lower Treg cell levels and greater Th1 cell levels in the blood than HVs. n = 20. ****, p < 0.0001 by a two-tailed Student's t tests. (d) MPTP-induced experimental PD mice had fewer Treg and more Th1 cells in the circulation than saline-treated mice. n = 9/group in each experiment performed in triplicate. ***, p < 0.001; ****, p < 0.0001, according to Student's t test.
- Submitted by
- Invitrogen Antibodies (provider)
- Main image
- Experimental details
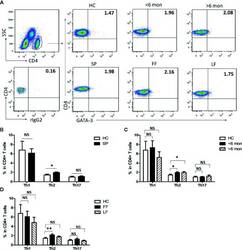
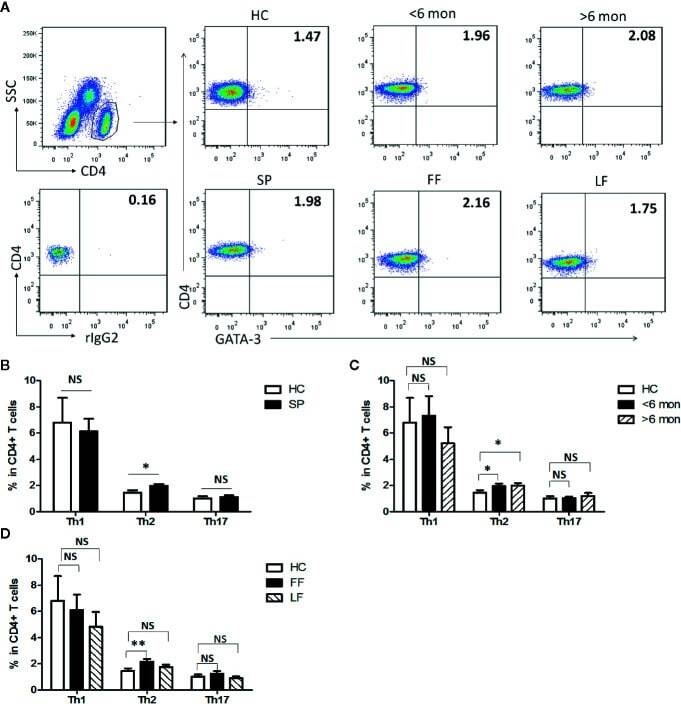
- Figure 1 Altered distribution of Th1, Th2, and Th17 in PBMCs of patients. (A) PBMCs were stained intracellularly with T-bet, GATA-3, and ROR-gammat mAbs after surface staining of CD4 mAb. According to CD4 staining and SSC, CD4 + T cells were gated. The parameters shown in quadrants of the representative graphs are mean frequency of GATA-3 for each group. (B-D) The average percentages of CD4 + T-bet + Th1, CD4 + GATA-3 + Th2, CD4 + ROR-gammat + Th17 are compared between HC (n = 24) and whole patients (n = 50) as well as subgroups of patients (SD, n = 24; LD, n = 26; FF, n = 33; LF, n = 17). Error bars represent mean+-SD. ** P < 0.01, * P < 0.05, and NS P >= 0.05.
- Submitted by
- Invitrogen Antibodies (provider)
- Main image

- Experimental details
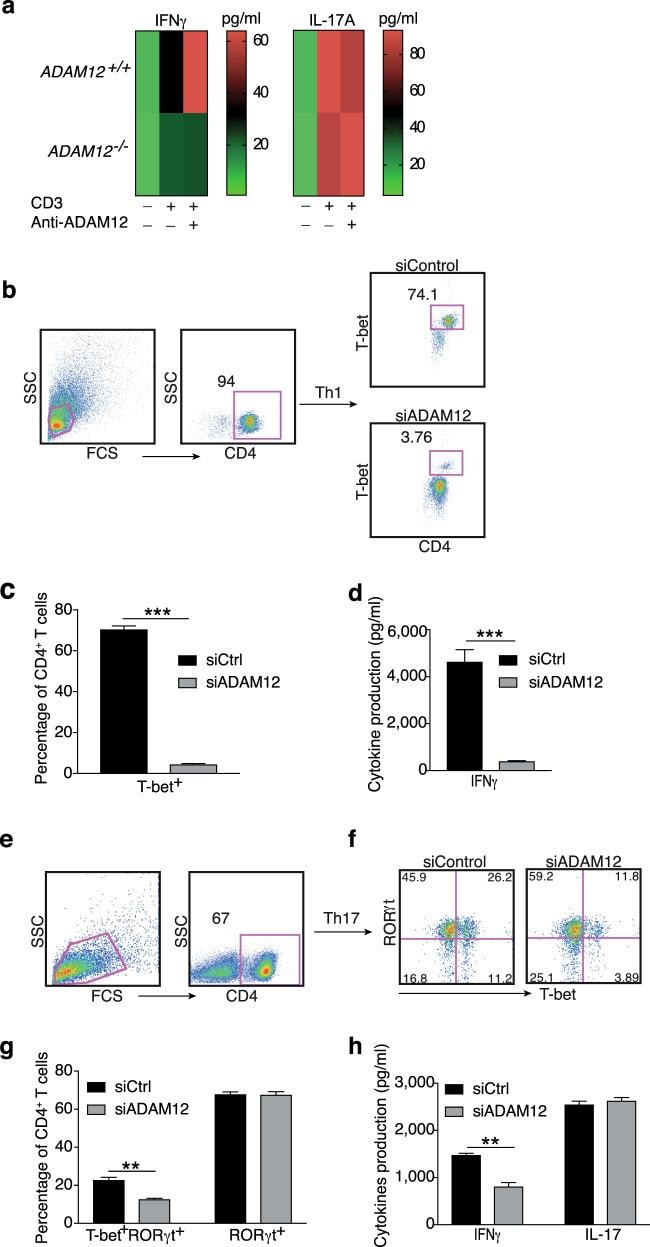
- Fig. 3 ADAM12 is essential for T-bet expression in T cells and IFNgamma production. a ADAM12 +/+ and ADAM12 -/- T cells were treated with plate-bound anti-CD3 (5 mug/ml) and anti-ADAM12 (10 mug/ml) for 3 days. Cell-culture supernatants were collected for ELISA. MOG 35-55 -specific T cells treated with MOG 35-55 (50 mug/ml), IL-12 (20 ng/ml), anti-IL-4 (10 mug/ml), and siRNAs (siControl or siADAM12) for 72 h. b FACS dot plots of the gating strategy and T-bet staining in CD4 + T cells. c Quantification of FACS results from b . d IFNgamma production in Th1 cell cultures by ELISA. Graphs in c, d are mean +- SEM from three independent experiments. *** P < 0.001 by Student's t test. Th17 cells polarized in vitro. e , f Representative FACS plots of gating strategy and T-bet- and RORgammat-stained CD4 + T cells. g Quantification of FACS results from a representative experiment--i.e., from two independent experiments. Graphs are mean +- SEM, N = 3. h IFNgamma and IL-17 production in Th17 cell cultures, by ELISA from three independent experiments. ** P < 0.01 by two-way ANOVA with post-Tukey's multiple comparisons test
- Submitted by
- Invitrogen Antibodies (provider)
- Main image
- Experimental details
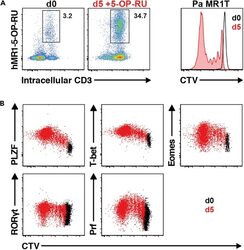
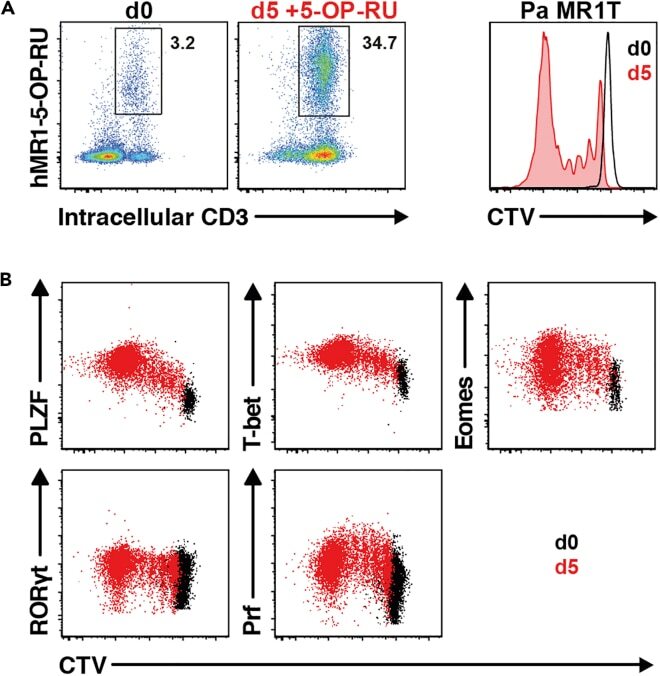
- Figure 13 Pa MR1T cell antigen-specific proliferation assay (A) Representative FACS plots showing frequencies of Pa MR1T cells (defined as CD3 + hMR1-5-OP-RU + ) and CTV dilution on day 0 and day 5 of culture with 5-OP-RU from a single Pa donor. (B) Representative FACS plots showing the expression levels of different transcription factors (PLZF, T-bet, Eomes, and RORgammat) and Perforin against CTV at the two different timepoints. Figure adapted and reprinted with permission from ().
- Submitted by
- Invitrogen Antibodies (provider)
- Main image

- Experimental details
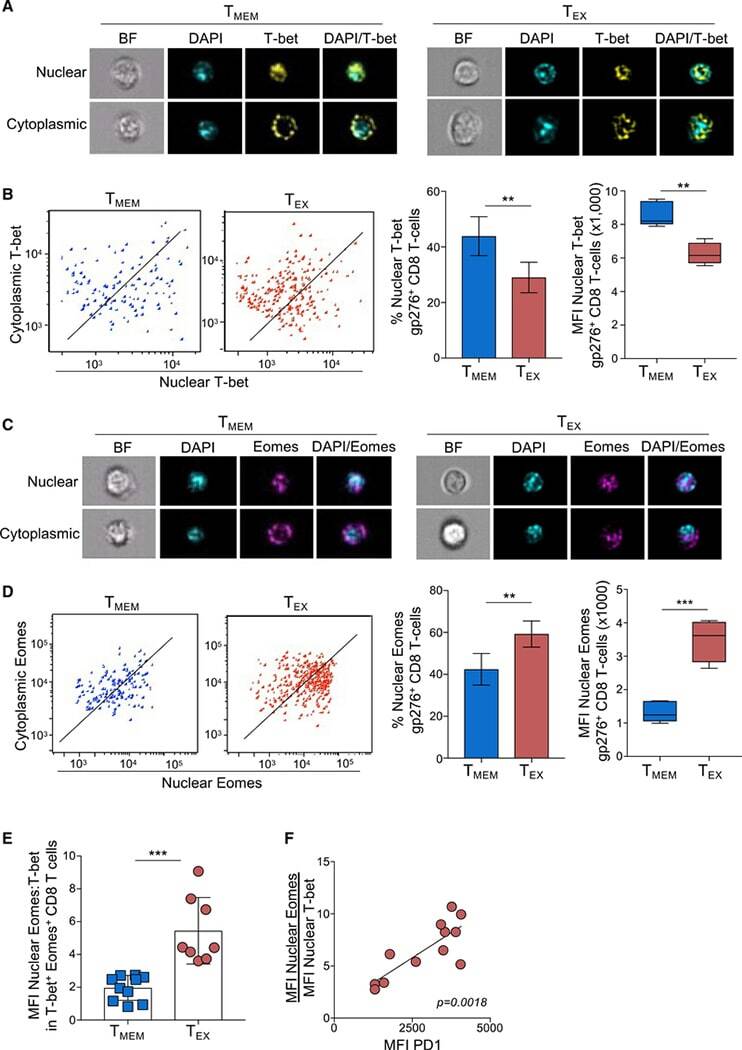
- Figure 1. Exhausted CD8 T cells have a high ratio of nuclear Eomes to T-bet that correlates with PD-1 expression during LCMV infection ImageStream analysis was performed on CD8 + T cells from Armstrong-immune (T MEM , blue)- or clone 13 (T EX , red)-infected mice at day 30 p.i. (A) Representative cell images acquired in IDEAS software from an Armstrong-immune mouse (T MEM , left) or chronic clone 13 mouse (T EX, right) are shown. Splenocytes were permeabilized and stained with T-bet (yellow). The location of the nucleus is indicated by DAPI (cyan). (B) Representative ImageStream flow plots displaying T-bet localization in T MEM s or T EX s are shown (left). Bar graphs display the frequency and median fluorescence intensity (MFI) of nuclear T-bet in LCMV-specific H-2D b gp276 + CD8 + T cells (right). (C) Representative cell images acquired in IDEAS software from an Armstrong-immune mouse (T MEM , left) or chronic clone 13 mouse (T EX , right) are shown. Splenocytes were permeabilized and stained with Eomes (magenta). The location of the nucleus is indicated by DAPI (cyan). (D) Representative ImageStream flow plots displaying Eomes localization are shown (left). Bar graphs show the frequency and MFI of nuclear Eomes in LCMV-specific H-2D b gp276 + CD8 + T cells (right). (E) The ratio of the MFI of nuclear Eomes:T-bet in LCMV-specific H-2D b gp276 + T-bet + Eomes + CD8 T cells is shown. (F) A correlation plot displaying the ratio of the MFI of nuclear Eomes:T-bet versus MFI of P
- Submitted by
- Invitrogen Antibodies (provider)
- Main image
- Experimental details
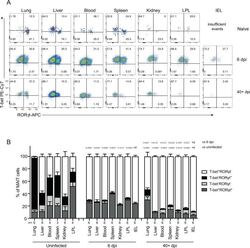
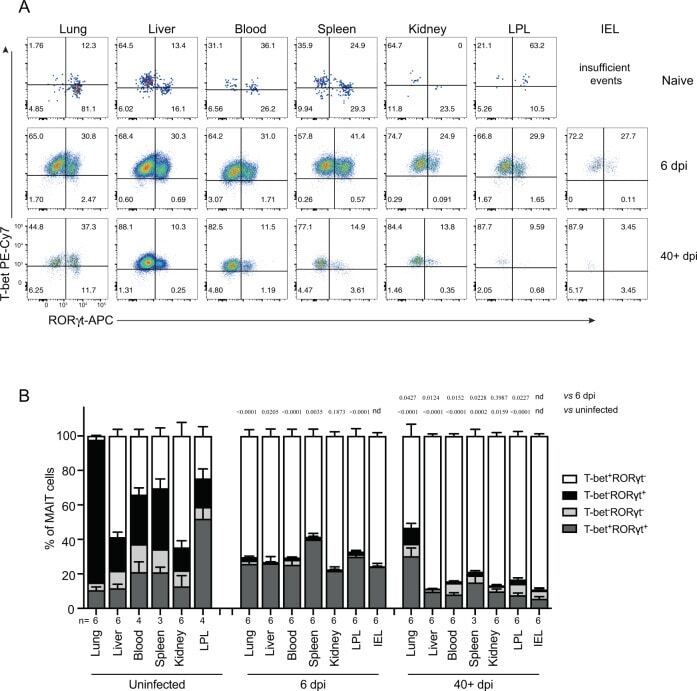
- Fig. 4 MAIT cells were polarized to functional MAIT-1 phenotype upon F. tularensis infection. A Representative flow cytometry plots showing intranuclear staining for T-bet (representing Th1) and RORgammat (Th17) in gated MAIT cells from the liver, lungs, spleen, kidneys, LPL, IEL, and blood of naive and infected mice on 6 and 40+ dpi (41 and 68 dpi in two experiments) with 10 4 CFU F. tularensis LVS i.v. Numbers in quadrants represent cell percentage. It is noteworthy that IEL from naive mice yielded insufficient numbers of MAIT cells for accurate assessment of transcription factor expression and, thus, were omitted from our analysis. B Percentage of MAIT cells expressing combinations of T-bet and RORgammat from the same mice in A . Pooled data from two independent experiments (mean +- SEM, n = 3-6 mice per group, as indicated). One-way ANOVA with Tukey's multiple comparisons test was performed on MAIT-1% in each organ (except for IEL) between time points as indicated; p -values are indicated, nd; not determined. Source data are provided as a Source Data file.
- Submitted by
- Invitrogen Antibodies (provider)
- Main image
- Experimental details
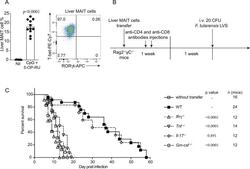
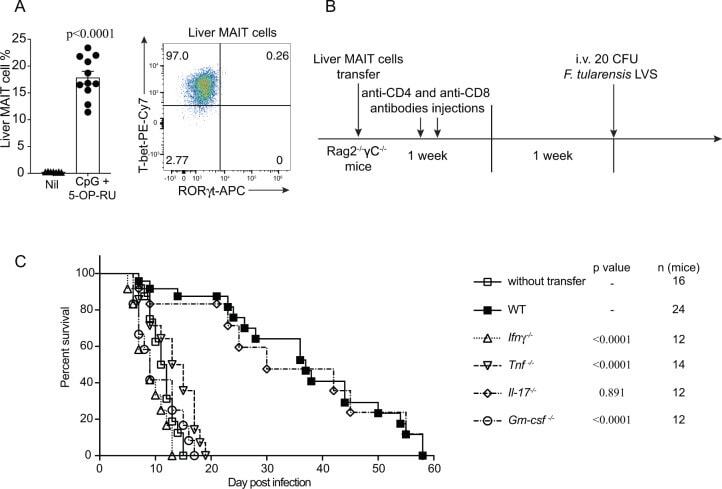
- Fig. 7 MAIT cell-mediated protection in immune-compromised mice requires IFNgamma, TNF, and GM-CSF. A MAIT cell percentage of alphabeta-T cells in the liver and representative FACS plot showing intranuclear staining for T-bet and RORgammat of MAIT cells from donor C57BL/6 mice vaccinated with CpG and 5-OP-RU i.v. for 7 days, prior cell sorting for adoptive cell transfer. Pooled data from 7 (nil) or 11 (vaccinated) mice from 3 independent experiments (mean +- SEM). Unpaired t -test (two-tailed). P < 0.0001. B Schematic of protocol for MAIT cell adoptive transfer and F. tularensis LVS challenge: 10 5 liver MAIT cells from C57BL/6 (WT, shown in A ), Ifngamma -/- , Tnf -/- , Gm-csf -/- , or Il-17 -/- mice vaccinated with CpG (10 nmol) and 5-OP-RU (2 nmol) i.v. for 7 days were sorted by flow cytometry and transferred i.v. into Rag2 -/- gammaC -/- mice. The mice were treated with anti-CD4 and anti-CD8 mAb injection (i.p., 0.1 mg each) at days 1 and 3 post MAIT cell transfer, to deplete contaminating conventional T cells. After 2 weeks, mice were infected with an otherwise lethal dose (20 CFU) of F. tularensis LVS i.v. C Survival of untreated Rag2 -/- gammaC -/- mice or Rag2 -/- gammaC -/- mice following transfer of MAIT cells from WT, Ifngamma -/- , Tnf -/- , Gm-csf -/- , or Il-17 -/- mice according to schematic shown in B . Pooled data from two independent experiments with similar results ( n = 12-24 mice per group, as indicated). Log-rank tests ( Ifngamma -/- , Tnf -/- , Gm-csf -
- Submitted by
- Invitrogen Antibodies (provider)
- Main image

- Experimental details
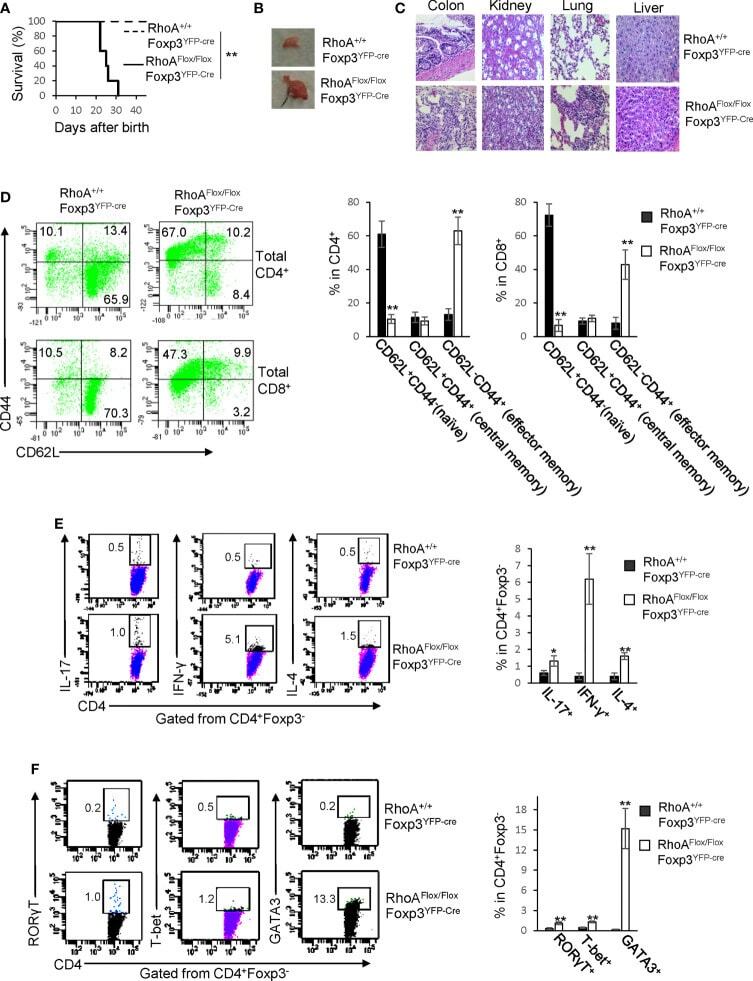
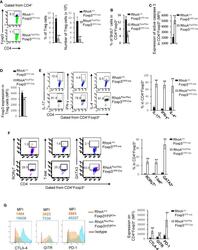
- Figure 1 Homozygous RhoA deletion in Treg cells leads to early, fatal spontaneous inflammatory disorders. (A) Survival outcome of RhoA +/+ Foxp3 YFP-Cre and RhoA Flox/Flox Foxp3 YFP-Cre mice. Results were analyzed with a log-rank (Mantel-Cox) test and expressed as Kaplan-Meier survival curves. (B) Image of lymphadenopathy in RhoA Flox/Flox Foxp3 YFP-Cre mice. Inguinal lymph nodes are shown. (C) Images of H&E staining of the indicated organs from RhoA +/+ Foxp3 YFP-Cre and RhoA Flox/Flox Foxp3 YFP-Cre mice (original magnification X 400). (D) Left, representative flow cytogram of CD44 and CD62L staining in CD4 + and CD8 + cells from the spleen of RhoA +/+ Foxp3 YFP-Cre and RhoA Flox/Flox Foxp3 YFP-Cre mice. The numbers indicate percentages of CD44 + , CD44 + CD62L + , and CD62L + cells. Right, average percentages of CD44 + , CD44 + CD62L + , and CD62L + cells. (E) Left, representative flow cytogram of IL-17, IFN-gamma, and IL-4 staining in CD4 + Foxp3 - cells from the spleen of RhoA +/+ Foxp3 YFP-Cre and RhoA Flox/Flox Foxp3 YFP-Cre mice. The numbers indicate percentages of IL-17 + , IFN-gamma + , and IL-4 + cells. Right, average percentages of IL-17 + , IFN-gamma + , and IL-4 + cells. (F) Left, representative flow cytogram of RORgammaT, T-bet and GATA3 staining in CD4 + Foxp3 - cells from the spleen of RhoA +/+ Foxp3 YFP-Cre and RhoA Flox/Flox Foxp3 YFP-Cre mice. The numbers indicate percentages of RORgammaT + , T-bet + , and GATA3 + cells. Right, average percentages of RORgam
- Submitted by
- Invitrogen Antibodies (provider)
- Main image
- Experimental details
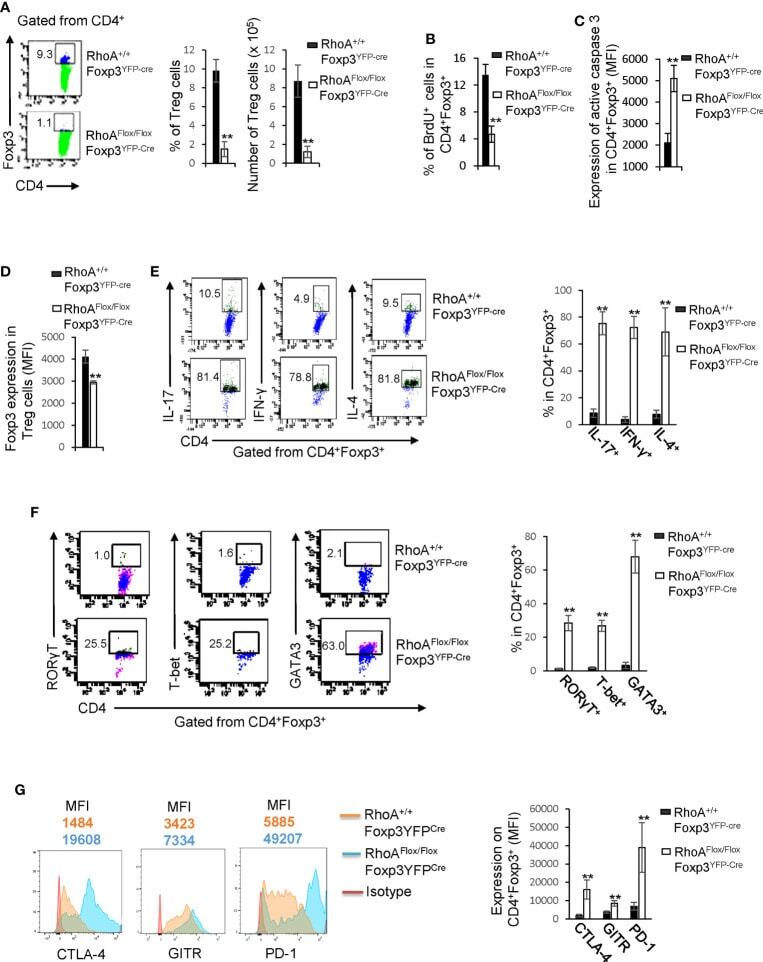
- Figure 2 Homozygous RhoA deletion in Treg cells dampens Treg cell homeostasis and induces Treg cell plasticity. (A) Left, representative flow cytogram of Foxp3 staining in CD4 + cells from the spleen of RhoA +/+ Foxp3 YFP-Cre and RhoA Flox/Flox Foxp3 YFP-Cre mice. The numbers indicate percentages of CD4 + Foxp3 + Treg cells. Middle, average percentages of CD4 + Foxp3 + Treg cells. Right, average numbers of CD4 + Foxp3 + Treg cells. (B) Treg cell proliferation. Percentages of CD4 + Foxp3 + Treg cells incorporated with BrdU are shown. (C) Treg cell apoptosis. The expression levels (MFI: Mean fluorescence intensity) of active caspase 3 in CD4 + Foxp3 + Treg cells are shown. (D) The expression levels of Foxp3 in Treg cells. (E) Left, representative flow cytogram of IL-17, IFN-gamma, and IL-4 staining in CD4 + Foxp3 + Treg cells. The numbers indicate percentages of IL-17 + , IFN-gamma + , and IL-4 + Treg cells. Right, average percentages of IL-17 + , IFN-gamma + , and IL-4 + Treg cells. (F) Left, representative flow cytogram of RORgammaT, T-bet and GATA3 staining in CD4 + Foxp3 + Treg cells. The numbers indicate percentages of RORgammaT + , T-bet + , and GATA3 + Treg cells. Right, average percentages of RORgammaT + , T-bet + , and GATA3 + Treg cells. (G) Left, representative histogram of the expression levels of CTLA-4, GITR and PD-1 in CD4 + Foxp3 + Treg cells. The numbers above the graphs indicate MFI. Right, average MFI of CTLA-4, GITR and PD-1 in CD4 + Foxp3 + Treg cells. n =
- Submitted by
- Invitrogen Antibodies (provider)
- Main image
- Experimental details
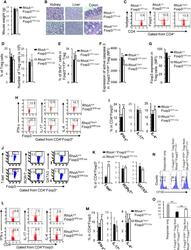
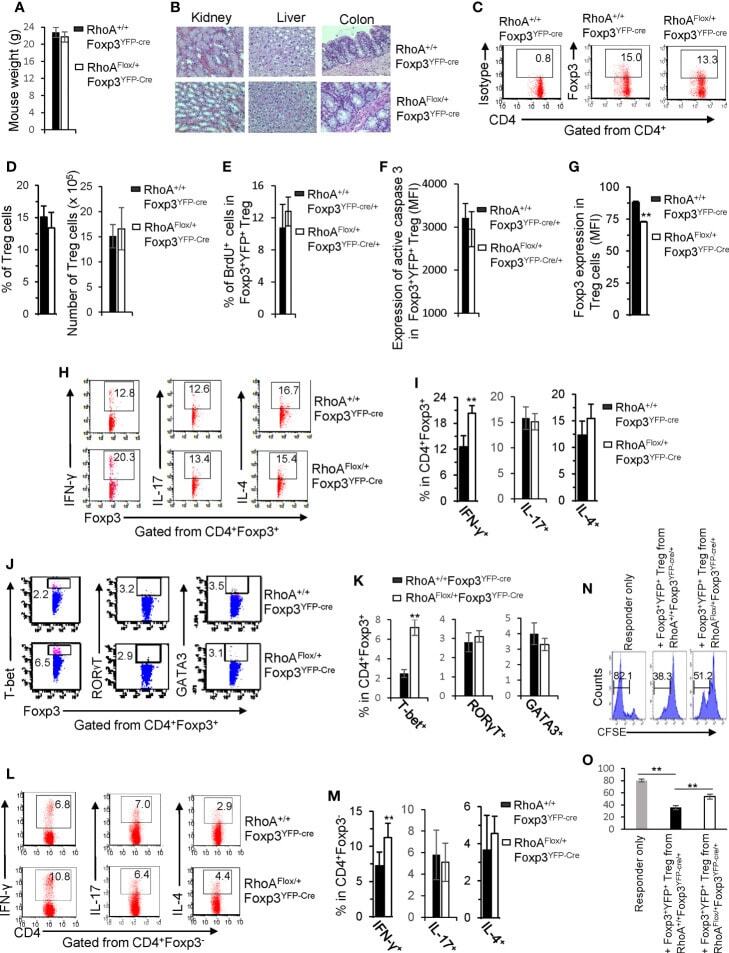
- Figure 5 Heterozygous RhoA deletion in Treg cells induces Treg cell plasticity and increases CD4 + effector T cells but does not result in autoimmunity. (A) Body weight of RhoA +/+ Foxp3 YFP-Cre and RhoA Flox/+ Foxp3 YFP-Cre mice. (B) Images of H&E staining of the indicated organs. (C) Representative flow cytogram of Foxp3 staining in CD4 + cells from the spleen of RhoA +/+ Foxp3 YFP-Cre and RhoA Flox/+ Foxp3 YFP-Cre mice. The numbers indicate percentages of CD4 + Foxp3 + Treg cells. (D) Left, average percentages of CD4 + Foxp3 + Treg cells. Right, cell numbers of CD4 + Foxp3 + Treg cells. (E) Proliferation of Foxp3 + YFP + Treg cells from RhoA +/+ Foxp3 YFP-Cre/+ and RhoA Flox/+ Foxp3 YFP-Cre/+ female mice. Percentages of Foxp3 + YFP + Treg cells incorporated with BrdU are shown. (F) Apoptosis of Foxp3 + YFP + Treg cells from RhoA +/+ Foxp3 YFP-Cre/+ and RhoA Flox/+ Foxp3 YFP-Cre/+ female mice. The expression levels (MFI: mean fluorescence intensity) of active caspase 3 in Foxp3 + YFP + Treg cells are shown. (G) The expression levels of Foxp3 in Treg cells from RhoA +/+ Foxp3 YFP-Cre and RhoA Flox/+ Foxp3 YFP-Cre mice. (H) Representative flow cytogram of IFN-gamma, IL-17 and IL-4 staining in CD4 + Foxp3 + Treg cells. The numbers indicate percentages of IFN-gamma + , IL-17 + and IL-4 + Treg cells. (I) Average percentages of IFN-gamma + , IL-17 + and IL-4 + Treg cells. (J) Representative flow cytogram of RORgammaT, T-bet and GATA3 staining in CD4 + Foxp3 + Treg cells. The numb
- Submitted by
- Invitrogen Antibodies (provider)
- Main image
- Experimental details
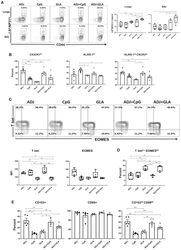
- Figure 2 Effector CD4 T Cell Response to Adjuvanted Vaccines Groups of C57BL/6 mice were vaccinated IN, as in Figure 1 . At day 8 PV, cells from lungs and BAL were stained with I-A b /NP311 tetramers along with antibodies to cell surface molecules and transcription factors. (A) FACS plots show the percentages of I-A b /NP311 tetramer-binding cells among CD4 T cells. (B) Percentages of the indicated cell population among NP311-specific, tetramer-binding CD4 T cells. (C) FACS plots are gated on I-A b /NP311 tetramer-binding cells, and the numbers in each quadrant are the percentages of cells among the gated population; MFIs for transcription factors in NP311-specific CD4 T cells are plotted in the adjoining graphs. (D) FACS plots in (C) were used to quantify the percentages of T-bet LO EOMES HI cells (quadrant 4) among NP311-specific CD4 T cells. (E) Percentages of CD103 HI and CD69 HI cells among NP311-specific CD4 T cells. Data are representative of two independent experiments. Comparisons were made using one-way ANOVA test with Tukey-corrected multiple comparisons; *p < 0.05, **p < 0.01, and ***p < 0.001.

- Submitted by
- Invitrogen Antibodies (provider)
- Main image
- Experimental details
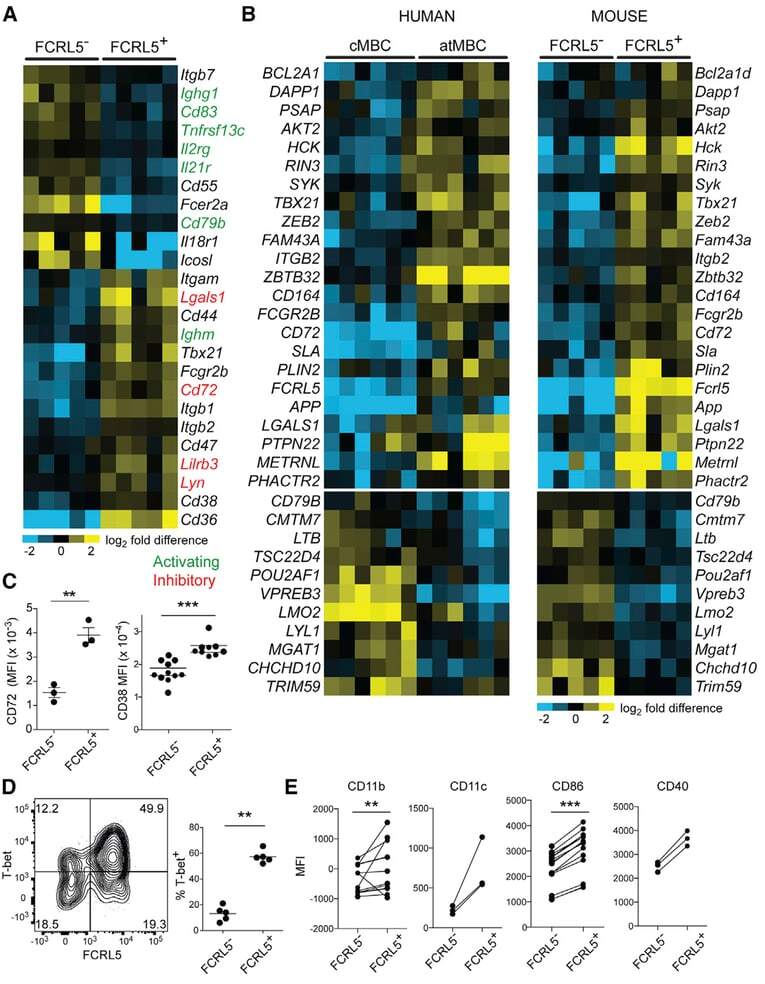
- Figure 2. Similarities between Infection-Induced Mouse FCRL5 + B Cells and atMBCs from Plasmodium -Infected Humans (A) RNA-seq was performed on class-switched (IgM - IgD - ), FCRL5 - or FCRL5 + B cells sorted from the blood of Ifngr1 - / - mice infected for 21 days with P. chabaudi . Columns represent individual mice (n = 5). Select genes involved in immune signaling are shown. Genes with putative activating function are labeled in green; those with putative inhibitory function are labeled in red. (B) Heatmaps depict all genes that are differentially regulated in both human atMBCs (left) and mouse FCRL5 + B cells, relative to cMBCs and FCRL5 - B cells, respectively. Human data are from . (C-E) Expression of (C) CD72 and CD38, (D) T-bet, and (E) CD11b, CD11c, CD86, and CD40 were measured by flow cytometry in blood B cells 21 d.p.i. **p < 0.01; ***p < 0.001 by paired t test (Wilcoxon rank-sum test). See also Figure S2 and Tables S1 and S2 .
- Submitted by
- Invitrogen Antibodies (provider)
- Main image

- Experimental details
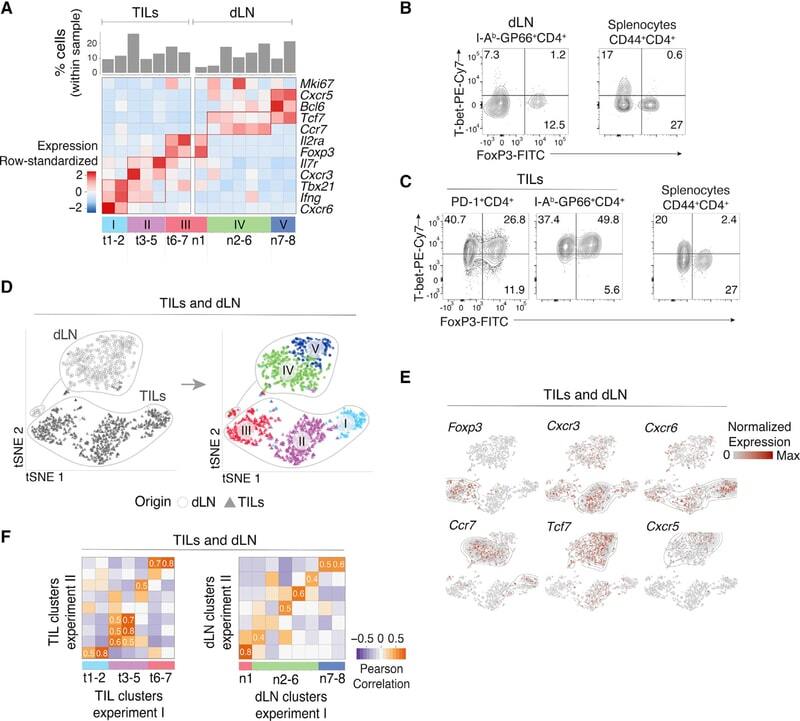
- Figure 1. Characterization of CD4 + TIL, dLN, and Arm Transcriptomes by scRNA-Seq (A-D) TILs and dLN cells from wild-type (WT) mice at day 14 after MC38-GP injection analyzed by scRNA-seq and flow cytometry. (A) Heatmap shows row-standardized expression of selected genes across TIL and dLN clusters. Bar plot indicates the percentage of cells in each cluster relative to the total TIL or dLN cell number. (B) Flow cytometry contour plots of Foxp3 versus T-bet in CD44 hi GP66 + dLN cells (left) and in CD44 hi CD4 + splenocytes from tumor-free control mice (right). (C) Flow cytometry contour plots of Foxp3 versus T-bet in PD-1 + and GP66 + TILs (left) and in CD44 hi CD4 + splenocytes from tumor-free control mice (right). (B and C) Data representative from 18 tumor-bearing mice analyzed in four separate experiments. (D) t-SNE display of TILs and dLN cells, shaded gray by tissue origin (left) or color coded by main group (right, as defined in A). (E) t-SNE (TIL and dLN cell positioning as shown in B) display of normalized expression levels of selected genes. (F) Heatmap shows Pearson correlation between cluster fold change vectors (as defined in the text) across the two replicate experiments for TILs (left) and dLN cells (right). See also Figures S1 and S2 and Tables S1 and S6 .
- Submitted by
- Invitrogen Antibodies (provider)
- Main image
- Experimental details
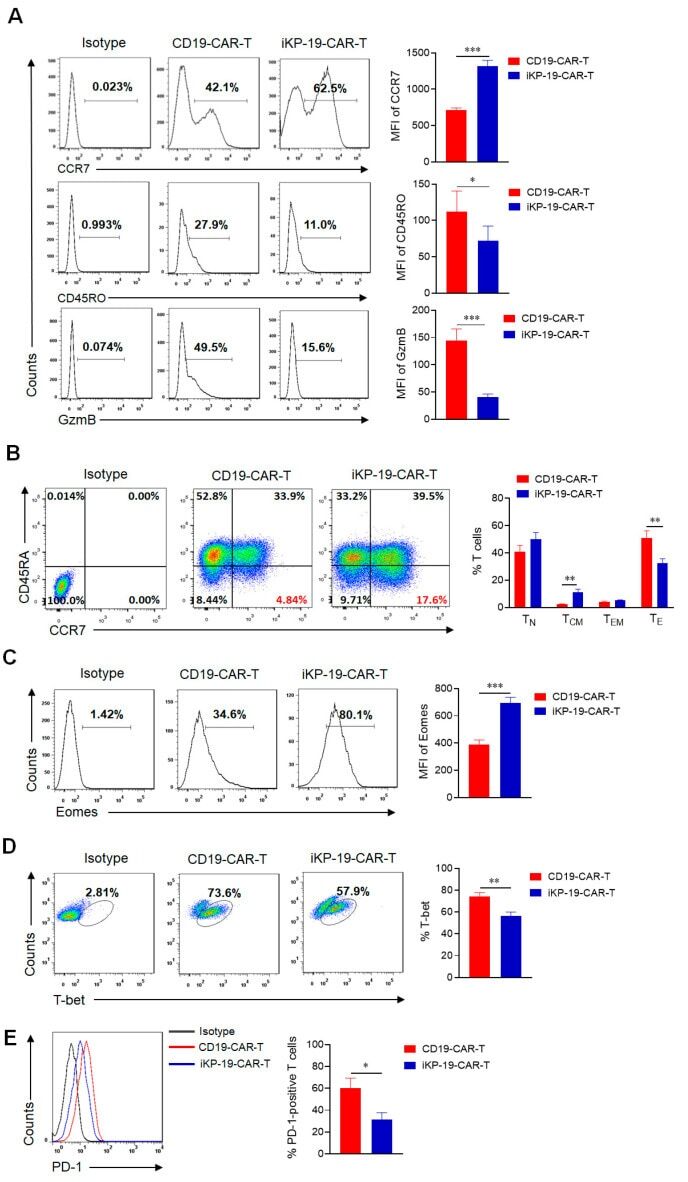
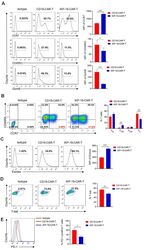
- Figure 3 Characteristics of iKP-19-CAR-T cells and CD19-CAR-T cells. iKP-19-CAR-T cells or CD19-CAR-T cells were cultured for 10 days in X-VIVO media supplemented with 100 U/mL IL-2. ( A ) The expression of T cell differentiation markers in CAR-T cells was analyzed by flow cytometry using PE/Cy7-anti-human CCR7 antibody, PE-anti-human-CD45RO antibody and PE-anti-human GzmB antibody ( n = 4 different donors). ( B ) The frequency of naive (T N ; CCR7 + CD45RA + ), T CM (CCR7 + CD45RA - ), effector memory (T EM ; CCR7 - CD45RA - ) or effector (T E ; CCR7 - CD45RA + ) T cells were analyzed by flow cytometry using PE/Cy7-anti-human CCR7 antibody and FITC-anti-human CD45RA antibody ( n = 4 different donors). ( C ) The expression of transcription factor Eomes in CAR-T cells was analyzed by flow cytometry using FITC-anti-human Eomes antibody ( n = 4 different donors). ( D ) The expression of transcription factor T-bet in CAR-T cells was analyzed by flow cytometry using PE-anti-human T-bet antibody ( n = 4 different donors). ( E ) The expression of T cell exhaustion marker PD-1 in CAR-T cells was analyzed by flow cytometry using FITC-anti-human PD-1 antibody ( n = 4 different donors). All experiments were performed in triplicate manner using PBMCs from each donor and MFI or percentage was statistically analyzed. * p < 0.05, ** p < 0.01, *** p < 0.001. Error bars represent +- SD.