Explore
 Validate
 Learn
Learn Western blot
 Immunocytochemistry
Antibody data
- Antibody Data
- Antigen structure
- References [4]
- Comments [0]
- Validations
- Immunocytochemistry [4]
- Immunohistochemistry [2]
- Other assay [4]
Submit
Validation data
Reference
Comment
Report error
- Product number
- PA5-29899 - Provider product page

- Provider
- Invitrogen Antibodies
- Product name
- V-ATPase E1 Polyclonal Antibody
- Antibody type
- Polyclonal
- Antigen
- Recombinant full-length protein
- Description
- Recommended positive controls: A549, H1299, HCT116, mouse brain, rat brain. Predicted reactivity: Mouse (99%), Rat (98%), Xenopus laevis (82%), Chicken (87%), Bovine (98%). Store product as a concentrated solution. Centrifuge briefly prior to opening the vial.
- Reactivity
- Human, Mouse, Rat
- Host
- Rabbit
- Isotype
- IgG
- Vial size
- 100 μL
- Concentration
- 1.41 mg/mL
- Storage
- Store at 4°C short term. For long term storage, store at -20°C, avoiding freeze/thaw cycles.
Submitted references Docosahexaenoic acid inhibits zymogen activation by suppressing vacuolar ATPase activation in cerulein-stimulated pancreatic acinar cells.
Macrophages use a bet-hedging strategy for antimicrobial activity in phagolysosomal acidification.
Paraoxonase 3 functions as a chaperone to decrease functional expression of the epithelial sodium channel.
H(+)-ATPase B1 subunit localizes to thick ascending limb and distal convoluted tubule of rodent and human kidney.
Park Y, Ku L, Lim JW, Kim H
Genes & nutrition 2020 Mar 23;15(1):6
Genes & nutrition 2020 Mar 23;15(1):6
Macrophages use a bet-hedging strategy for antimicrobial activity in phagolysosomal acidification.
Dragotakes Q, Stouffer KM, Fu MS, Sella Y, Youn C, Yoon OI, De Leon-Rodriguez CM, Freij JB, Bergman A, Casadevall A
The Journal of clinical investigation 2020 Jul 1;130(7):3805-3819
The Journal of clinical investigation 2020 Jul 1;130(7):3805-3819
Paraoxonase 3 functions as a chaperone to decrease functional expression of the epithelial sodium channel.
Shi S, Montalbetti N, Wang X, Rush BM, Marciszyn AL, Baty CJ, Tan RJ, Carattino MD, Kleyman TR
The Journal of biological chemistry 2020 Apr 10;295(15):4950-4962
The Journal of biological chemistry 2020 Apr 10;295(15):4950-4962
H(+)-ATPase B1 subunit localizes to thick ascending limb and distal convoluted tubule of rodent and human kidney.
Frische S, Chambrey R, Trepiccione F, Zamani R, Marcussen N, Alexander RT, Skjødt K, Svenningsen P, Dimke H
American journal of physiology. Renal physiology 2018 Sep 1;315(3):F429-F444
American journal of physiology. Renal physiology 2018 Sep 1;315(3):F429-F444
No comments: Submit comment
Supportive validation
- Submitted by
- Invitrogen Antibodies (provider)
- Main image

- Experimental details
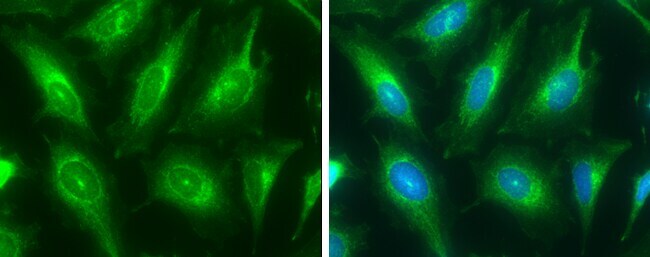
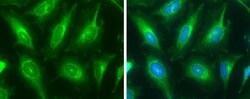
- Immunocytochemistry-Immunofluorescence analysis of V-ATPase-E1 was performed in HeLa cells fixed in ice-cold MeOH for 5 min. Green: V-ATPase E1 Polyclonal Antibody (Product # PA5-29899) diluted at 1:200. Blue: Hoechst 33342 staining.
- Submitted by
- Invitrogen Antibodies (provider)
- Main image
- Experimental details
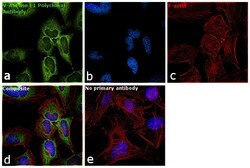
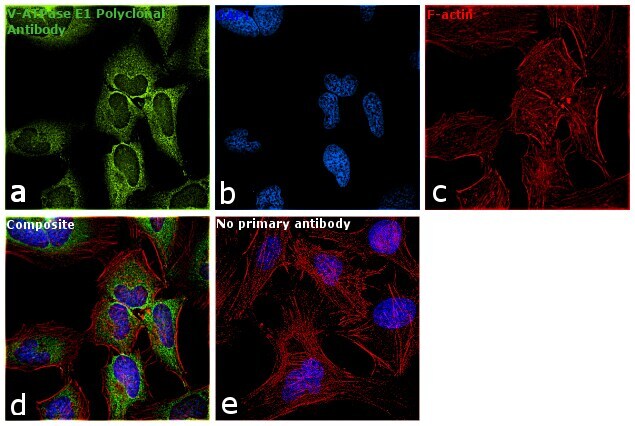
- Immunofluorescence analysis of V-ATPase E1 was performed using 70% confluent log phase HeLa cells. The cells were fixed with 4% paraformaldehyde for 10 minutes, permeabilized with 0.1% Triton™ X-100 for 15 minutes, and blocked with 1% BSA for 1 hour at room temperature. The cells were labeled with anti-V-ATPase E1 Rabbit Polyclonal Antibody (Product # PA5-29899) at 1:200 dilution in 0.1% BSA, incubated at 4 degree Celsius overnight and then labeled with Goat anti-Rabbit IgG (H+L) Superclonal™ Secondary Antibody, Alexa Fluor® 488 conjugate (Product # A27034) at a dilution of 1:2000 for 45 minutes at room temperature (Panel a: green). Nuclei (Panel b: blue) were stained with ProLong™ Diamond Antifade Mountant with DAPI (Product # P36962). F-actin (Panel c: red) was stained with Rhodamine Phalloidin (Product # R415, 1:300). Panel d represents the merged image showing predominantly Cytosolic localization. Panel e represents control cells with no primary antibody to assess background. The images were captured at 60X magnification.
- Submitted by
- Invitrogen Antibodies (provider)
- Main image
- Experimental details
- Immunocytochemistry-Immunofluorescence analysis of V-ATPase-E1 was performed in HeLa cells fixed in ice-cold MeOH for 5 min. Green: V-ATPase E1 Polyclonal Antibody (Product # PA5-29899) diluted at 1:200. Blue: Hoechst 33342 staining.

- Submitted by
- Invitrogen Antibodies (provider)
- Main image

- Experimental details
- Immunofluorescence analysis of V-ATPase E1 was performed using 70% confluent log phase HeLa cells. The cells were fixed with 4% paraformaldehyde for 10 minutes, permeabilized with 0.1% Triton™ X-100 for 15 minutes, and blocked with 1% BSA for 1 hour at room temperature. The cells were labeled with anti-V-ATPase E1 Rabbit Polyclonal Antibody (Product # PA5-29899) at 1:200 dilution in 0.1% BSA, incubated at 4 degree Celsius overnight and then labeled with Goat anti-Rabbit IgG (Heavy Chain) Superclonal™ Secondary Antibody, Alexa Fluor® 488 conjugate (Product # A27034) at a dilution of 1:2000 for 45 minutes at room temperature (Panel a: green). Nuclei (Panel b: blue) were stained with ProLong™ Diamond Antifade Mountant with DAPI (Product # P36962). F-actin (Panel c: red) was stained with Rhodamine Phalloidin (Product # R415, 1:300). Panel d represents the merged image showing predominantly Cytosolic localization. Panel e represents control cells with no primary antibody to assess background. The images were captured at 60X magnification.

Supportive validation
- Submitted by
- Invitrogen Antibodies (provider)
- Main image
- Experimental details
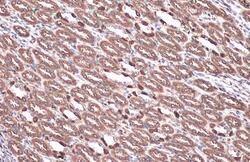
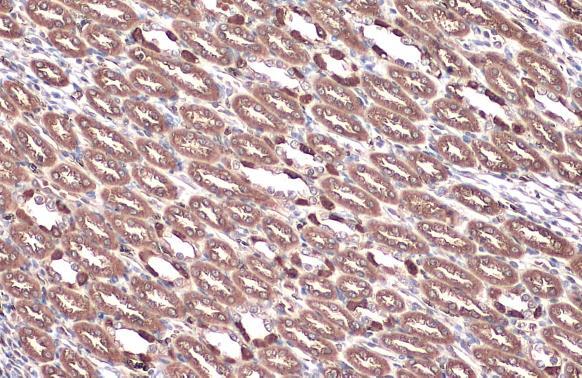
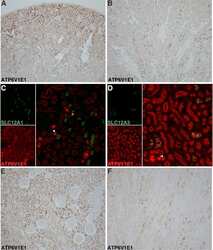
- V-ATPase E1 Polyclonal Antibody detects ATP6V1E1 protein at cell membrane and cytoplasm by immunohistochemical analysis. Sample: Paraffin-embedded mouse kidney. ATP6V1E1 stained by V-ATPase E1 Polyclonal Antibody (Product # PA5-29899) diluted at 1:500. Antigen Retrieval: Citrate buffer, pH 6.0, 15 min.
- Submitted by
- Invitrogen Antibodies (provider)
- Main image
- Experimental details
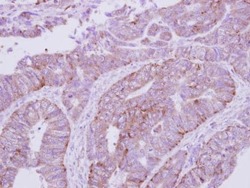
- Immunohistochemical analysis of paraffin-embedded human colon carcinoma, using ATP6V1E1 (Product # PA5-29899) antibody at 1:250 dilution. Antigen Retrieval: EDTA based buffer, pH 8.0, 15 min.

Supportive validation
- Submitted by
- Invitrogen Antibodies (provider)
- Main image
- Experimental details
- NULL

- Submitted by
- Invitrogen Antibodies (provider)
- Main image
- Experimental details
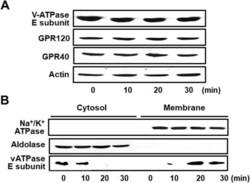
- Fig. 1 Cerulein-induced translocation of the E subunit of vATPase to the membrane. Cells were stimulated with cerulein (10 -8 M) for the indicated time periods. a Levels of GPR120, GPR40, and vATPase E subunit in total cell extracts were determined by western blot analysis. Actin was used as a loading control. b Levels of vATPase E subunit in cytosolic and membrane fractions were determined by western blot analysis. Aldolase A and Na + /K + -ATPase were used as markers of cytosolic and membrane fractions, respectively

- Submitted by
- Invitrogen Antibodies (provider)
- Main image

- Experimental details
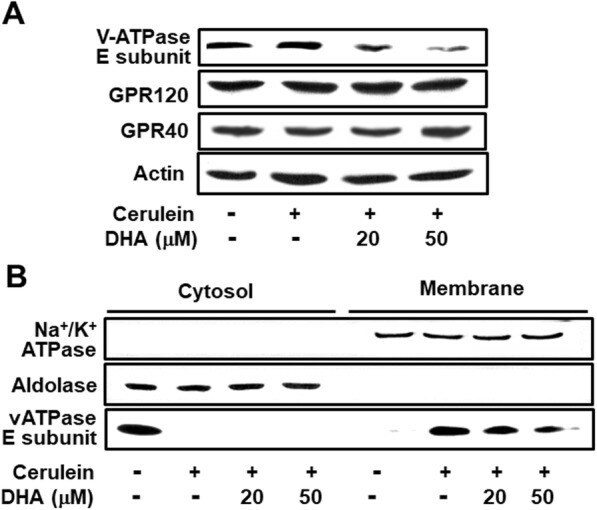
- Fig. 2 DHA decreased the activation of vATPase in cerulein-stimulated AR42J cells. Cells were pretreated with the indicated concentrations of DHA for 2 h and were then stimulated with cerulein (10 -8 M) for 30 min. a Levels of GPR120 and GPR40 and the vATPase E subunit in total cell extracts were determined by western blot analysis. Actin was used as a loading control. b Levels of the vATPase E subunit in cytosolic and membrane fractions were determined by western blot analysis. Aldolase A and Na + /K + -ATPase were used as markers of cytosolic and membrane fractions, respectively
- Submitted by
- Invitrogen Antibodies (provider)
- Main image
- Experimental details
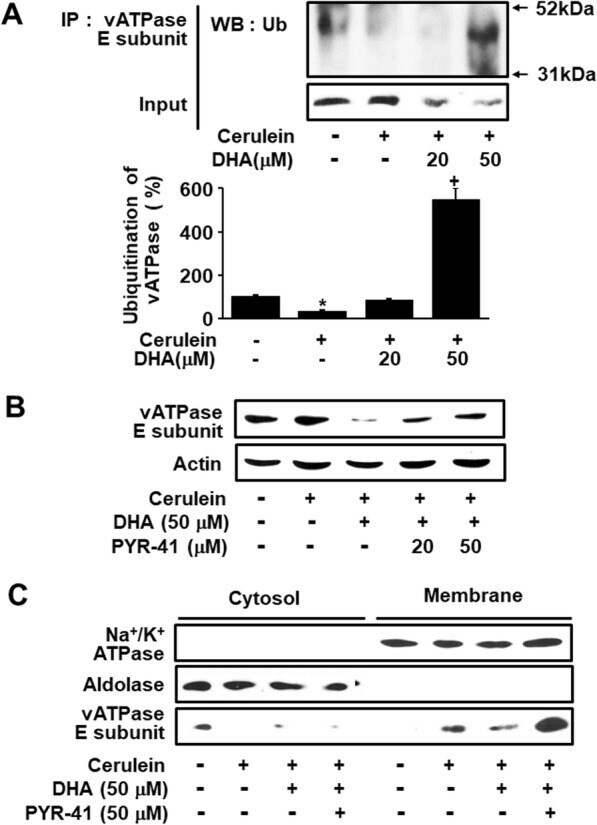
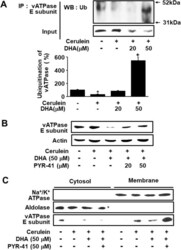
- Fig. 6 DHA decreased the levels of vATPase via ubiquitination in AR42J cells. a Cells were pretreated with the indicated concentrations of DHA for 2 h and were then stimulated with cerulein (10 -8 M) for 30 min. Total cell extracts were prepared and subjected to immunoprecipitation (IP) analysis with anti-vATPase E subunit antibody, followed by western blotting (WB) with an anti-ubiquitin (Ub) antibody. Input was used as a control for protein expression determined by western blotting. The upper lane shows total cell extracts subjected to IP with an anti-vATPase E subunit antibody, followed by WB with an anti-ubiquitin antibody. The lower lane shows the amount of input vATPase E subunit determined with western blot analysis (upper panel). The level of the band densities corresponding to ubiquitinated vATPase E subunit to that of its input control was calculated. The band density level of ""None"" was set as 100%. Values are expressed as the mean +- S.E. of three/each group. * p < 0.05 vs. cells without any stimulation or treatment, + p < 0.05 vs. cells with cerulein stimulation alone (lower panel). b Cells were pretreated with DHA (50 muM) and the ubiquitination inhibitor, PYR-41 (20 or 50 muM), for 2 h and were then stimulated with cerulein (10 -8 M) for 2 h. Protein levels of the vATPase E subunit were determined by western blotting. Actin was used as a loading control. c Levels of the vATPase E subunit in cytosolic and membrane fractions were determined by western blot anal