Explore
 Validate
 Learn
Learn Western blot
 Immunocytochemistry
Antibody data
- Antibody Data
- Antigen structure
- References [1]
- Comments [0]
- Validations
- Immunocytochemistry [2]
- Immunohistochemistry [1]
- Flow cytometry [2]
- Other assay [6]
Submit
Validation data
Reference
Comment
Report error
- Product number
- PA5-15198 - Provider product page

- Provider
- Invitrogen Antibodies
- Product name
- BDNF Polyclonal Antibody
- Antibody type
- Polyclonal
- Antigen
- Synthetic peptide
- Description
- This antibody is predicted to react with bovine, mouse, porcine and rat based on sequence homology.
- Reactivity
- Human
- Host
- Rabbit
- Isotype
- IgG
- Vial size
- 400 μL
- Concentration
- 2 mg/mL
- Storage
- Store at 4°C short term. For long term storage, store at -20°C, avoiding freeze/thaw cycles.
Submitted references Characterization of the SIM-A9 cell line as a model of activated microglia in the context of neuropathic pain.
Dave KM, Ali L, Manickam DS
PloS one 2020;15(4):e0231597
PloS one 2020;15(4):e0231597
No comments: Submit comment
Supportive validation
- Submitted by
- Invitrogen Antibodies (provider)
- Main image

- Experimental details
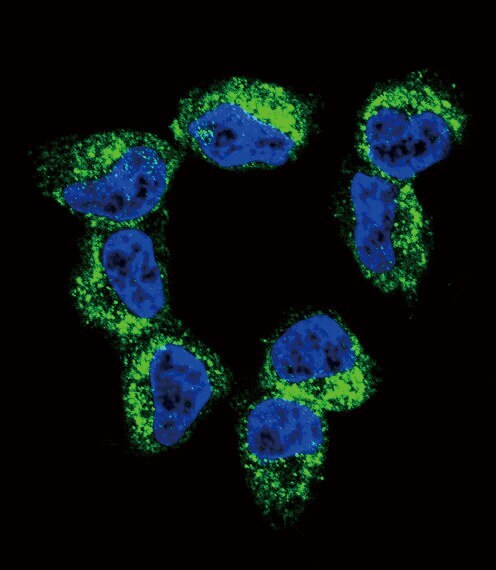
- Immunofluorescent analysis of NCI-H460 cells using a BDNF polyclonal antibody (Product # PA5-15198) at a dilution of 1:10-50, followed by a fluor-conjugated goat anti-rabbit secondary antibody (green). Nuclei were stained with DAPI (blue).

- Submitted by
- Invitrogen Antibodies (provider)
- Main image

- Experimental details
- Immunocytochemistry analysis of BDNF in NCI-H460 cells. Samples were incubated in BDNF polyclonal antibody (Product # PA5-15198) followed by Alexa Fluor 488-conjugated goat anti-rabbit lgG (green). DAPI was used to stain the cell nuclear (blue).
Supportive validation
- Submitted by
- Invitrogen Antibodies (provider)
- Main image
- Experimental details
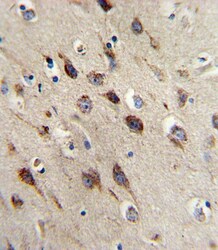
- Immunohistochemistry analysis of BDNF in formalin-fixed and paraffin-embedded human brain. Samples were incubated with BDNF polyclonal antibody (Product # PA5-15198) which was peroxidase-conjugated to the secondary antibody, followed by DAB staining. This data demonstrates the use of this antibody for immunohistochemistry; clinical relevance has not been evaluated.

Supportive validation
- Submitted by
- Invitrogen Antibodies (provider)
- Main image
- Experimental details
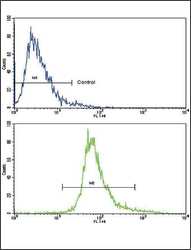
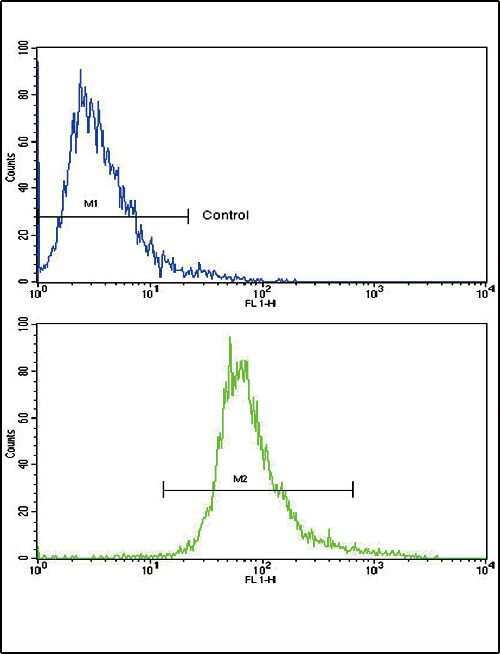
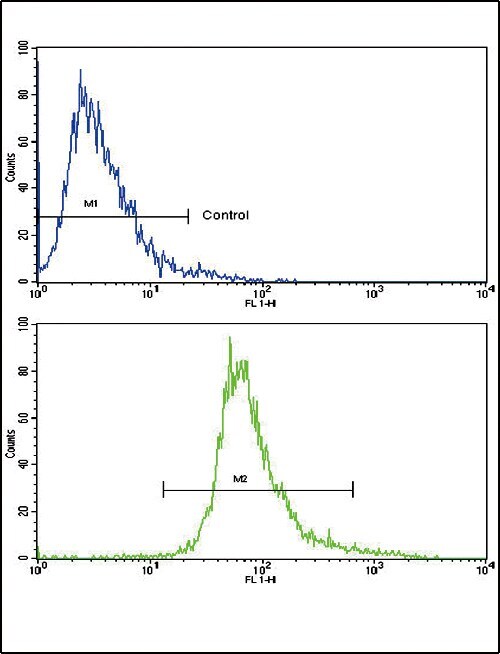
- Flow cytometry analysis of CEM cells using a BDNF polyclonal antibody (Product # PA5-15198) (bottom), compared to a negative control cell (top) at a dilution of 1:10-50, followed by a FITC-conjugated goat anti-rabbit antibody
- Submitted by
- Invitrogen Antibodies (provider)
- Main image
- Experimental details
- Flow cytometry of BDNF in CEM cells (bottom histogram). Samples were incubated with BDNF polyclonal antibody (Product # PA5-15198) followed by FITC-conjugated goat-anti-rabbit secondary antibody. Negative control cell (top histogram).
Supportive validation
- Submitted by
- Invitrogen Antibodies (provider)
- Main image
- Experimental details
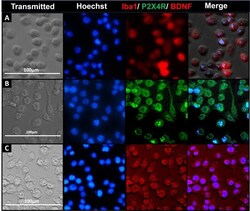
- Fig 1 Iba1, BDNF and P2X4R detection using immunocytochemistry (ICC). ICC study to detect the expression of microglia-specific markers (Iba1, A ) and proteins involved in the signaling pathway initiating pain hypersensitivity (P2X4R, B ; and BDNF, C ) in SIM-A9 cell line. SIM-A9 cells (Passage no. 9; P9) were cultured in a 96-well plate in complete growth media for 48 h. The cells were fixed with 4% PFA followed by immunostaining for Iba1, P2X4R, and BDNF. The cells were captured under phase contrast setting (Transmitted) and nuclei were counterstained using Hoechst 33342. The signals for P2X4R were imaged under the green fluorescence channel (excitation 470/22 nm and emission 510/42 nm) whereas Iba1 and BDNF were imaged under red fluorescence channel (excitation 531/40 and emission 593/40). Similar observations were noted in triplicate wells/group in three independent experiments. Scale bar = 100 mum. All images were cropped at the same scale using Adobe Photoshop CC 19.1.9 for clarity and conciseness of the presentation. Full-length images of a representative set ( B ) is presented in S1 Fig .

- Submitted by
- Invitrogen Antibodies (provider)
- Main image
- Experimental details
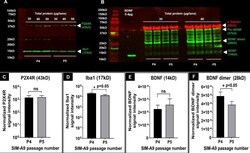
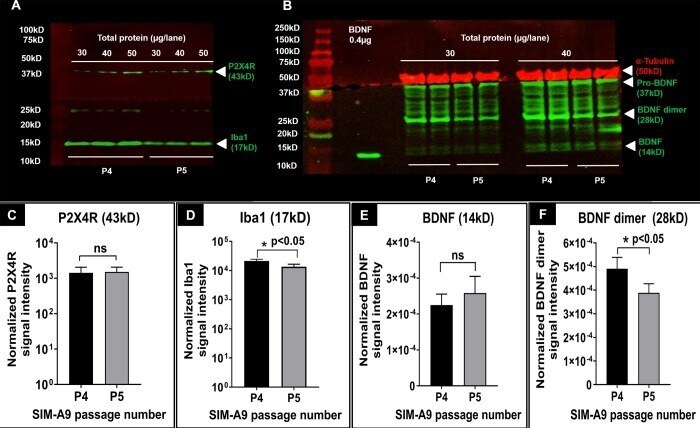
- Fig 2 P2X4R, BDNF and Iba1 detection using western blotting. Western blot of P2X4R and Iba1 proteins ( A ), and alpha-tubulin, BDNF and its isoforms in SIM-A9 cell lysates ( B ) collected from different passages. In each blot, the series of bands on the left shows the protein ladder. For P2X4R and Iba1 ( A ), cell lysates collected from P4 and P5, at 30, 40, and 50mug/lane total protein were used to detect P2X4R (green, 43 kD) and Iba1 (green, 17 kD) on the 800 nm channel. The signals at about 25 kD are due to the non-specific reactivity of secondary antibody. For alpha-tubulin and BDNF ( B ), cell lysates at 30 and 40 mug/lane total protein were electrophoresed to identify alpha-tubulin (50 kD), BDNF monomer (14 kD), BDNF dimer (28 kD), and pro-BDNF (37 kD) on the 700 nm and 800 nm channels, respectively. The blots were scanned using an Odyssey imager at intensity setting 5 and processed using ImageStudio 5.2 software. Each sample was run in triplicates ( A ) or duplicates ( B ). C-F . Densitometry analysis of P2X4R, Iba1, BDNF, and BDNF dimer bands was performed using ImageStudio 5.2 software. Signal intensities of P2X4R ( C ) and Iba1 ( D ) bands were normalized for protein loading. Signal intensities of BDNF ( E ) and BDNF dimers ( F ) were first normalized to alpha-tubulin and then to the amount of protein loaded. Statistical analysis between P4 and P5 was performed by unpaired t-test and Welch's correction using GraphPad Prism 8.1.2. Asterisks indicate statistically sig
- Submitted by
- Invitrogen Antibodies (provider)
- Main image
- Experimental details
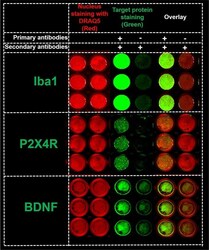
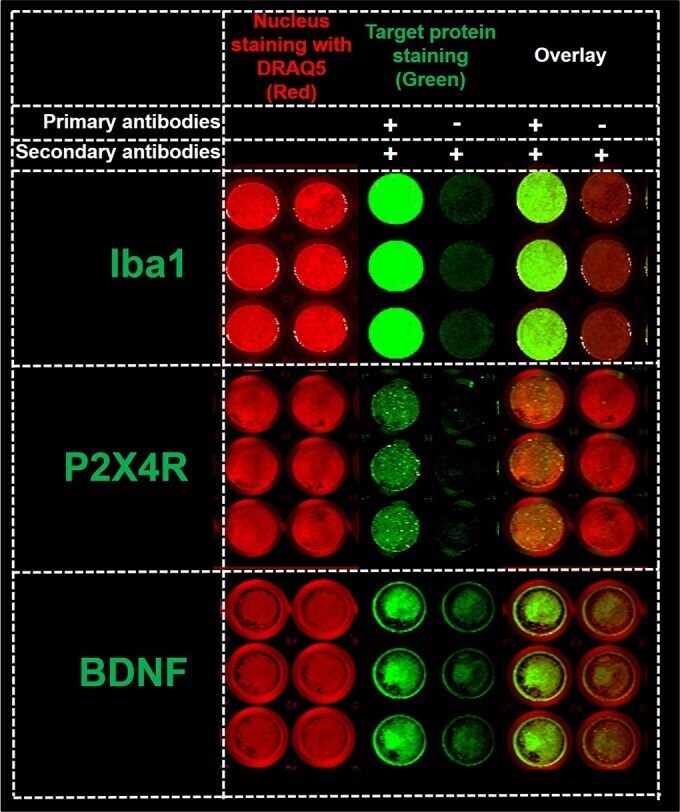
- Fig 3 In-cell western for Iba1, P2X4R and BDNF detection. The detection of Iba1, P2X4R, and BDNF expression (green fluorescence, 800 nm channel) and cell nucleus (red fluorescence, 700 nm channel) in 96-well plates using In-cell western (ICW). SIM-A9 cells in 96-well plates were fixed with 4% PFA and were treated using a Li-COR Odyssey blocking solution. Each protein was analyzed in two columns. For each group (nuclear staining, target protein staining, and overlay), the cells in the left columns were immunostained with Iba1, P2X4R, or BDNF primary and secondary antibodies (+/+), whereas the primary antibodies were omitted in the right columns (-/+). All wells were incubated with AF790 secondary antibodies (1:700 dilution) and DRAQ5 (nucleus stain, 1:3000) prior to scanning using a Li-COR Odyssey near-infrared imaging system at intensity setting 5 and plate height 4.0 mm. Three independent experiments were performed with n = 3 wells per group. ICW images of 96-well plates for each protein were merged and cropped for the clarity and conciseness of the presentation. Full-length scans are presented in S4A-S4C Fig .
- Submitted by
- Invitrogen Antibodies (provider)
- Main image
- Experimental details
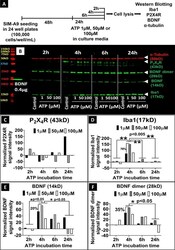
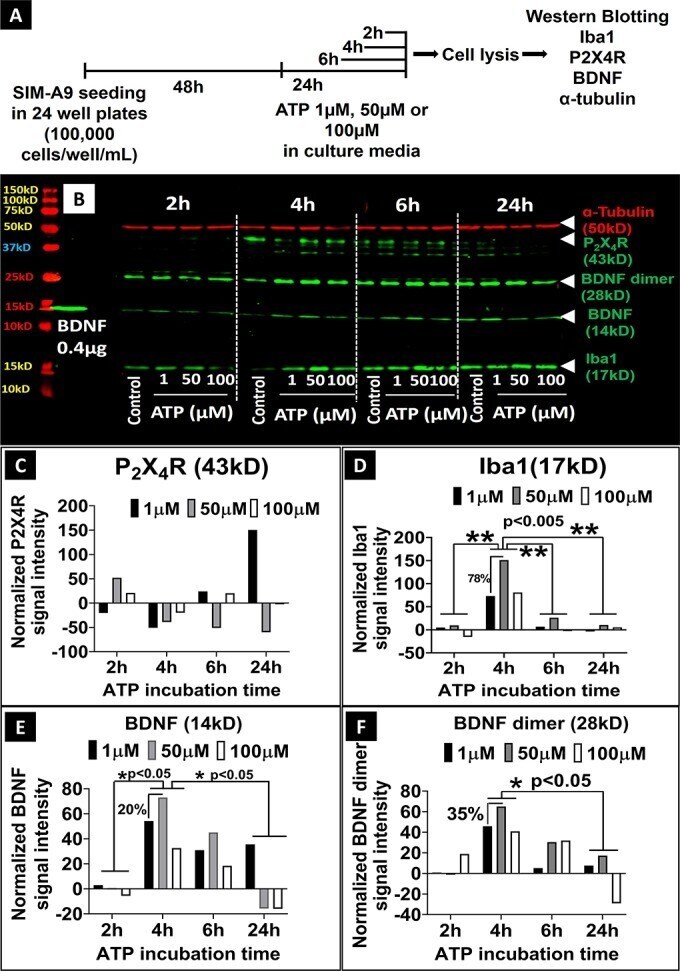
- Fig 5 Effect of ATP on the expression of Iba1, P2X4R, BDNF, and alpha-tubulin proteins in SIM-A9 microglia cells analyzed using western blot. A ) SIM-A9 cells (P6) were cultured for 48 h and exposed to 1, 50, and 100 muM ATP for 2, 4, 6 and 24 h, then lysed immediately after the treatment for subsequent analysis. B ) For P2X4R and BDNF evaluation, cell lysates were loaded at 50 mug in each lane, and the loading amount for Iba1 and alpha-tubulin was 30 mug/lane. Human recombinant BDNF protein (14 kD) was loaded at 0.4 mug/lane as a positive control. ATP concentration and time-dependent modulation of the levels of alpha-tubulin (50 kD, red), P2X4R (43 kD), BDNF (14 kD), BDNF dimer (28 kD) and Iba1 (17 kD) was studied after scanning the blots at 700 nm and 800 nm channels using Odyssey imager at intensity setting 5. C - F . Densitometry analysis of P2X4R, Iba1, BDNF, and BDNF dimer bands was performed using ImageStudio 5.2 software. Normalized signal intensity in Y-axis represents a normalization of protein signal intensity to, first, alpha-tubulin signal intensity followed by normalization to the signal intensity of control/untreated cells at each time point. Note: C-F demonstrates the quantification of the western blot shown in Fig 5B . It should be noted that the experiment was performed three independent times and the densitometry analysis for representative proteins, BDNF and Iba1, are shown in S12 Fig . Statistical analysis between specified groups was performed using Grap
- Submitted by
- Invitrogen Antibodies (provider)
- Main image
- Experimental details
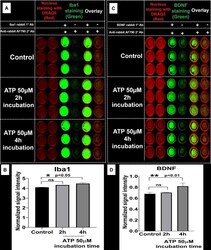
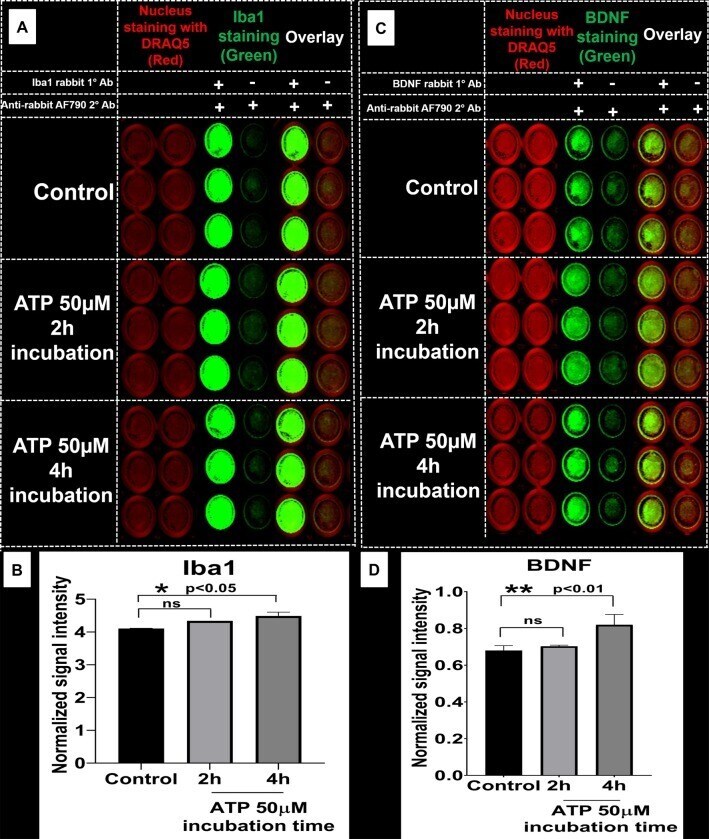
- Fig 6 In-cell western analysis of the effect of ATP stimulation on Iba1 and BDNF expression. A ) SIM-A9 microglia cells (P8) were cultured for 48 h and exposed to 50 muM ATP for 2 and 4 h. Cells were fixed with 4% PFA, then treated with blocking solution and Iba1 protein was stained using rabbit Iba1 (1:500) and anti-rabbit AF790 (1:700, green). C ) BDNF was stained using rabbit BDNF (1:500) and anti-rabbit AF790 (1:700, green). Nucleus was stained with DRAQ5 (red). Non-specific binding of secondary antibodies was accounted for by omitting primary antibodies in each group. B and D ) Densitometry analysis of each plate (Iba1 and BDNF) was performed using ImageStudio 5.2 software. Normalized signal intensity in Y-axis represents the normalization of protein signal intensity to nuclear staining followed by subtraction of non-specific signal intensity (-/+, no 1deg, only 2deg Ab). Statistical analysis between specified groups was performed using GraphPad Prism 8.1.2. Asterisks represent statistically significant differences (* p
- Submitted by
- Invitrogen Antibodies (provider)
- Main image
- Experimental details
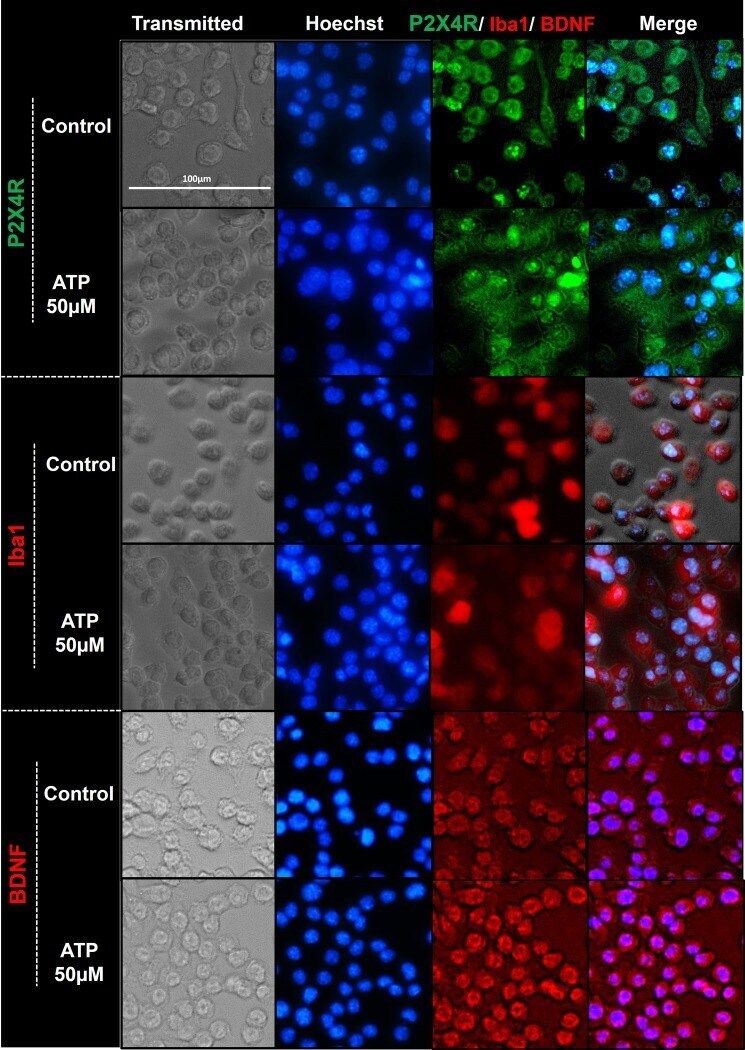
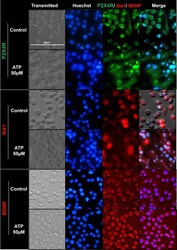
- Fig 7 Immunocytochemistry images depicting ATP-mediated modulation of P2X4R, Iba1, and BDNF expression in SIM-A9 microglia cells. SIM-A9 cells (P8) were cultured for 48 h and incubated with 50 muM ATP for 2 h. Control, untreated cells, and treated cells were fixed with 4% PFA, blocked to prevent non-specific antibody binding, and immunostained with mouse-P2X4R (1:250), rabbit-Iba1 (1:500), and BDNF (1:500) primary antibodies, respectively. P2X4R was counterstained with anti-mouse AF555 (green), Iba1 and BDNF with anti-rabbit AF488 (red), and the nucleus was stained with Hoechst 33342 dye (blue). Images were captured under the phase-contrast setting (Transmitted), DAPI (blue), green or red channels, and merged in the overlay image. Triplicate samples were analyzed in two independent experiments. Scale bar = 100 mum. All images were cropped at the same scale using Adobe Photoshop CC 19.1.9 for clarity and conciseness of the presentation. The full length of a representative phase-contrast image for P2X4R is presented in S1 Fig .