Explore
 Validate
 Learn
Learn Western blot
 Immunocytochemistry
Antibody data
- Antibody Data
- Antigen structure
- References [1]
- Comments [0]
- Validations
- Immunocytochemistry [2]
- Immunohistochemistry [1]
- Other assay [1]
Submit
Validation data
Reference
Comment
Report error
- Product number
- PA5-35104 - Provider product page

- Provider
- Invitrogen Antibodies
- Product name
- Maspin Polyclonal Antibody
- Antibody type
- Polyclonal
- Antigen
- Synthetic peptide
- Reactivity
- Human, Mouse
- Host
- Rabbit
- Isotype
- IgG
- Vial size
- 400 μL
- Concentration
- 0.5 mg/mL
- Storage
- Store at 4°C short term. For long term storage, store at -20°C, avoiding freeze/thaw cycles.
Submitted references CYLD Inhibits the Development of Skin Squamous Cell Tumors in Immunocompetent Mice.
Alameda JP, García-García VA, López S, Hernando A, Page A, Navarro M, Moreno-Maldonado R, Paramio JM, Ramírez Á, García-Fernández RA, Casanova ML
International journal of molecular sciences 2021 Jun 23;22(13)
International journal of molecular sciences 2021 Jun 23;22(13)
No comments: Submit comment
Supportive validation
- Submitted by
- Invitrogen Antibodies (provider)
- Main image

- Experimental details
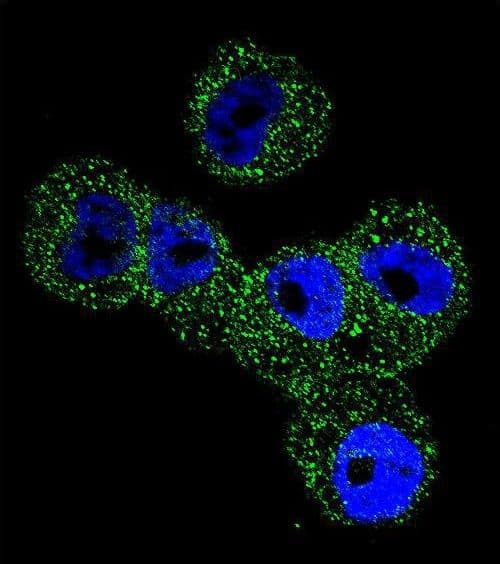
- Immunofluorescent analysis of Maspin in A2058 cells using a Maspin polyclonal antibody (Product # PA5-35104) followed by detection using a fluorescent conjugated secondary antibody (green). Nuclei were stained with Dapi (blue).
- Submitted by
- Invitrogen Antibodies (provider)
- Main image

- Experimental details
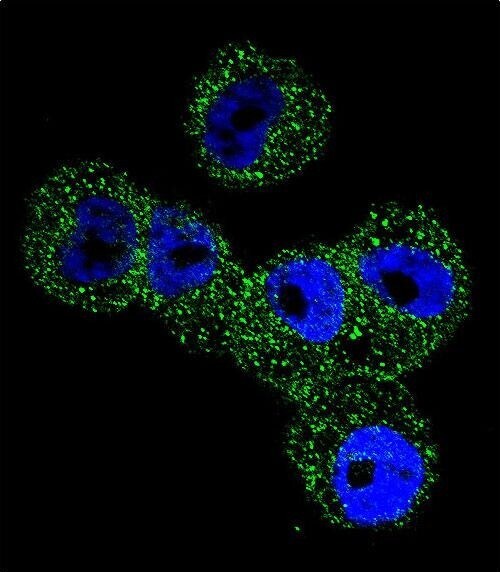
- Immunocytochemistry analysis of Maspin in A2058 cells. Samples were incubated in Maspin polyclonal antibody (Product # PA5-35104) followed by Alexa Fluor 488-conjugated goat anti-rabbit lgG (green). DAPI was used to stain the cell nuclear (blue).
Supportive validation
- Submitted by
- Invitrogen Antibodies (provider)
- Main image

- Experimental details
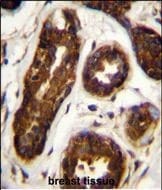
- Immunohistochemistry analysis of Maspin in formalin fixed and paraffin embedded human breast tissue. Samples were incubated with Maspin polyclonal antibody (Product # PA5-35104) followed by peroxidase conjugation of the secondary antibody and DAB staining. This data demonstrates the use of this antibody for immunohistochemistry. Clinical relevance has not been evaluated.
Supportive validation
- Submitted by
- Invitrogen Antibodies (provider)
- Main image
- Experimental details
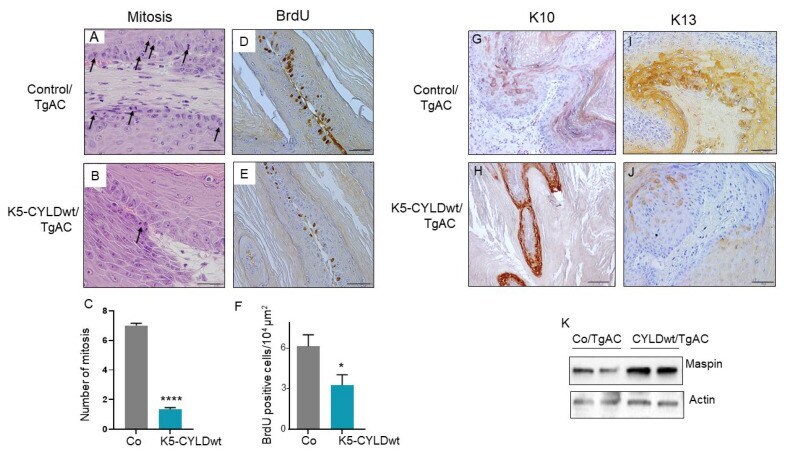
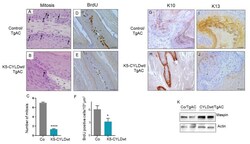
- Figure 7 K5-CYLDwt/TgAc tumors are less proliferative and more differentiated. ( A , B ) Representative pictures showing increased number of mitosis in Control/TgAC tumors. ( C ) Graph showing the significant increase in the number of mitosis/um 2 in Control/TgAC tumors. ( D , E ) Immunostaining with an anti-BrdU antibody showing increased number of proliferating cells in Control/TgAC tumors ( D ) than in K5-CYLDwt/TgAC tumors ( E ). ( F ) Graph showing the diminished number of BrdU-positive cells/um 2 in K5-CYLDwt/TgAC tumors. ( G , H ) Observe the weak and discontinuous expression of K10 in Control/TgAC tumors ( G ) versus the strong and continuous expression in K5-CYLDwt/TgAC tumors ( H ). ( I , J ) K13 immunostaining. Note the induction of K13 in Control/TgAC tumors ( I ), while only sporadic K13 positive cells were detected in K5-CYLDwt/TgAC tumors ( J ). ( K ) WB showing increased Maspin expression in K5-CYLDwt/TgAC tumors. Data are shown as mean +- SEM; **** p < 0.0001; * p < 0.05 by two-tailed t-test with Welch's correction. Mitosis: n = 79 tumors from five different Control/TgAC mice; n = 32 tumors from five different K5-CYLDwt/TgAC mice. BrdU staining: seven tumors from five mice of each genotype. Scale bars: 25 um ( A , B ); 60 um ( D , E ); 50 um ( G - J ).