Explore
 Validate
 Learn
Learn Western blot
 Immunocytochemistry
Antibody data
- Antibody Data
- Antigen structure
- References [1]
- Comments [0]
- Validations
- Immunocytochemistry [3]
- Immunohistochemistry [1]
- Other assay [4]
Submit
Validation data
Reference
Comment
Report error
- Product number
- PA5-20611 - Provider product page

- Provider
- Invitrogen Antibodies
- Product name
- OTUD5 Polyclonal Antibody
- Antibody type
- Polyclonal
- Antigen
- Synthetic peptide
- Description
- A suggested positive control is human kidney tissue lysate. PA5-20611 can be used with blocking peptide PEP-0731.
- Reactivity
- Human, Mouse, Rat
- Host
- Rabbit
- Isotype
- IgG
- Vial size
- 100 μg
- Concentration
- 1 mg/mL
- Storage
- Maintain refrigerated at 2-8°C for up to 3 months. For long term storage store at -20°C
Submitted references Deubiquitinase OTUD5 modulates mTORC1 signaling to promote bladder cancer progression.
Hou T, Dan W, Liu T, Liu B, Wei Y, Yue C, Que T, Ma B, Lei Y, Wang Z, Zeng J, Fan Y, Li L
Cell death & disease 2022 Sep 9;13(9):778
Cell death & disease 2022 Sep 9;13(9):778
No comments: Submit comment
Supportive validation
- Submitted by
- Invitrogen Antibodies (provider)
- Main image
- Experimental details
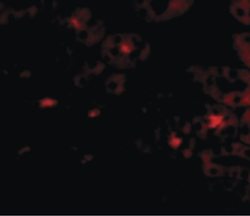
- Immunofluorescent analysis of human kidney cells using a OTUD5 polyclonal antibody (Product # PA5-20611) at a 20 µg/mL dilution.

- Submitted by
- Invitrogen Antibodies (provider)
- Main image
- Experimental details
- Immunofluorescence of OTUD5 in Human Kidney cells with OTUD5 Polyclonal Antibody (Product # PA5-20611) at 20 µg/mL.

- Submitted by
- Invitrogen Antibodies (provider)
- Main image

- Experimental details
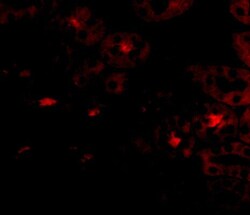
- Immunofluorescence of OTUD5 in Human Kidney cells with OTUD5 Polyclonal Antibody (Product # PA5-20611) at 20 µg/mL.

Supportive validation
- Submitted by
- Invitrogen Antibodies (provider)
- Main image
- Experimental details
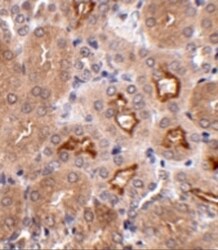
- Immunohistochemistry of OTUD5 in mouse kidney tissue with OTUD5 Polyclonal Antibody (Product # PA5-20611) at 2.5 µg/mL.

Supportive validation
- Submitted by
- Invitrogen Antibodies (provider)
- Main image

- Experimental details
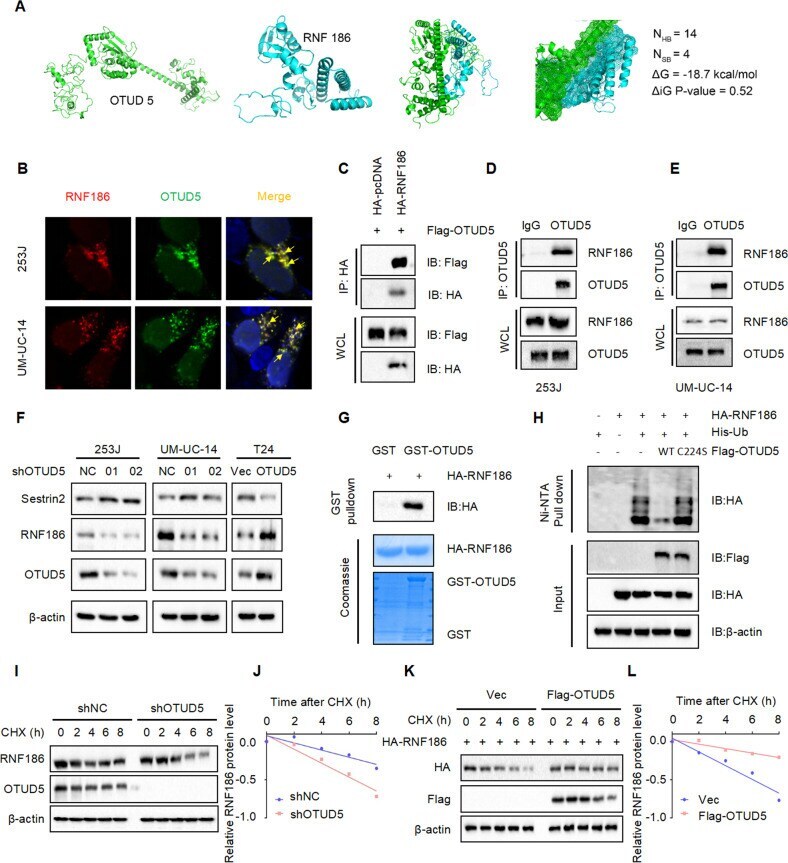
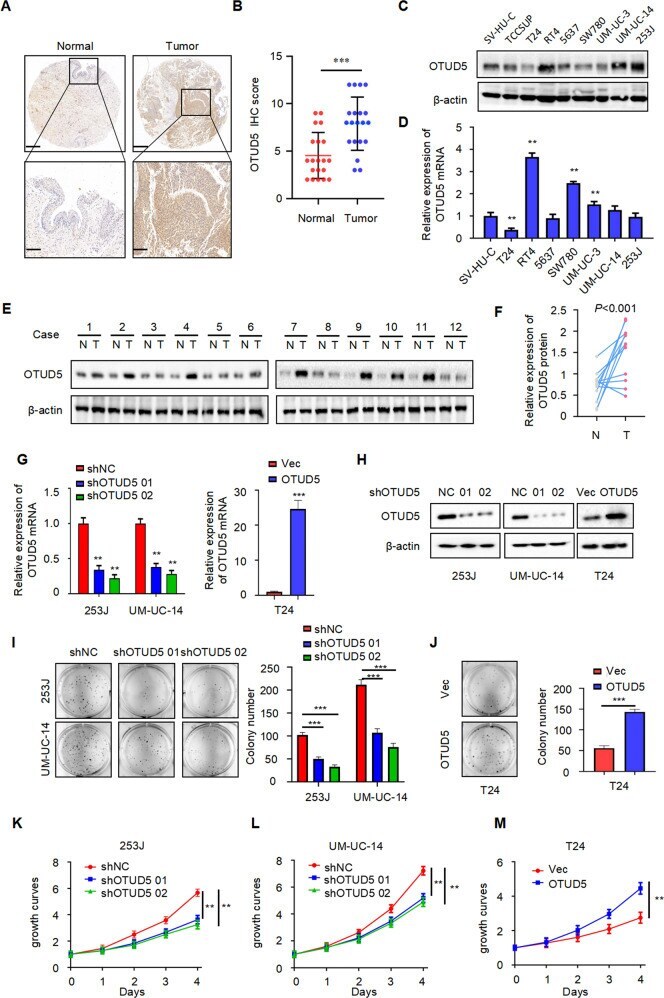
- Fig. 1 OTUD5 is overexpressed and acts as an oncogene in bladder cancer. A Representative images of OTUD5 immunohistochemistry (IHC) staining in bladder cancer tissue and adjacent normal bladder tissue samples. Scale bars, upper 500 mum, lower 100 mum. B Statistical analysis of OTUD5 expression in adjacent normal bladder tissues and bladder cancer tissues. *** P < 0.001. C , D Western blot analysis and quantitative real-time RT-PCR of OTUD5 expression in the normal human bladder cell line and bladder cancer cell lines. E Western blot analysis of OTUD5 protein expression in adjacent normal bladder tissues and cancer tissues. beta-actin was used as the loading control. F . The quantitative analysis of the relative expression of OTUD5 protein. G , H Quantitative real-time RT-PCR and Western blotting analysis of OTUD5 expression in 253 J or UM-UC-14 cell lines transfected with OTUD5 shRNAs and shNC, and T24 cell line infected with OTUD5 lentivirus and negative control. 18 S was applied as the endogenous control for quantitative real-time RT-PCR, and beta-actin was used as a loading control for Western blotting assay. I Colony formation assays and quantification results of 253 J and UM-UC-14 cells with OTUD5 knockdown. *** P < 0.001. J Colony formation assays and quantification results of T24 cells with OTUD5 overexpression. Vec vector. *** P < 0.001. K , L , M MTT assay was performed to detect viability in 253 J and UM-UC-14 cells with OTUD5 knockdown and T24 cells with OTUD5 ove
- Submitted by
- Invitrogen Antibodies (provider)
- Main image
- Experimental details
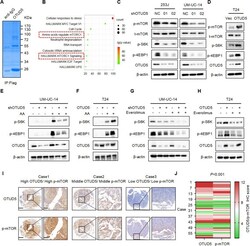
- Fig. 3 OTUD5 positively regulates the mTOR signaling pathway. A Flag-OTUD5 was immunoprecipitated (IP) from 293 T cells transfected with Flag-OTUD5 plasmid and the lysates were subjected to SDS-PAGE and Coomassie Blue staining. B Enrichment analysis of mass spectrometry results showed that OTUD5 is involved in the mTOR signaling pathway. C IB analysis of whole-cell lysates (WCL) derived from 253 J and UM-UC-14 cells stably expressing shOTUD5 and shNC. shNC was used as the negative control. p-mTOR, t-mTOR, p-S6K, p-4EBP1 and OTUD5 were detected. beta-actin was used as the loading control. D IB analysis of WCL derived from T24 cells stably overexpressing OTUD5 and vector. Vector was used as the negative control. E , F UM-UC-14 shNC/shOTUD5 cells ( E ) and T24 Vec/oeOTUD5 cells ( F ) were subjected to amino acid starvation for 6 hours and resupplementation for 1 hour. p-S6K, p-4EBP1 and OTUD5 were detected. G , H UM-UC-14 shNC/shOTUD5 cells ( G ) and T24 Vec/oeOTUD5 cells ( H ) were treated with or without everolimus. I Representative images of OTUD5 and p-mTOR IHC staining in patient-derived bladder cancer tissues. Scale bars, left 500 mum, right 100 mum. J . Correlation analysis of OTUD5 and p-mTOR expression in patient-derived bladder cancer tissues. All data are presented as mean +- SD of 3 independent experiments.
- Submitted by
- Invitrogen Antibodies (provider)
- Main image

- Experimental details
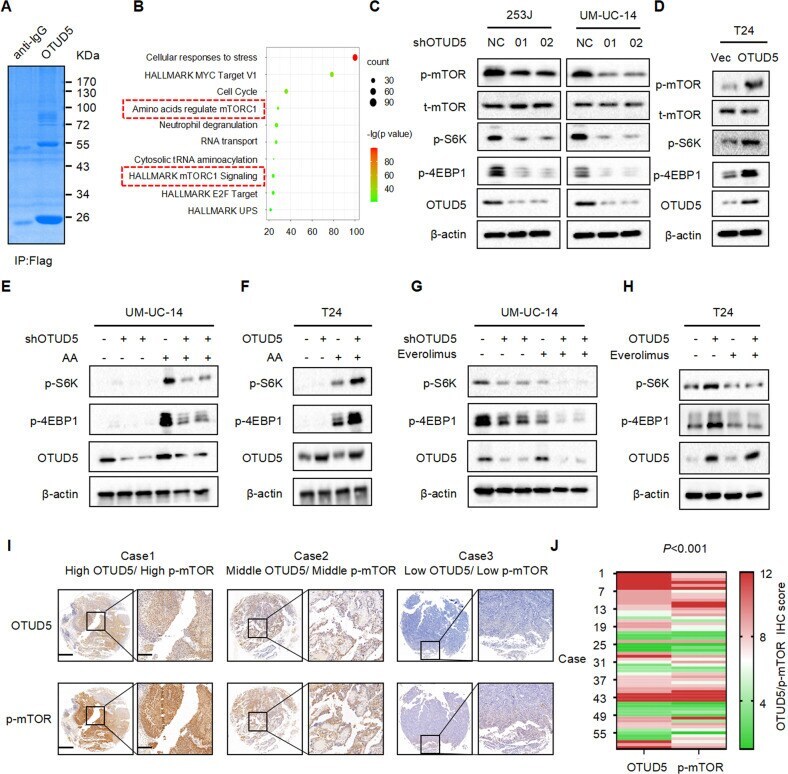
- Fig. 4 OTUD5 regulates the protein stability of sestrin2, a feedback inhibitor of mTOR. A The interaction diagram between OTUD5 and specific proteins in the mTOR signaling pathway was obtained by mass spectrometry analysis. B Confocal immunofluorescence microscopic analysis of OTUD5 and sestrin2 in 253 J and UM-UC-14 cells. Scale bars represent 10 mum. C IB analysis of WCL and anti-HA immunoprecipitates (IPs) derived from 293 T cells transfected with Flag-OTUD5 and HA-tagged sestrin1-3. pcDNA3.1 was used as the control. D IB analysis of WCL derived from 253 J and UM-UC-14 cells stably expressing shOTUD5 and T24 cells stably overexpressing OTUD5. p-mTOR, p-4EBP1 and sestrin2 were detected, beta-actin was used as the loading control. E GST pull-down assay revealed no direct interaction between sestrin2 and OTUD5. The upper panel presents the result of IB using the antibody against HA, and the lower panels show Coomassie blue staining of the purified proteins. F IB analysis of WCL and Ni-NTA pull-down products derived from 293 T cells transfected with Flag-OTUD5 WT, Flag-OTUD5 C224S, HA-sestrin2 and His-Ub. 20 muM MG132 was added 6 hours before harvesting the cells. G OTUD5 knockdown cells (shOTUD5) as well as parental UM-UC-14 cells (shNC) were treated with 100 mug/ml cycloheximide (CHX) for the indicated time period before harvesting. Equal amounts of WCL were immunoblotted with the indicated antibodies. H Quantification of the band intensities in G . Sestrin2 levels were norm
- Submitted by
- Invitrogen Antibodies (provider)
- Main image
- Experimental details
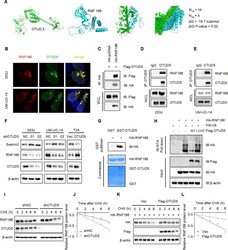
- Fig. 5 OTUD5 stabilizes RNF186 by deubiquitination, leading to sestrin2 degradation. A Protein binding prediction chart for OTUD5 and RNF186. B Confocal immunofluorescence microscopic analysis of OTUD5 and RNF186 in 253 J and UM-UC-14 cells. Scale bars represent 10 mum. C IB analysis of WCL and anti-HA immunoprecipitates (IPs) derived from 293 T cells transfected with Flag-OTUD5 and HA-tagged RNF186, pcDNA3.1 was used as the control. D , E OTUD5 interacts with RNF186. Co-immunoprecipitation (co-IP) of OTUD5 and RNF186 was assayed in 253 J and UM-UC-14 cells. Immunoprecipitation (IP) was performed using the antibody against OTUD5, and the endogenous interaction between OTUD5 and RNF186 was determined by Western blotting using the antibody against RNF186. F IB analysis of WCL derived from 253 J and UM-UC-14 cells stably expressing shOTUD5 and T24 cells stably overexpressing OTUD5. RNF186 and sestrin2 were detected, beta-actin was used as the loading control. G GST pull-down assay revealed the direct interaction between RNF186 and OTUD5. The upper panel presents the result of IB using the antibody against HA, and the lower panels show Coomassie blue staining of the purified proteins. H IB analysis of WCL and Ni-NTA pull-down products derived from 293 T cells transfected with Flag-OTUD5 WT, Flag-OTUD5 C224S, HA-RNF186 and His-Ub. 20 muM MG132 was added 6 h before harvesting the cells. I OTUD5 knockdown cells (shOTUD5) as well as parental UM-UC-14 cells (shNC) were treated with 10