Explore
 Validate
 Learn
Learn Flow cytometry
Antibody data
- Antibody Data
- Antigen structure
- References [19]
- Comments [0]
- Validations
- Flow cytometry [2]
- Other assay [24]
Submit
Validation data
Reference
Comment
Report error
- Product number
- 16-1278-82 - Provider product page

- Provider
- Invitrogen Antibodies
- Product name
- CD127 Monoclonal Antibody (eBioRDR5), Functional Grade, eBioscience™
- Antibody type
- Monoclonal
- Antigen
- Other
- Description
- Description: The eBioRDR5 monoclonal antibody reacts with human CD127 (Interleukin-7 Receptor alpha). CD127 complexes with CD132, also known as the common gamma chain (gamma c), to form the multi-functional IL-7 receptor (IL-7R). CD127 is a type I glycoprotein with a molecular weight of 75-80 kDa and is expressed by immature B cells through the early pre-B stage, by thymocytes during several stages of their development, and on most mature T cells, with transient down-regulation upon activation. Binding of IL-7 results in signal transduction which occurs through several tyrosine kinase pathways including the Jak/STAT pathway. IL-7 is indispensible for the development of lymphocytes, and the control of homeostatic proliferation of T-cells in the periphery. In addition, IL-7R signaling is know to be involved in the regulation of T cell receptor (TCR) locus rearrangement in gamma delta T cells. Interestingly, recently it has been demonstrated that CD127 expression is down-regulated on CD4+CD25+ regulatory T cells (T regs). While the co-expression of CD4 and CD25 has become widely used as an indicator of T regs, this method of identification may also include cells without suppressive activity. It has clearly been shown that CD4+CD25+ cells that have down-regulated the expression of CD127 are significantly more highly-enriched for the regulatory T population, as defined by expression of the T reg-specific transcription factor Foxp3 and the suppressive activity of these cells, in vitro. Binding of the eBioRDR5 monoclonal antibody to PBMCs is blocked by pre-incubation of the cells with recombinant human IL-7 (Product # 14-1079-80). Applications Reported: This eBioRDR5 antibody has been reported for use in flow cytometric analysis. Applications Tested: This eBioRDR5 antibody has been tested by flow cytometric analysis of normal human peripheral blood cells. This can be used at less than or equal to 0.06 µg per test. A test is defined as the amount (µg) of antibody that will stain a cell sample in a final volume of 100 µL. Cell number should be determined empirically but can range from 10^5 to 10^8 cells/test. It is recommended that the antibody be carefully titrated for optimal performance in the assay of interest. Storage and handling: Use in a sterile environment. Filtration: 0.2 µm post-manufacturing filtered. Purity: Greater than 90%, as determined by SDS-PAGE. Endotoxin Level: Less than 0.001 ng/µg antibody, as determined by LAL assay. Aggregation: Less than 10%, as determined by HPLC.
- Reactivity
- Human
- Host
- Mouse
- Isotype
- IgG
- Antibody clone number
- eBioRDR5
- Vial size
- 100 μg
- Concentration
- 1 mg/mL
- Storage
- 4°C
Submitted references Undernutrition is associated with perturbations in T cell-, B cell-, monocyte- and dendritic cell- subsets in latent Mycobacterium tuberculosis infection.
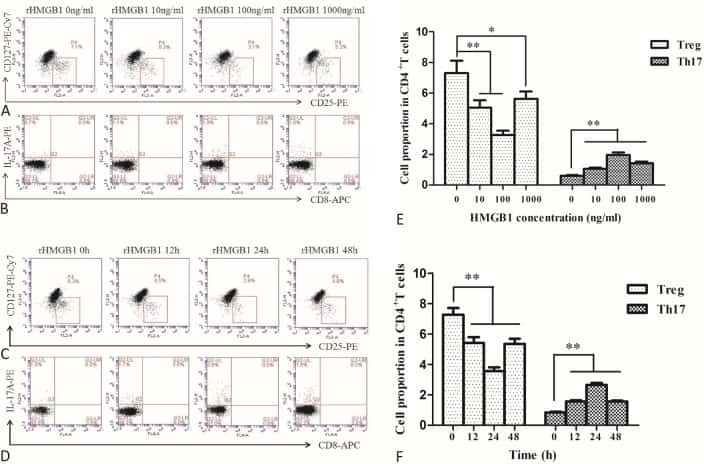
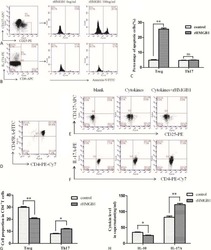
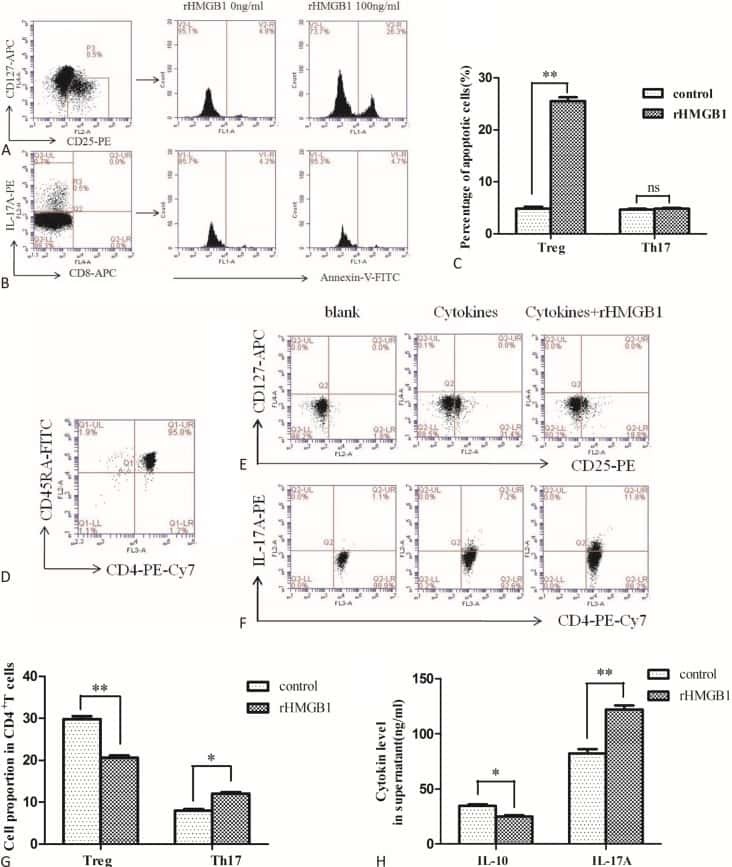
The Effects of High Mobility Group Box-1 Protein on Peripheral Treg/Th17 Balance in Patients with Atherosclerosis.
Activation of miR-21-Regulated Pathways in Immune Aging Selects against Signatures Characteristic of Memory T Cells.
A probiotic modulates the microbiome and immunity in multiple sclerosis.
OMIP-042: 21-color flow cytometry to comprehensively immunophenotype major lymphocyte and myeloid subsets in human peripheral blood.
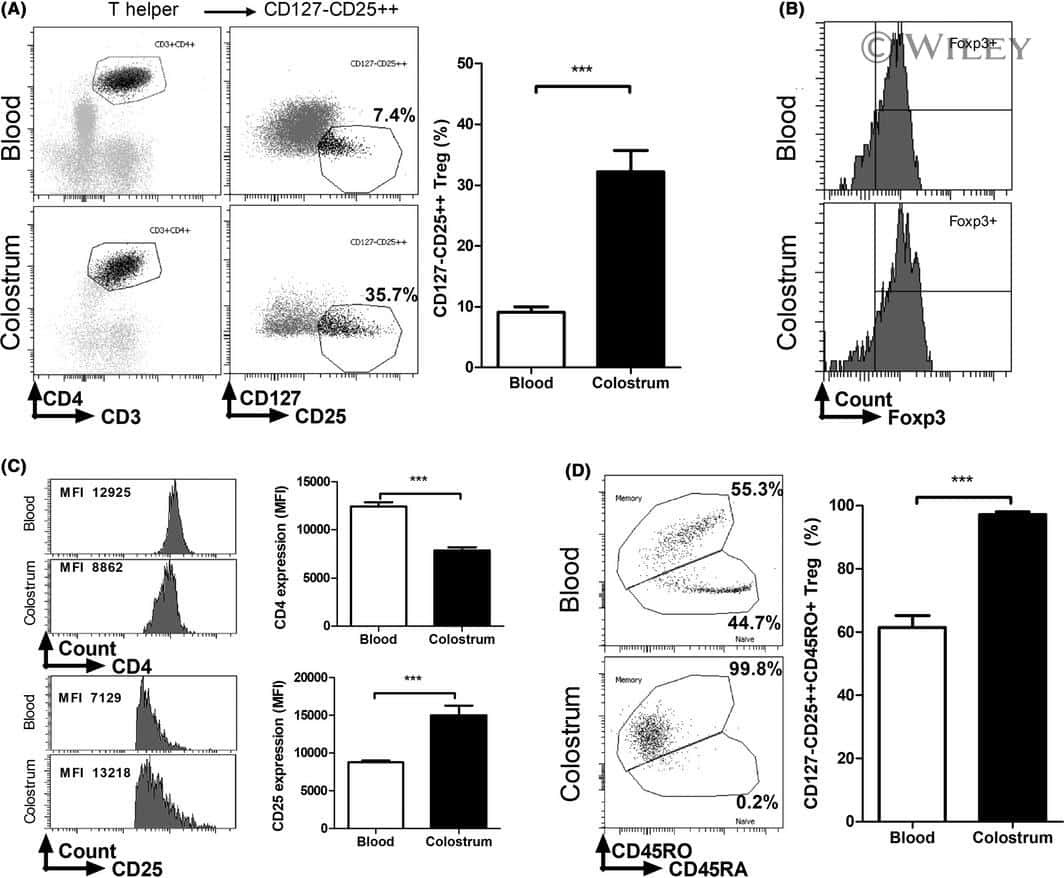
Characterization of CD127(-) CD25(++) Treg from human colostrum.
Serial immunomonitoring of cancer patients receiving combined antagonistic anti-CD40 and chemotherapy reveals consistent and cyclical modulation of T cell and dendritic cell parameters.
HDAC inhibition potentiates immunotherapy in triple negative breast cancer.
Blocking the recruitment of naive CD4(+) T cells reverses immunosuppression in breast cancer.
Dexamethasone co-medication in cancer patients undergoing chemotherapy causes substantial immunomodulatory effects with implications for chemo-immunotherapy strategies.
The Distribution of Human Stem Cell-like Memory T Cell in Lung Cancer.
OMIP-030: Characterization of human T cell subsets via surface markers.
Enhanced suppressor function of TIM-3+ FoxP3+ regulatory T cells.
Decrease in proportion of CD19+ CD24(hi) CD27+ B cells and impairment of their suppressive function in Graves' disease.
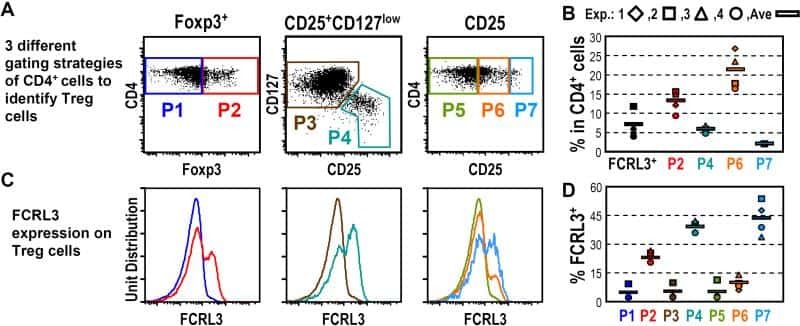
Fc receptor-like 3 protein expressed on IL-2 nonresponsive subset of human regulatory T cells.
Allosuppressive donor CD4+CD25+ regulatory T cells detach from the graft and circulate in recipients after liver transplantation.
Loss of IL-7 receptor alpha on CD4+ T cells defines terminally differentiated B cell-helping effector T cells in a B cell-rich lymphoid tissue.
Loss of IL-7 receptor alpha on CD4+ T cells defines terminally differentiated B cell-helping effector T cells in a B cell-rich lymphoid tissue.
CD127 expression inversely correlates with FoxP3 and suppressive function of human CD4+ T reg cells.
Rajamanickam A, Munisankar S, Dolla CK, Babu S
PloS one 2019;14(12):e0225611
PloS one 2019;14(12):e0225611
The Effects of High Mobility Group Box-1 Protein on Peripheral Treg/Th17 Balance in Patients with Atherosclerosis.
Ding JW, Zhou T, Zheng XX, Wang XA, Tong XH, Luo CY, Zhang ZQ, Yu B
Acta Cardiologica Sinica 2018 Sep;34(5):399-408
Acta Cardiologica Sinica 2018 Sep;34(5):399-408
Activation of miR-21-Regulated Pathways in Immune Aging Selects against Signatures Characteristic of Memory T Cells.
Kim C, Hu B, Jadhav RR, Jin J, Zhang H, Cavanagh MM, Akondy RS, Ahmed R, Weyand CM, Goronzy JJ
Cell reports 2018 Nov 20;25(8):2148-2162.e5
Cell reports 2018 Nov 20;25(8):2148-2162.e5
A probiotic modulates the microbiome and immunity in multiple sclerosis.
Tankou SK, Regev K, Healy BC, Tjon E, Laghi L, Cox LM, Kivisäkk P, Pierre IV, Hrishikesh L, Gandhi R, Cook S, Glanz B, Stankiewicz J, Weiner HL
Annals of neurology 2018 Jun;83(6):1147-1161
Annals of neurology 2018 Jun;83(6):1147-1161
OMIP-042: 21-color flow cytometry to comprehensively immunophenotype major lymphocyte and myeloid subsets in human peripheral blood.
Staser KW, Eades W, Choi J, Karpova D, DiPersio JF
Cytometry. Part A : the journal of the International Society for Analytical Cytology 2018 Feb;93(2):186-189
Cytometry. Part A : the journal of the International Society for Analytical Cytology 2018 Feb;93(2):186-189
Characterization of CD127(-) CD25(++) Treg from human colostrum.
Cérbulo-Vázquez A, Hernández-Peláez G, Arriaga-Pizano LA, Bautista-Pérez P, Romero-Venado J, Flores-González JC, Figueroa-Damian R, Soriano-Becerril D, Mancilla-Herrera I
American journal of reproductive immunology (New York, N.Y. : 1989) 2018 Feb;79(2)
American journal of reproductive immunology (New York, N.Y. : 1989) 2018 Feb;79(2)
Serial immunomonitoring of cancer patients receiving combined antagonistic anti-CD40 and chemotherapy reveals consistent and cyclical modulation of T cell and dendritic cell parameters.
McDonnell AM, Cook A, Robinson BWS, Lake RA, Nowak AK
BMC cancer 2017 Jun 15;17(1):417
BMC cancer 2017 Jun 15;17(1):417
HDAC inhibition potentiates immunotherapy in triple negative breast cancer.
Terranova-Barberio M, Thomas S, Ali N, Pawlowska N, Park J, Krings G, Rosenblum MD, Budillon A, Munster PN
Oncotarget 2017 Dec 26;8(69):114156-114172
Oncotarget 2017 Dec 26;8(69):114156-114172
Blocking the recruitment of naive CD4(+) T cells reverses immunosuppression in breast cancer.
Su S, Liao J, Liu J, Huang D, He C, Chen F, Yang L, Wu W, Chen J, Lin L, Zeng Y, Ouyang N, Cui X, Yao H, Su F, Huang JD, Lieberman J, Liu Q, Song E
Cell research 2017 Apr;27(4):461-482
Cell research 2017 Apr;27(4):461-482
Dexamethasone co-medication in cancer patients undergoing chemotherapy causes substantial immunomodulatory effects with implications for chemo-immunotherapy strategies.
Cook AM, McDonnell AM, Lake RA, Nowak AK
Oncoimmunology 2016 Mar;5(3):e1066062
Oncoimmunology 2016 Mar;5(3):e1066062
The Distribution of Human Stem Cell-like Memory T Cell in Lung Cancer.
Hong H, Gu Y, Sheng SY, Lu CG, Zou JY, Wu CY
Journal of immunotherapy (Hagerstown, Md. : 1997) 2016 Jul-Aug;39(6):233-40
Journal of immunotherapy (Hagerstown, Md. : 1997) 2016 Jul-Aug;39(6):233-40
OMIP-030: Characterization of human T cell subsets via surface markers.
Wingender G, Kronenberg M
Cytometry. Part A : the journal of the International Society for Analytical Cytology 2015 Dec;87(12):1067-9
Cytometry. Part A : the journal of the International Society for Analytical Cytology 2015 Dec;87(12):1067-9
Enhanced suppressor function of TIM-3+ FoxP3+ regulatory T cells.
Gautron AS, Dominguez-Villar M, de Marcken M, Hafler DA
European journal of immunology 2014 Sep;44(9):2703-2711
European journal of immunology 2014 Sep;44(9):2703-2711
Decrease in proportion of CD19+ CD24(hi) CD27+ B cells and impairment of their suppressive function in Graves' disease.
Zha B, Wang L, Liu X, Liu J, Chen Z, Xu J, Sheng L, Li Y, Chu Y
PloS one 2012;7(11):e49835
PloS one 2012;7(11):e49835
Fc receptor-like 3 protein expressed on IL-2 nonresponsive subset of human regulatory T cells.
Nagata S, Ise T, Pastan I
Journal of immunology (Baltimore, Md. : 1950) 2009 Jun 15;182(12):7518-26
Journal of immunology (Baltimore, Md. : 1950) 2009 Jun 15;182(12):7518-26
Allosuppressive donor CD4+CD25+ regulatory T cells detach from the graft and circulate in recipients after liver transplantation.
Demirkiran A, Bosma BM, Kok A, Baan CC, Metselaar HJ, Ijzermans JN, Tilanus HW, Kwekkeboom J, van der Laan LJ
Journal of immunology (Baltimore, Md. : 1950) 2007 May 15;178(10):6066-72
Journal of immunology (Baltimore, Md. : 1950) 2007 May 15;178(10):6066-72
Loss of IL-7 receptor alpha on CD4+ T cells defines terminally differentiated B cell-helping effector T cells in a B cell-rich lymphoid tissue.
Lim HW, Kim CH
Journal of immunology (Baltimore, Md. : 1950) 2007 Dec 1;179(11):7448-56
Journal of immunology (Baltimore, Md. : 1950) 2007 Dec 1;179(11):7448-56
CD127 expression inversely correlates with FoxP3 and suppressive function of human CD4+ T reg cells.
Liu W, Putnam AL, Xu-Yu Z, Szot GL, Lee MR, Zhu S, Gottlieb PA, Kapranov P, Gingeras TR, Fazekas de St Groth B, Clayberger C, Soper DM, Ziegler SF, Bluestone JA
The Journal of experimental medicine 2006 Jul 10;203(7):1701-11
The Journal of experimental medicine 2006 Jul 10;203(7):1701-11
No comments: Submit comment
Supportive validation
- Submitted by
- Invitrogen Antibodies (provider)
- Main image
- Experimental details
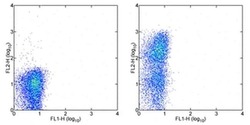
- Staining of normal human peripheral blood mononuclear cells with 0.5 µg of Mouse IgG1 kappa Isotype Control Purified (Product # 14-4714-82) (left) or 0.06 µg of Anti-Human CD127 Purified (right) followed by Anti-Mouse IgG PE (Product # 12-4010-82).Cells in the lymphocyte gate were used for analysis.
- Submitted by
- Invitrogen Antibodies (provider)
- Main image

- Experimental details
- Staining of normal human peripheral blood mononuclear cells with 0.5 µg of Mouse IgG1 kappa Isotype Control Purified (Product # 14-4714-82) (left) or 0.06 µg of Anti-Human CD127 Purified (right) followed by Anti-Mouse IgG PE (Product # 12-4010-82).Cells in the lymphocyte gate were used for analysis.

Supportive validation
- Submitted by
- Invitrogen Antibodies (provider)
- Main image
- Experimental details
- NULL
- Submitted by
- Invitrogen Antibodies (provider)
- Main image
- Experimental details
- NULL

- Submitted by
- Invitrogen Antibodies (provider)
- Main image
- Experimental details
- NULL
- Submitted by
- Invitrogen Antibodies (provider)
- Main image
- Experimental details
- NULL

- Submitted by
- Invitrogen Antibodies (provider)
- Main image
- Experimental details
- NULL

- Submitted by
- Invitrogen Antibodies (provider)
- Main image

- Experimental details
- NULL
- Submitted by
- Invitrogen Antibodies (provider)
- Main image

- Experimental details
- NULL
- Submitted by
- Invitrogen Antibodies (provider)
- Main image
- Experimental details
- NULL
- Submitted by
- Invitrogen Antibodies (provider)
- Main image

- Experimental details
- NULL
- Submitted by
- Invitrogen Antibodies (provider)
- Main image
- Experimental details
- NULL
- Submitted by
- Invitrogen Antibodies (provider)
- Main image
- Experimental details
- NULL
- Submitted by
- Invitrogen Antibodies (provider)
- Main image
- Experimental details
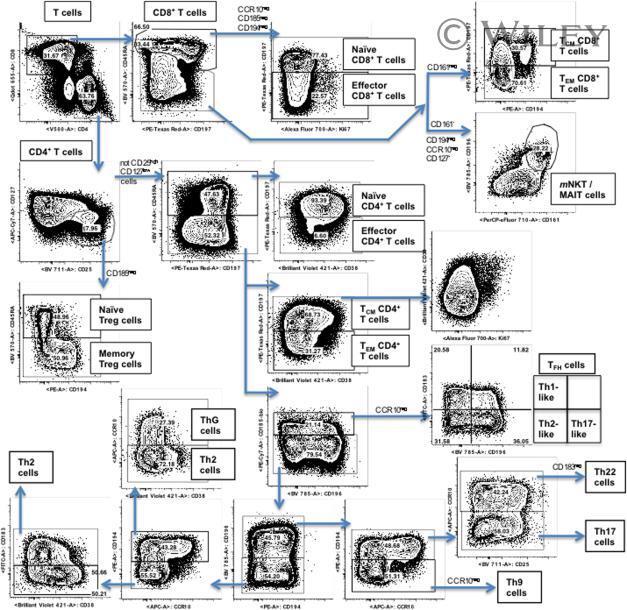
- Example staining and gating. Cryopreserved PBMCs from healthy human donors were thawed, rested over night, and stained as outlined in the online protocol. The gating strategy for the identification of T cell subsets is shown.
- Submitted by
- Invitrogen Antibodies (provider)
- Main image
- Experimental details
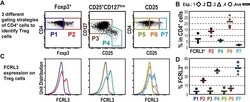
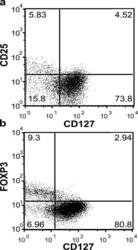
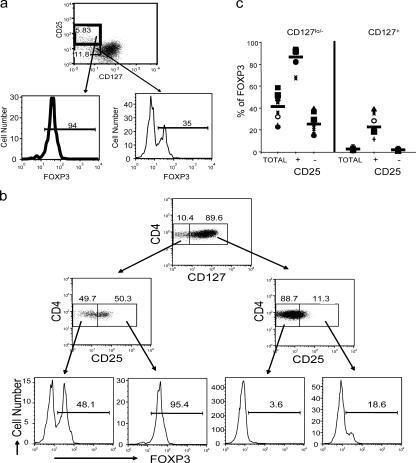
- Figure 2. Expression of FoxP3 on different CD4 + CD127 +/- human T cell subsets. (a) PBMCs were harvested from human peripheral blood and stained with CD4, CD25, CD127 as well as intracellularly with FoxP3-specific mAbs, then analyzed on a Becton-Dickinson FACSCalibur. (b) Human PBMCs were stained for cell surface expression of CD4 and CD127. The stained cells were fixed and stained intracellularly for FoxP3. For analysis, the PBMCs were gated on lymphocytes (based on forward and side light scatter) and analyzed for CD127 and FoxP3 expression. The numbers in the dot plot indicate the percentage of gated cells expressing the relevant marker. Data are representative of >20 independent individuals and >10 experiments.

- Submitted by
- Invitrogen Antibodies (provider)
- Main image
- Experimental details
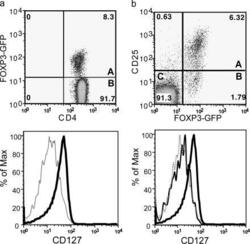
- Figure 3. Expression of FoxP3 on different CD4 + CD127 +/- mouse T cell subsets. Mouse spleen and lymph node cells were stained for cell surface expression of CD4 and CD127. For analysis, the spleen cells from FoxP3-GFP mice were gated on lymphocytes (based on forward and side light scatter) and analyzed for CD127 and FoxP3 (GFP) expression. The numbers in the dot plot indicate the percentage of gated cells expressing the relevant marker. The letters A and B in the quadrants represent the gray and thick solid lines (bottom). (b) Spleen and lymph node cells isolated from FoxP3 transgenic mice were stained for cell surface expression of CD4, CD25, and CD127. For analysis, the spleen cells were gated on CD4 + lymphocytes (based on forward and side light scatter) and analyzed for CD127 and FoxP3 expression. The numbers in the dot plot indicate the percentage of gated cells expressing the relevant marker. The letters A, B, and C in the quadrants represent the dotted, thin solid, and thick solid lines (bottom).

- Submitted by
- Invitrogen Antibodies (provider)
- Main image
- Experimental details
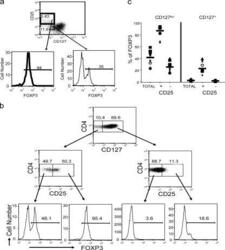
- Figure 4. Expression of FoxP3 on different CD4 + T cell subsets. (a) Human PBMCs were stained for cell surface expression of CD4, CD25, and CD127. The stained cells were fixed and stained intracellularly for FoxP3. For analysis, the PBMCs were gated on CD4 + lymphocytes (based on forward and side light scatter and CD4 staining) and analyzed for CD127 and FoxP3 expression. The boxes represent arbitrary designations of CD25 + versus CD25 - cells. The numbers in the histograms indicate the percentage of gated cells expressing the relevant marker. (b) Human PBMCs were stained for cell surface expression of CD4, CD25, and CD127. The stained cells were fixed and stained intracellularly for FoxP3. For analysis, the PBMCs were gated on lymphocytes (based on forward and side light scatter) and analyzed for CD4, CD25, CD127, and FoxP3 expression. The boxes represent arbitrary designations of CD127 + versus CD127 lo/- cells. The numbers in the dot plot indicate the percentage of gated cells expressing the relevant marker. (c) Similar staining and analysis was performed on whole blood obtained from 10 healthy individuals. Each symbol represents an individual person and the narrow bar represents the mean percentage of FoxP3 + T cells on either CD4 + T cells gated based on CD25 and/or CD127 expression.
- Submitted by
- Invitrogen Antibodies (provider)
- Main image

- Experimental details
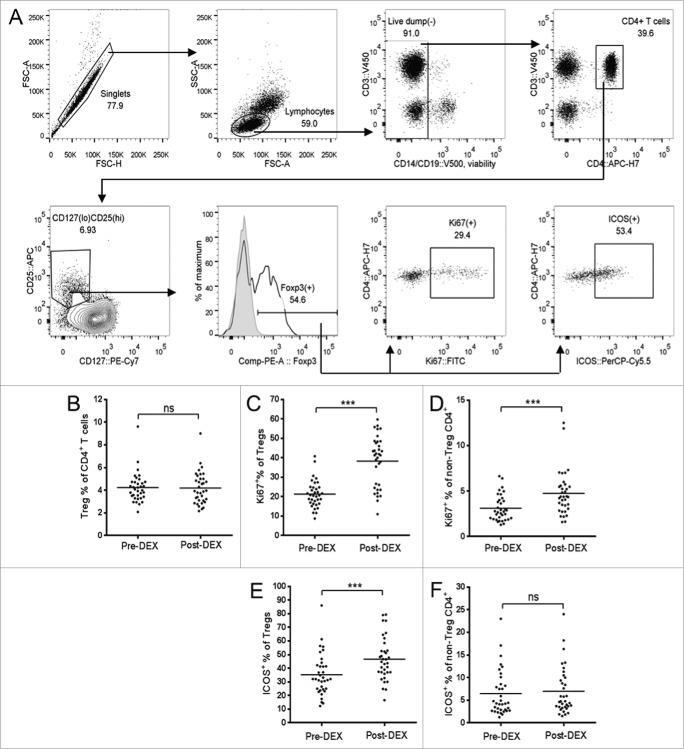
- Figure 3. Dex treatment increases the proliferation and activation state of Tregs. (A) Representative flow cytometry data, demonstrating the gating strategy used for Treg identification and analysis. Forward scatter (FSC) area vs. FSC-height was used for doublet discrimination, and lymphocytes subsequently selected by FSC vs. side scatter. A ""dump"" channel was used to gate out dead cells (LIVE/DEAD fixable aqua viability stain), CD14 + , CD56 + , and CD19 + cells. CD4 + T cells were subsequently selected on the basis of CD4 vs. CD3 staining, followed by the identification of Tregs as CD25 hi , CD127 lo , and Foxp3 + . Tregs, or non-Treg CD4 + T cells, were further gated for expression of Ki67 and ICOS. (B-F) Analysis of Tregs in patient PBMC samples collected before (pre-Dex) and after (post-Dex) administration of Dex. (B) Percentage of Tregs (CD25 + CD127 lo Foxp3 + ) as a proportion of total CD4 + T cells in PBMC samples. (C-D) Proportion of Tregs (C) and non-Treg CD4 + lymphocytes (D) expressing the proliferation marker Ki67. (E-F) Changes in proportional expression of the activation marker ICOS, in Treg (E) and non-Treg CD4 + lymphocytes (F). Each dot represents an individual patient; significant difference between pre-Dex and post-Dex values: *** p < 0.0001, paired students t-test.
- Submitted by
- Invitrogen Antibodies (provider)
- Main image
- Experimental details
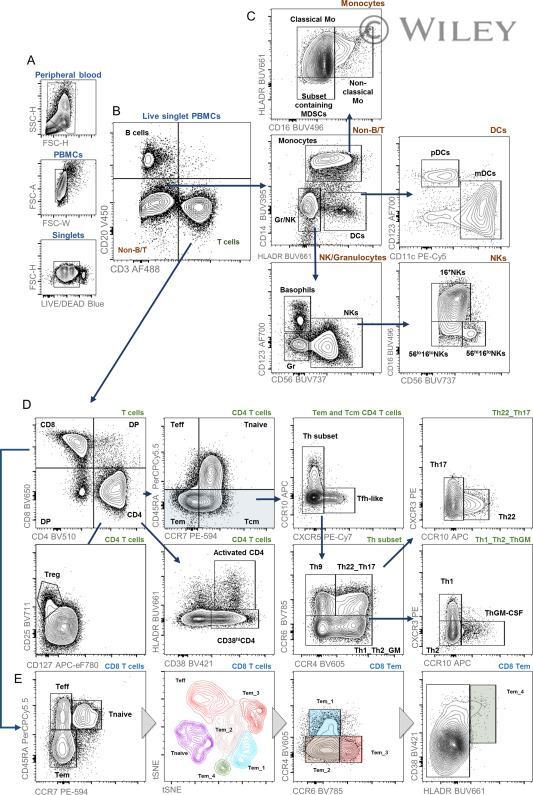
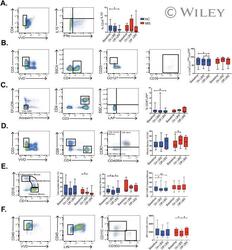
- Example gating strategy for major immune cell subsets on stained PBMCs from healthy donors. [Color figure can be viewed at wileyonlinelibrary.com ]
- Submitted by
- Invitrogen Antibodies (provider)
- Main image
- Experimental details
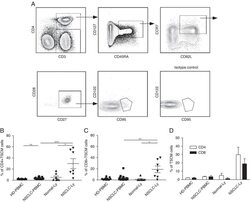
- FIGURE 1 Identification of Tscm CD4 + CD45RA + CD45RO - CD62L + CCR7 + CD127 + CD27 + CD28 + CD95 + CD122 + T (Tscm) cell in human blood and lymph nodes. PBMCs were isolated from the blood of non-small cell lung cancer (NSCLC) patients (n=15) (NSCLC-PBMC) and healthy donors (n=11) (HD-PBMC); lymphocytes were isolated from the tumor-infiltrated lymph node of NSCLC patients who were collected blood at same time (n=7) (NSCLC-Ly); lymphocytes were isolated from the healthy lymph node of non lung cancer patients (n=7) (Normal-Ly), analyzed by flow cytometry. A, Representative flow cytometric analyses of CD4 + CD45RA + CD45RO - CD62L + CCR7 + CD127 + CD27 + CD28 + CD95 + CD122 + T cells, indicating Tscm cells. B, The frequency of the CD4 + Tscm cells in the HD-PBMC, NSCLC-PBMC, Normal-Ly, NSCLC-Ly. The events of CD4 + Tscm cells in the blood and lymph node from NSCLC patients and healthy donors, expressed as the mean+-SEM. C, The frequency of the CD8 + Tscm cells in the HD-PBMC, NSCLC-PBMC, Normal-Ly, NSCLC-Ly, expressed as the mean+-SEM. D, The events of Tscm of CD4 + and CD8 + cells in the blood and the lymph node from NSCLC patients and healthy donors. HD indicates healthy donors; IFN, interferon; PBMC, peripheral blood mononuclear cells; Tscm cell, stem cell-like memory T cell. * P
- Submitted by
- Invitrogen Antibodies (provider)
- Main image
- Experimental details
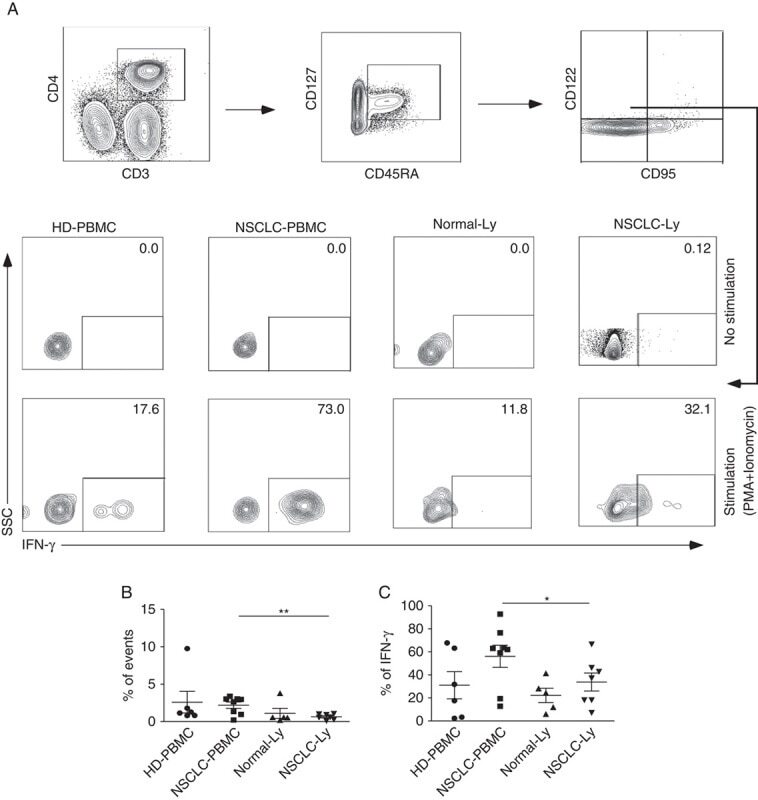
- FIGURE 3 CD4 + CD45RA + CD45RO - CD95 - CD122 + CD127 + T cell population displays different phenotypes in human blood and lymph nodes. A, Flow cytometry plots showing IFN-gamma expression in the CD4 + CD45RA + /CD45RO - CD95 - CD122 + CD127 + T cells from the blood and lymph node of the non-small cell lung cancer (NSCLC) patients and healthy donors. B, The mean frequency (+-SEM) of the events of CD4 + CD45RA + /CD45RO - CD95 - CD122 + CD127 + T cells. C, The mean IFN-gamma production (+-SEM) of the CD4 + CD45RA + /CD45RO - CD95 - CD122 + CD127 + T cells. HD indicates healthy donors; IFN, interferon; PBMC, peripheral blood mononuclear cells; PMA, phorbol 12-myristate13-acetate. * P
- Submitted by
- Invitrogen Antibodies (provider)
- Main image
- Experimental details
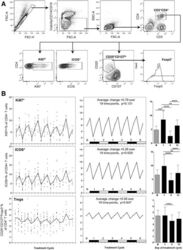
- Fig. 6 a Representative flow cytometry data, demonstrating the gating strategy used on PBMC for Treg identification and analysis. FSC-area vs. FSC-height was used for doublet discrimination. A ""dump"" channel was used to gate out dead cells (LIVE/DEAD fixable viability stain), CD14 + monocytes and CD19 + B cells, and lymphocytes were subsequently selected by FSC vs. SSC. CD4 + T cells were gated on the basis of CD4 vs. CD3 staining, then examined for expression of Ki67 and ICOS. Tregs were identified within the CD4 + T cell population as CD25 hi CD127 lo and Foxp3 + . b Longitudinal empirical data, linear mixed models and estimated means (left, centre and right-hand panels respectively) for Ki67+ and ICOS+ expression on CD4+ T cells, and the Treg proportion of CD4 cells ( P -values: *

- Submitted by
- Invitrogen Antibodies (provider)
- Main image
- Experimental details
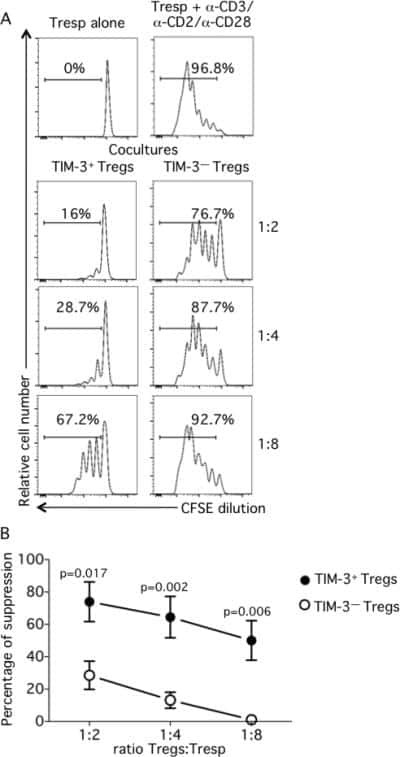
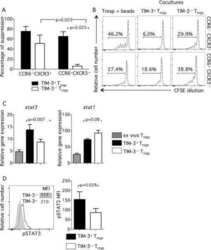
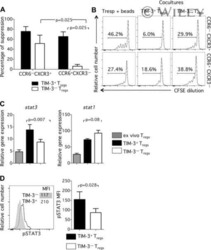
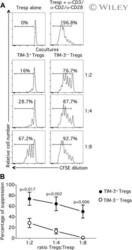
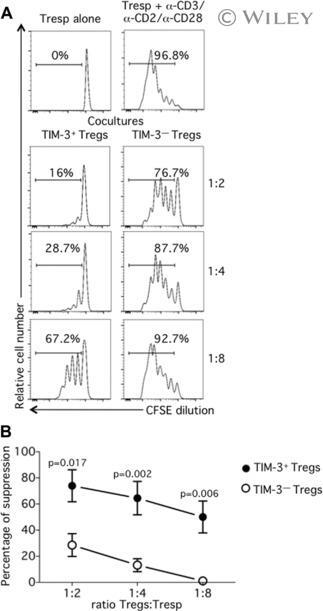
- TIM-3 + Treg cells suppress Tresp-cell proliferation better than TIM-3 - Treg cells. CD4 + T cells were stained and sorted into Treg cells (CD4 + CD25 high CD127 low/- ) by flow cytometry and activated with anti-CD3/anti-CD28 for 3 days. Then, TIM-3 + and TIM-3 - Treg cells were resorted by flow cytometry and Tresp cells (CD4 + CD25 low/- CD127 + ) were sorted in parallel. CFSE-labeled Tresp cells were cocultured with TIM-3 + or TIM-3 - Treg cells at various Treg:Tresp ratios ranging from 1:2 to 1:8. At day 3, cells were collected, stained for viability and fixed. (A) Proliferation of unstimulated (upper left panel) or stimulated (upper right panel) Tresp cells alone and Tresp-cell cocultures with TIM-3 + or TIM-3 - Treg cells (lower panels left and right respectively) was determined by flow cytometry. One representative experiment of four independent experiments is shown. (B) Percentage of suppression was calculated from results obtained as in (A), per the following formula: % suppression = [1 - (proliferation of Tresp cells in coculture / Tresp cells alone)] x 100. Data are shown as mean +- SEM of eight samples pooled from four independent experiments. Statistical significance determined by a two-tailed standard t -test.
- Submitted by
- Invitrogen Antibodies (provider)
- Main image
- Experimental details
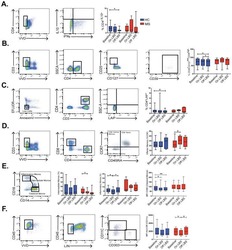
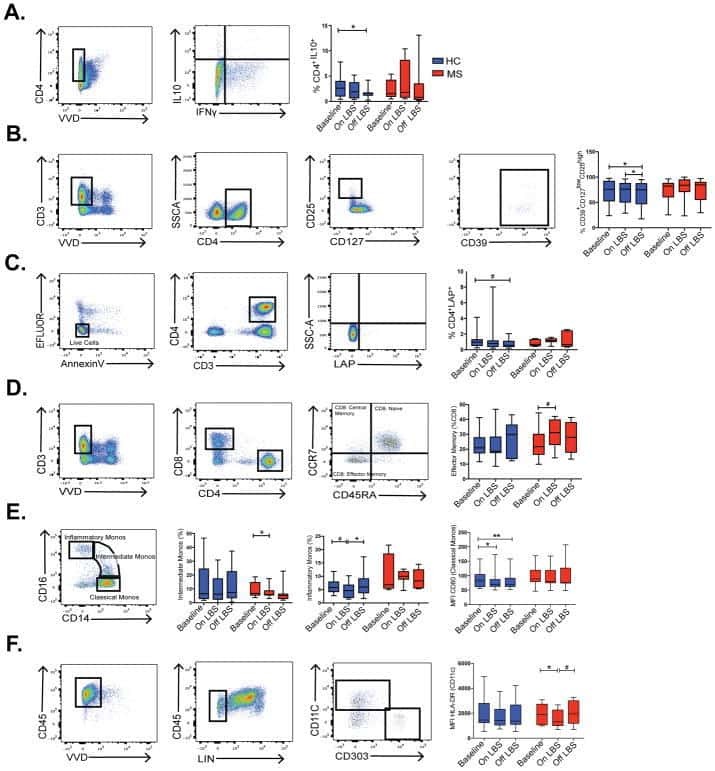
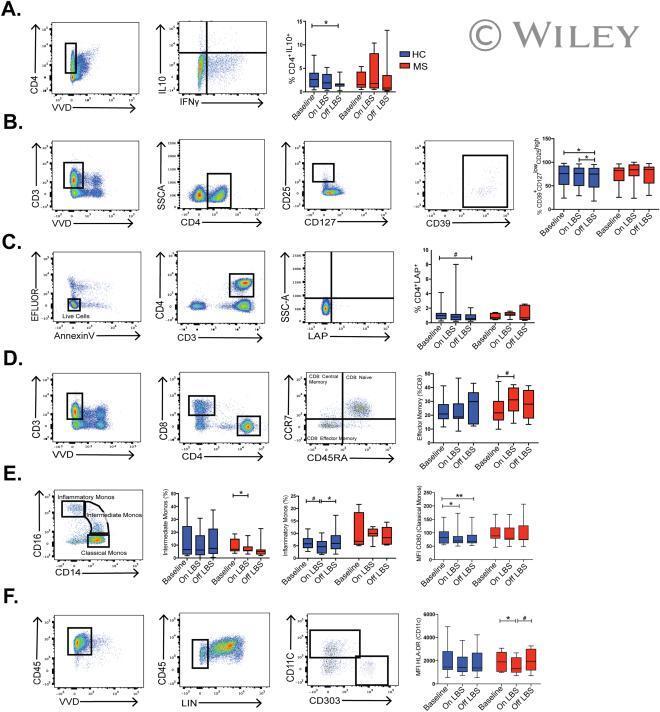
- LBS effect on immune cells profile. Fluorescent-activated cell sorting (FACS) analysis was used to compare frequencies of (A-D) CD4 + IL-10 + T cells, CD39 + CD127 low CD25 high T cells, CD4 + LAP + T cells, and effector memory CD8 T cells in healthy controls (HC) and multiple sclerosis patients (MS) at the indicated time points determined by Wilcoxon signed-rank test. * p < 0.05; # p < 0.1. FACS analysis was used to compare (E,F) frequencies of intermediate monocytes, inflammatory monocytes, as well as CD80 mean fluorescence intensity (MFI) on classical monocytes and HLA-DR MFI on dendritic cells in HC and MS patients at the indicated time points determined by Wilcoxon signed-rank test, * p < 0.05; ** p < 0.01; # p < 0.1. The following markers were used for the lineage pool: CD3, CD14, CD16, CD19, CD20, and CD56. HLA-DR = human leukocyte antigen D related.
- Submitted by
- Invitrogen Antibodies (provider)
- Main image
- Experimental details
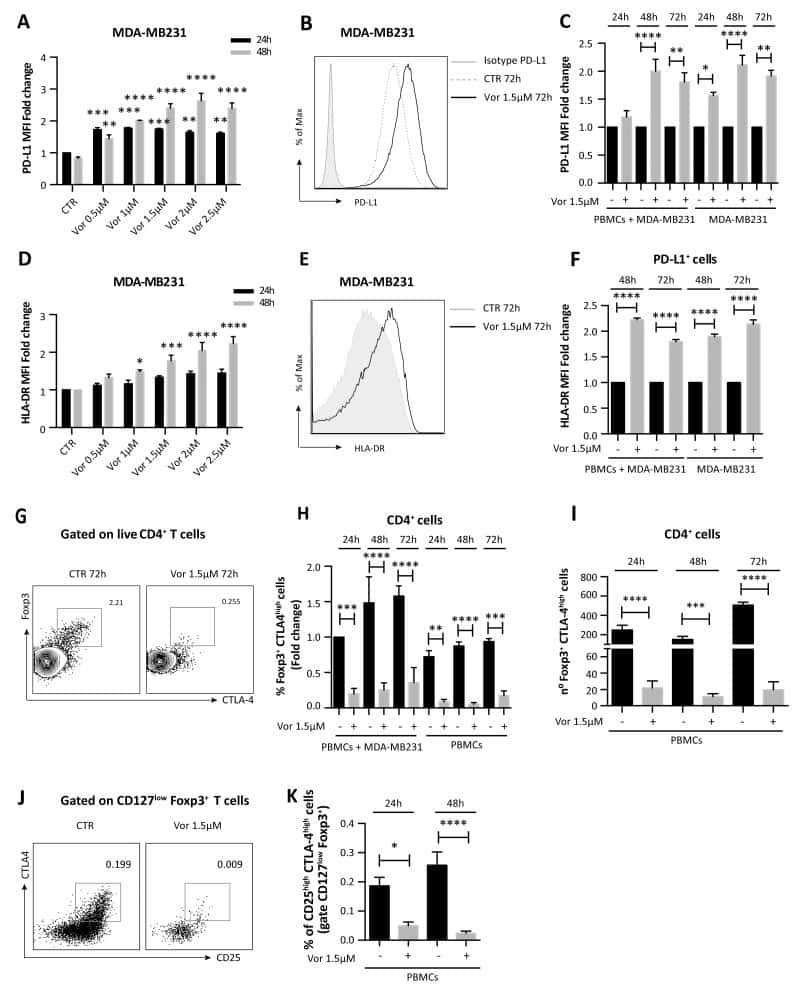
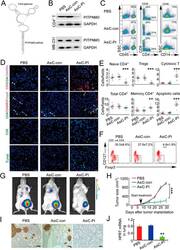
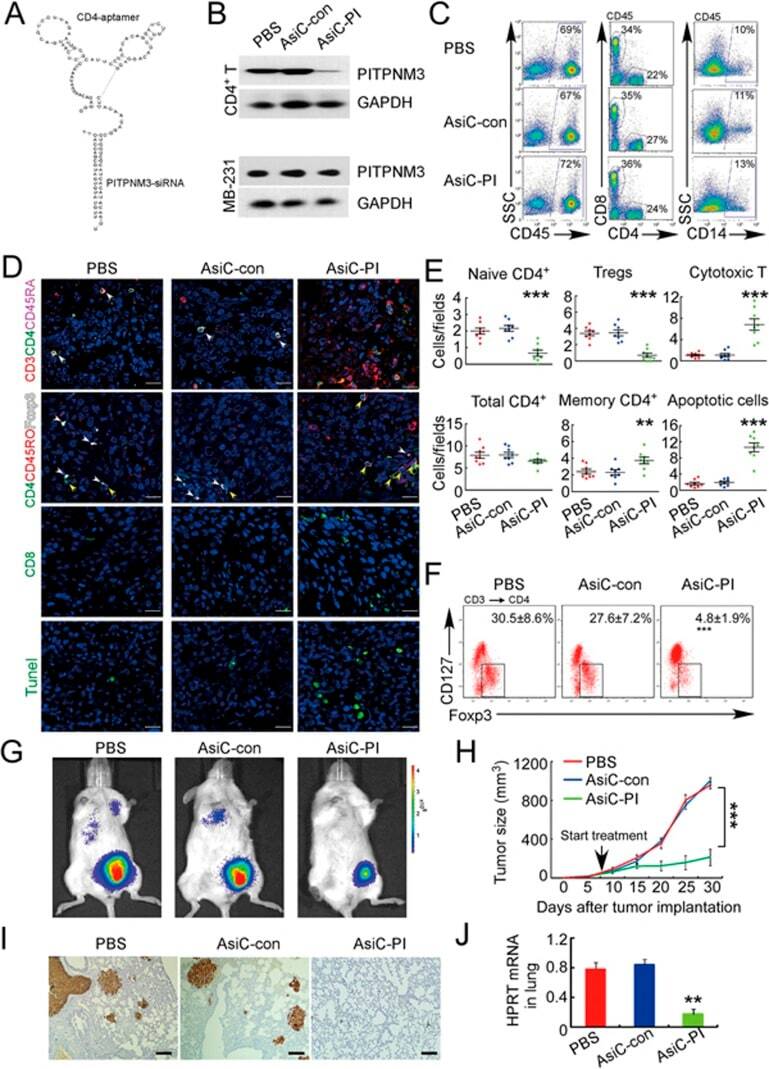
- Figure 6 In vivo knockdown of PITPNM3 in CD4 + T cells reverses immunosuppression and inhibits tumor progression in humanized mice. (A) Humanized mice bearing palpable MDA-MB-231 orthotopic xenografts were intraperitoneally injected daily for 14 days with PBS, 1 nmol CD4-aptamer-control siRNA (AsiC-con) or CD4-aptamer-siRNA targeting PITPNM3 (sequence in A , AsiC-PI) to assess the role of PITPNM3 in TI Tregs, and other T cells and tumor control. Experimental schematic is provided in Supplementary information, Figure S9A . (B) Representative immunoblots showing selective knockdown of PITPNM3 protein in PB CD4 + T cells, but not tumor xenografts ( n = 3). (C) PITPNM3 knockdown did not affect the distribution of human CD45 + hematopoietic cells, CD4 + and CD8 + T cells, and CD14 + monocytes in the peripheral blood of humanized mice. Representative flow plots are shown ( n = 3). (D , E) Effect of PITPNM3 knockdown on TI naive CD4 + , Tregs and CD8 + T cell numbers, and apoptosis by TUNEL assay in xenografts. D shows representative immunofluorescence microscopy images. Top row indicates CD4 + naive T cells by arrows; the second row indicates CD4 + CD45RO + Foxp3 - CD4 + memory T cells (yellow arrows) and Foxp3 + Tregs (white arrows). Scale bar, 50 mum. E shows number of cells of each subtype/high power field in eight mice ( ** P < 0.01, *** P < 0.001 compared to PBS group by Student's t -test). (F) Flow cytometry analysis of gated human CD3 + CD4 + cells isolated from xenogra
- Submitted by
- Invitrogen Antibodies (provider)
- Main image
- Experimental details
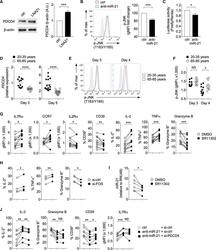
- Figure 4. miR-21 Promotes Effector Cell Differentiation through AP-1 Activation (A) Naive CD4 + T cells were transfected with either scrambled control or miR-21-blocking locked nucleic acid (LNA21). After 48 hr, PDCD4 and b-actin expression were assessed by western blot. Representative blots and mean normalized intensities from four experiments are shown (mean +- SEM, two-tailed paired t test). (B) Naive CD4 + T cells were activated with anti-CD3 and anti-CD28 beads and transduced with a lentiviral vector expressing scrambled control or anti-miR-21. The representative histogram shows phosphorylated JNK in GFP + cells on day 3. The filled gray histogram represents unstimulated naive CD4 + T cells. Results from 7 experiments are expressed relative to the geometric mean fluorescence intensity (MFI) of controls (mean +- SEM, two-tailed paired t test). (C) Naive CD4 + T cells were activated and transduced as described in (B) and co-transfected with the AP-1 luciferase reporter plasmid and the Renilla luciferase control construct. On day 3, the activity of AP-1 firefly luciferase was measured and normalized to that of Renilla luciferase (n = 4, mean +- SEM, two-tailed paired t test). (D-F) Naive CD4 + T cells isolated from 20- to 35-year-old and 65- to 85-year-old individuals were activated with beads coated with anti-CD3 and anti-CD28 antibodies. (D) PDCD4 expression was quantified by RT-PCR on day 3 and day 5. Results are normalized to ACTB and presented relative to those of cell