Explore
 Validate
 Learn
Learn Western blot
 Immunocytochemistry
Antibody data
- Antibody Data
- Antigen structure
- References [8]
- Comments [0]
- Validations
- Immunocytochemistry [3]
- Immunohistochemistry [1]
- Other assay [8]
Submit
Validation data
Reference
Comment
Report error
- Product number
- PA5-35382 - Provider product page

- Provider
- Invitrogen Antibodies
- Product name
- Adenylate Cyclase 3 Polyclonal Antibody
- Antibody type
- Polyclonal
- Antigen
- Synthetic peptide
- Description
- This antibody contains enough material to conduct 10 mini-Western blots.
- Reactivity
- Human, Mouse, Rat
- Host
- Rabbit
- Isotype
- IgG
- Vial size
- 100 μL
- Concentration
- 1 mg/mL
- Storage
- -20°C, Avoid Freeze/Thaw Cycles
Submitted references Agonists of prostaglandin E(2) receptors as potential first in class treatment for nephronophthisis and related ciliopathies.
Palmitic acid control of ciliogenesis modulates insulin signaling in hypothalamic neurons through an autophagy-dependent mechanism.
The role of ciliopathy-associated type 3 adenylyl cyclase in infanticidal behavior in virgin adult male mice.
Ciliary Type III Adenylyl Cyclase in the VMH Is Crucial for High-Fat Diet-Induced Obesity Mediated by Autophagy.
Primary cilia and SHH signaling impairments in human and mouse models of Parkinson's disease.
Chemokine CCL5 promotes robust optic nerve regeneration and mediates many of the effects of CNTF gene therapy.
Sequential Maturation of Olfactory Sensory Neurons in the Mature Olfactory Epithelium.
Elevating Growth Factor Responsiveness and Axon Regeneration by Modulating Presynaptic Inputs.
Garcia H, Serafin AS, Silbermann F, Porée E, Viau A, Mahaut C, Billot K, Birgy É, Garfa-Traore M, Roy S, Ceccarelli S, Mehraz M, Rodriguez PC, Deleglise B, Furio L, Jabot-Hanin F, Cagnard N, Del Nery E, Fila M, Sin-Monnot S, Antignac C, Lyonnet S, Krug P, Salomon R, Annereau JP, Benmerah A, Delous M, Briseño-Roa L, Saunier S
Proceedings of the National Academy of Sciences of the United States of America 2022 May 3;119(18):e2115960119
Proceedings of the National Academy of Sciences of the United States of America 2022 May 3;119(18):e2115960119
Palmitic acid control of ciliogenesis modulates insulin signaling in hypothalamic neurons through an autophagy-dependent mechanism.
Ávalos Y, Hernández-Cáceres MP, Lagos P, Pinto-Nuñez D, Rivera P, Burgos P, Díaz-Castro F, Joy-Immediato M, Venegas-Zamora L, Lopez-Gallardo E, Kretschmar C, Batista-Gonzalez A, Cifuentes-Araneda F, Toledo-Valenzuela L, Rodriguez-Peña M, Espinoza-Caicedo J, Perez-Leighton C, Bertocchi C, Cerda M, Troncoso R, Parra V, Budini M, Burgos PV, Criollo A, Morselli E
Cell death & disease 2022 Jul 28;13(7):659
Cell death & disease 2022 Jul 28;13(7):659
The role of ciliopathy-associated type 3 adenylyl cyclase in infanticidal behavior in virgin adult male mice.
Wu X, Yang D, Zhou Y, Li S, Wang Z
iScience 2022 Jul 15;25(7):104534
iScience 2022 Jul 15;25(7):104534
Ciliary Type III Adenylyl Cyclase in the VMH Is Crucial for High-Fat Diet-Induced Obesity Mediated by Autophagy.
Yang D, Wu X, Wang W, Zhou Y, Wang Z
Advanced science (Weinheim, Baden-Wurttemberg, Germany) 2022 Jan;9(3):e2102568
Advanced science (Weinheim, Baden-Wurttemberg, Germany) 2022 Jan;9(3):e2102568
Primary cilia and SHH signaling impairments in human and mouse models of Parkinson's disease.
Schmidt S, Luecken MD, Trümbach D, Hembach S, Niedermeier KM, Wenck N, Pflügler K, Stautner C, Böttcher A, Lickert H, Ramirez-Suastegui C, Ahmad R, Ziller MJ, Fitzgerald JC, Ruf V, van de Berg WDJ, Jonker AJ, Gasser T, Winner B, Winkler J, Vogt Weisenhorn DM, Giesert F, Theis FJ, Wurst W
Nature communications 2022 Aug 16;13(1):4819
Nature communications 2022 Aug 16;13(1):4819
Chemokine CCL5 promotes robust optic nerve regeneration and mediates many of the effects of CNTF gene therapy.
Xie L, Yin Y, Benowitz L
Proceedings of the National Academy of Sciences of the United States of America 2021 Mar 2;118(9)
Proceedings of the National Academy of Sciences of the United States of America 2021 Mar 2;118(9)
Sequential Maturation of Olfactory Sensory Neurons in the Mature Olfactory Epithelium.
Liberia T, Martin-Lopez E, Meller SJ, Greer CA
eNeuro 2019 Sep Oct;6(5)
eNeuro 2019 Sep Oct;6(5)
Elevating Growth Factor Responsiveness and Axon Regeneration by Modulating Presynaptic Inputs.
Zhang Y, Williams PR, Jacobi A, Wang C, Goel A, Hirano AA, Brecha NC, Kerschensteiner D, He Z
Neuron 2019 Jul 3;103(1):39-51.e5
Neuron 2019 Jul 3;103(1):39-51.e5
No comments: Submit comment
Supportive validation
- Submitted by
- Invitrogen Antibodies (provider)
- Main image

- Experimental details
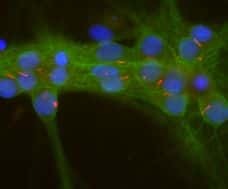
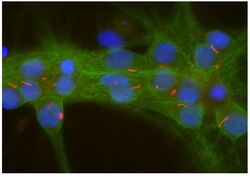
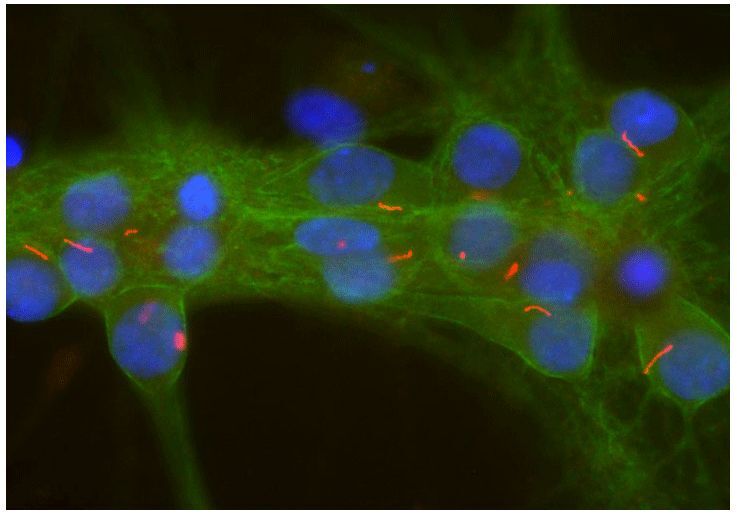
- Immunofluorescent analysis of Adenylate Cyclase III in cultured rat neurons and glia using an Adenylate Cyclase III polyclonal antibody (Product # PA5-35382) showing strong staining of neuronal cilia (red) and axonal and dendritic staining of Alpha II Spectrin (Product # MA5-18118) (green) revealing the submembraneous cytoskeleton and DNA (blue).
- Submitted by
- Invitrogen Antibodies (provider)
- Main image

- Experimental details
- Immunocytochemistry analysis of Adenylate Cyclase 3 in cultured rat neurons and glia showing strong staining of neuronal cilia using Adenylate Cyclase 3 polyclonal antibody (Product # PA5-35382) using a dilution of 1:500 (red). Axonal and dendritic staining of alpha II Spectrin monoclonal antibody (Product # MA5-18118) using a dilution of 1:500 (green) revealing the submembranous cytoskeleton and DNA (blue).

- Submitted by
- Invitrogen Antibodies (provider)
- Main image
- Experimental details
- Immunocytochemistry analysis of Adenylate Cyclase 3 in cultured rat neurons and glia showing strong staining of neuronal cilia using Adenylate Cyclase 3 polyclonal antibody (Product # PA5-35382) using a dilution of 1:500 (red). Axonal and dendritic staining of alpha II Spectrin monoclonal antibody (Product # MA5-18118) using a dilution of 1:500 (green) revealing the submembranous cytoskeleton and DNA (blue).
Supportive validation
- Submitted by
- Invitrogen Antibodies (provider)
- Main image
- Experimental details
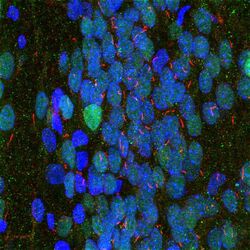
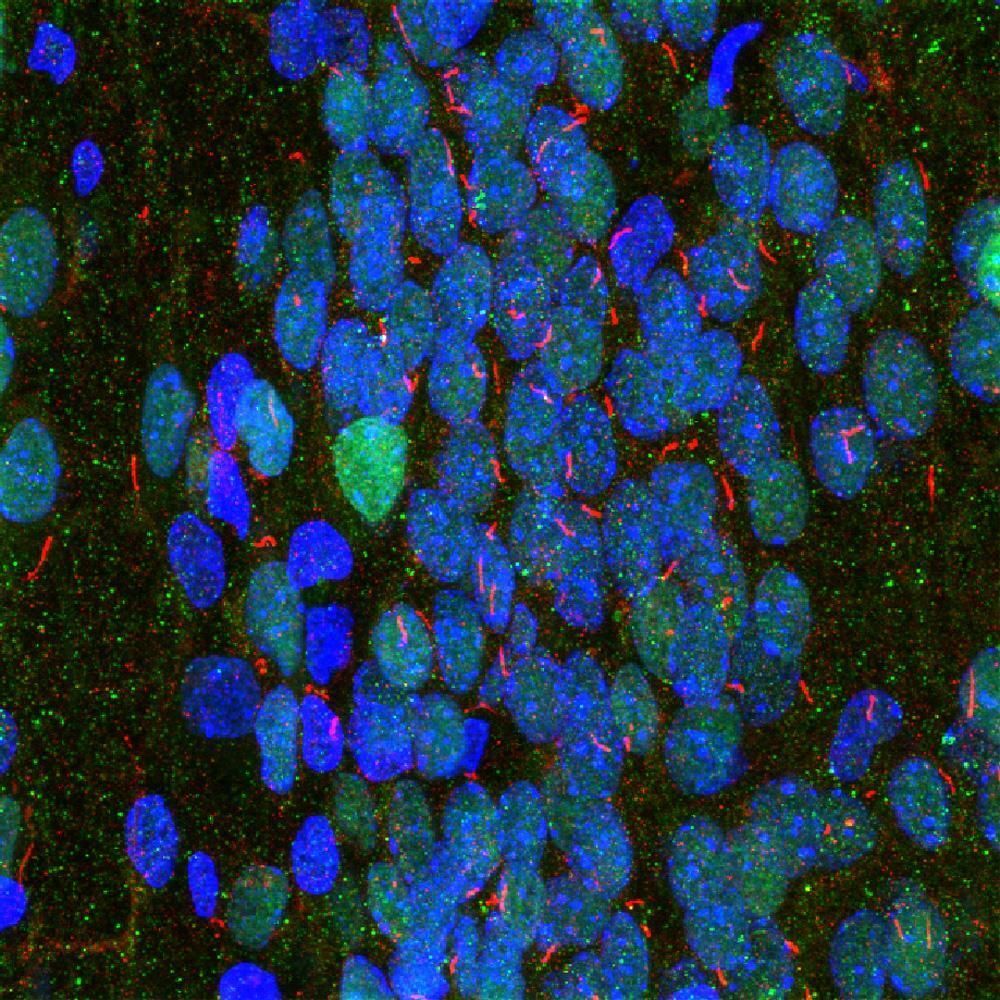
- Immunohistochemistry analysis of Adenylate Cyclase 3 in rat hippocampus. Selectively labeling the neuronal cilia with Adenylate Cyclase 3 polyclonal antibody (Product # PA5-35382) using a dilution of 1:10,000 (red), labeling nuclei with MECP2 monoclonal antibody (Product # MA5-33096) using a dilution of 1:1,000 (green), and Hoechst staining of nuclear DNA.
Supportive validation
- Submitted by
- Invitrogen Antibodies (provider)
- Main image
- Experimental details
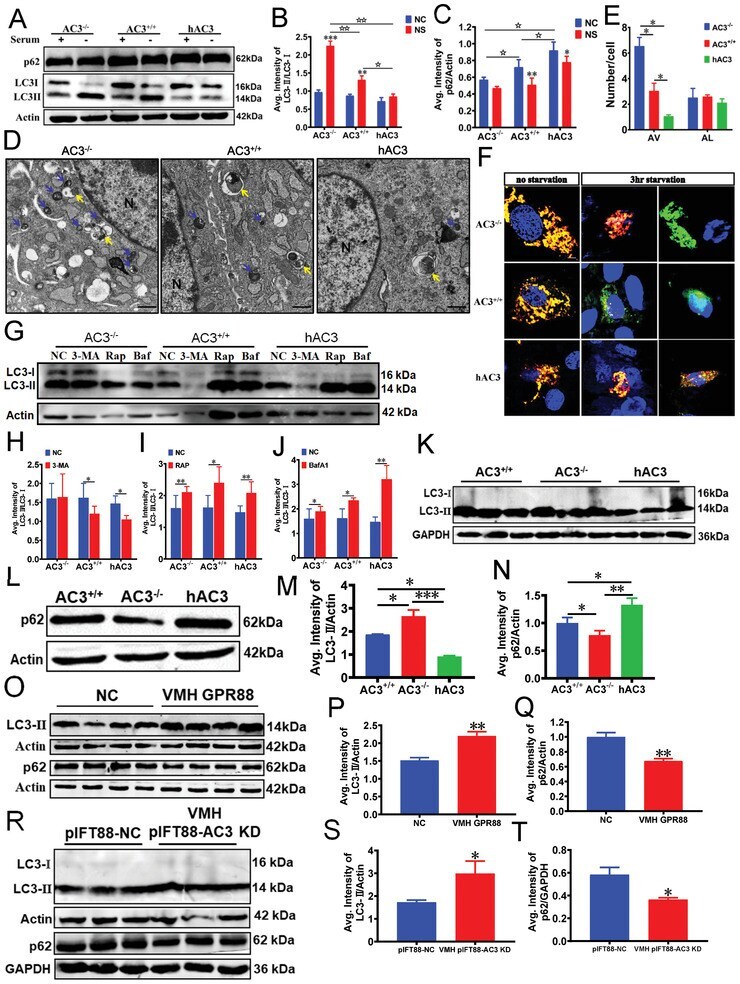
- Figure 5 Autophagy is regulated by ciliary AC3 in MEFs and the VMH. A-C) WB (A) and densitometric quantification of the expression of LC3 (B) and p62 (C) in AC3 +/+ , AC3 -/- , and hAC3 MEFs with or without serum addition ( n = 3 repetitions per group). Actin served as the loading control. D) Ultrastructural images of autophagic vacuoles (AV) and autolysosomes (AL) in AC3 +/+ , AC3 -/- , and hAC3 MEFs were obtained by TEM. The blue arrow indicates AV. The yellow arrow indicates AL. N represents the nucleus. Scale bars: 2 um. E) The numbers of autophagic vacuoles (AV) and autolysosomes (AL) in AC3 +/+ , AC3 -/- , and hAC3 MEFs ( n = 3 repetitions per group). F) Live-cell imaging of AC3 +/+ , AC3 -/- , and hAC3 MEFs transduced with the tandem mRFP-GFP-LC3 plasmid under treatment without serum or with 100 x 10 -9 m bafilomycin A 1 treatment. Blue, nuclei; green, GFP; red, REP. Scale bars: 5 um. G-J) WB (G) and densitometric quantification of the expression of LC3 in AC3 +/+ , AC3 -/- , and hAC3 MEFs treated with 3-MA (H), rapamycin (I), and bafilomycin A 1 (J, n = 3 repetitions per group). GAPDH served as loading controls. K-N) WB and densitometric quantification of the expression of LC3 (K, M) and p62 (L, N) in the hypothalami of AC3 +/+ , AC3 -/- , and hAC3 mice ( n = 3 repetitions per group). Actin and GAPDH served as loading controls. O-Q) WB (O) and densitometric quantification of the expression of LC3 (P) and p62 (Q) in the hypothalami of VMH AAV GPR88* mice and the contro
- Submitted by
- Invitrogen Antibodies (provider)
- Main image
- Experimental details
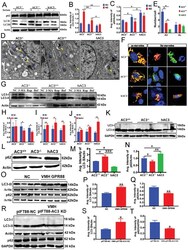
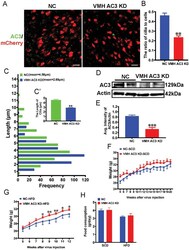
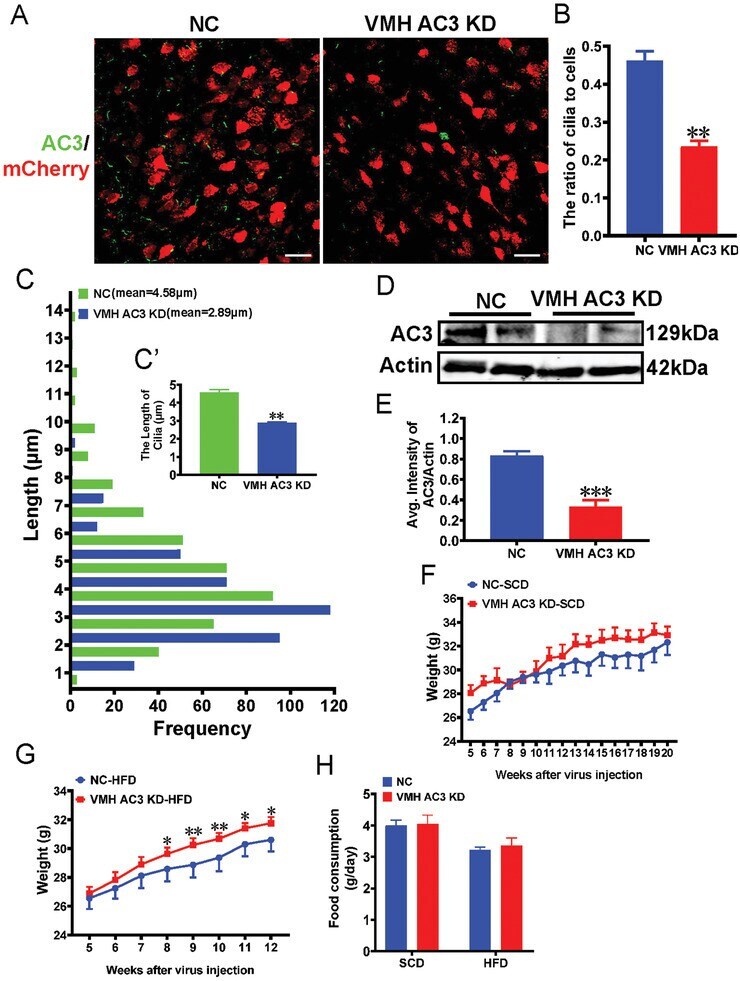
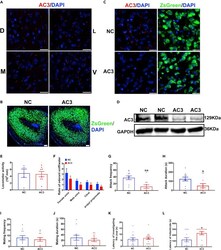
- Figure 2 VMH AC3 KD mice exhibit increased susceptibility to HFD-induced obesity. A) Representative images showing the expression of AC3 in the VMHs of VMH AC3 KD mice and the controls. Scale bar: 20 um. B) Quantification of the number of cilia in the VMHs of VMH AC3 KD mice and controls ( n = 3 mice per group). C) Quantification of the length of cilia in the VMHs of VMH AC3 KD mice and controls ( n = 3 mice per group). D, E) Western blot (WB) (D) and densitometric quantification (E) of AC3 expression in the hypothalami of VMH AC3 KD mice and the controls. Actin served as a loading control ( n = 3 mice per group). F, G) The growth curves of NC and VMH AC3 KD mice starting at 5 weeks after virus injection under SCD feeding (F) and HFD feeding (G) conditions ( n = 12 mice per group). H) Twenty-four hours of food consumption in the VMH AC3 KD mice and controls ( n = 12 mice per group). Data represent the mean +- SEM; * p < 0.05, ** p < 0.01, and *** p < 0.001; Student's t -test or one-way ANOVA and Bonferroni pairwise comparisons.
- Submitted by
- Invitrogen Antibodies (provider)
- Main image
- Experimental details
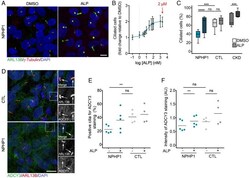
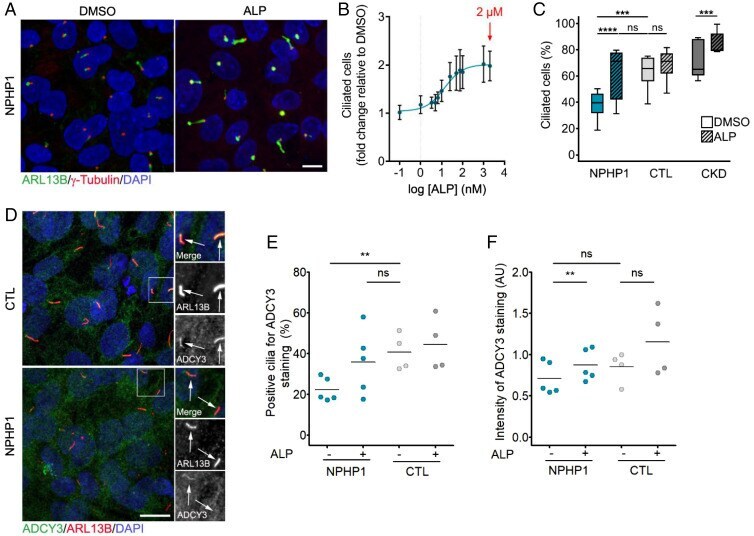
- Fig. 2. Validation of prostaglandin signaling as a target in NPHP1 -defective renal cells. ( A ) Representative images of immunofluorescence of primary cilia (ARL13B, green), basal bodies (gamma-Tubulin, red), and nuclei (DAPI, blue) in NPHP1 URECs 5 d after seeding treated for 2 d with DMSO (0.04%) or ALP (2 uM). (Scale bars, 10 uM.) ( B ) Quantification of ciliogenesis in one NPHP1 UREC (Pt1) exposed for 2 d to increasing concentrations of ALP. Mean +- SEM n = 2 to 4 experiments. Nonlinear regression. ( C ) Quantification of ciliogenesis in URECs derived from NPHP1 patients (NPHP1, n = 11), CTL individuals ( n = 6), and CKD patients ( n = 5) exposed for 2 d to DMSO (0.04%) and ALP (2 uM). Results are expressed as the mean for all individual categories and are shown using a box-and-whisker plot. n = 1 to 15 experiments per cell line (mean of 3.5 experiments per cell line). Mixed linear-regression model with quasibinomial penalization taking into account the correlation of observations coming from the same individuals using a random effect on the cell line: *** P < 0.001, **** P < 0.0001, ns: not significant. ( D ) Representative images of immunofluorescence of ADCY3 (green), primary cilia (ARL13B, red), and nuclei (DAPI, blue) in NPHP1 and CTL URECs. Arrows indicate ARL13B + cilia. (Scale bars, 10 uM.) ( E and F ) Quantification of the percentage of ADCY3 + cilia ( E ) and of the intensity of ADCY3 in those cilia ( F ) in NPHP1 ( n = 5) and CTL ( n = 4) URECs 5 d after seedi
- Submitted by
- Invitrogen Antibodies (provider)
- Main image
- Experimental details
- Figure 4 AC3 in the AON is crucial for infanticidal behavior in adult virgin male mice (A) IF analysis of AC3 in the AON of WT male mice. Scale bars, 20 mum. (B) AAV infection efficiency in the AON. Scale bars, 100 mum. (C) IF analysis of AC3 in the AON-specific AC3-KD mice and NC mice. Scale bars, 20 mum. (D) WB analysis showing AC3 protein expression in the AON of AON-specific AC3-KD mice and NC mice. GAPDH served as a loading control. (E) The spontaneous locomotor activity of AON-specific AC3-KD mice was similar to that of the NC mice (NC group: n = 5 mice, AC3-KD group: n = 8 mice). (F) Ratio of odorant sniffs to water sniffs exhibited by the AON-specific AC3-KD mice and NC mice in the odorant habituation/dishabituation assay. The odorants included male mouse urine (1:50), female mouse urine (1:50), citral (50 muM), and propyl propionate (50 muM) (n = 17 mice per group). (G and H) An analysis of aggressive male behaviors showed that the attack frequency (G) and duration (H) of the AON-specific AC3-KD mice were significantly reduced compared with those of the NC mice (NC group: n = 12 mice, AC3-KD group: n = 11 mice). (I and J) The male mating behavior test showed that the mating frequency (I) and duration (J) of the AON-specific AC3-KD mice did not differ from those of the NC mice (n = 12 mice per group). (K) No significant difference in the latency to investigate the pups was found between the AON-specific AC3-KD mice and their controls (NC group: n = 14 mice, AC3-KD gro

- Submitted by
- Invitrogen Antibodies (provider)
- Main image

- Experimental details
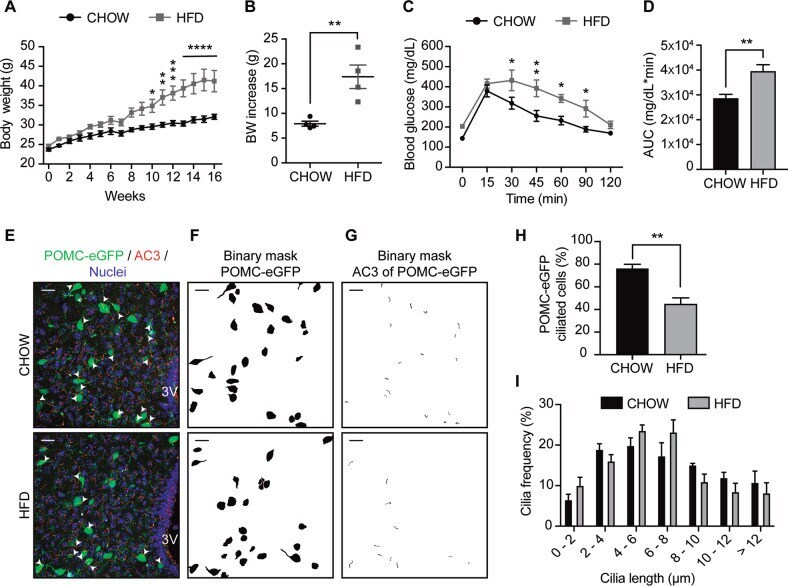
- Chronic HFD consumption decreases the percentage of ciliated cells in hypothalamic POMC neurons. A Body weight of C57BL/6 transgenic mice expressing eGFP in POMC neurons (POMC-eGFP) on a chow or high-fat diet (HFD) for 16 weeks. B Body weight (BW) increase of POMC-eGFP mice fed chow or HFD after 16 weeks. C Glucose tolerance test (GTT) and D area under the curve (AUC) of GTT of POMC-eGFP mice fed chow or high-fat diet (HFD) for 16 weeks. E Representative confocal images showing POMC-eGFP neurons and AC3 (adenylate cyclase 3, cilia) immunoreactivity in the arcuate nucleus of the hypothalamus, with the respective binary masks ( F , G ) of mice fed chow or HFD for 16 weeks. Arrowheads indicate cilia of POMC-eGFP neurons. Scale bar: 20 um. Nuclei were stained with Hoechst (blue). H Percentage of ciliated cells in POMC-eGFP neurons. I Cilia length distribution of POMC-eGFP neurons from mice fed chow or HFD for 16 weeks. Data are presented as mean +- SEM. Statistical differences were evaluated by using: A Two-way ANOVA followed by post hoc Sidak multiple comparison test; B , D , H unpaired two-tailed Student t -test; C two-way ANOVA, post hoc Holm-Sidak multiple comparison test. * p < 0.05, ** p < 0.01, *** p < 0.001, **** p < 0.0001. n = 4/group.
- Submitted by
- Invitrogen Antibodies (provider)
- Main image
- Experimental details
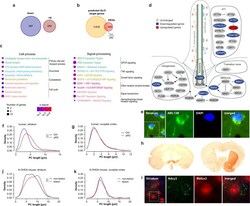
- Primary cilia associated genes are dysregulated in postmortem tissue of sPD patients. a Number of up- and downregulated DEGs. b Overlap of genome wide predicted GLI3 target genes using the MatInspector (Genomatix) with DEGs. c Enriched pathways of the categories Cell process and Signal processing analyzed using Pathway Studio for DEGs identified in a previously published meta-analysis ( n = 83 PD patients and 70 Ctrl patients) of substantia nigra transcriptome studies . P -values were determined by one-sided Fisher's exact tests. FDR corrected p -values are represented by q -values. d Visualization of cilia associated DEGs. Up- (red) and downregulated (blue) genes are sorted into functional categories intraflagellar transport (IFT), transition zone, BBSome, axoneme, and ciliogenesis. e PC immunostaining with anti-ARL13B exemplarily shown for patient GA 2019/20 Ctrl-2. f Density plot illustrating PC length (in um) distribution in human striatum ( n = 79-133 cilia per individual), and g occipital cortex ( n = 75-105 cilia per individual). PC length was measured in paraffin embedded brain sections immunostained with anti-ARL13B. Brain sections were obtained from 6 PD patients and 6 Ctrls. h Immunostaining with anti-TH (left: substantia nigra; right: striatum) and i PC immunostaining with anti-Rbfox3 and anti-Adcy3 exemplarily shown for a 6-OHDA injected mouse. j Density plot illustrating neuronal PC length (in um) distribution in the dorsal striatum ( n = 87-115 cilia per mouse)

- Submitted by
- Invitrogen Antibodies (provider)
- Main image
- Experimental details
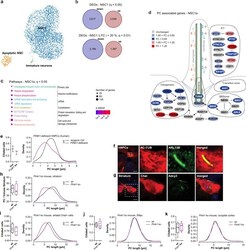
- Primary cilia in fPD. a UMAP visualization of 3671 annotated cells from a PINK1 ko and isogenic Ctrl hNPC cell line within the clusters NSC: neural stem cells, apoptotic NSC, and immature neurons. b Number of all and most (| FC | > 20%; q < 0.01) up- and downregulated DEGs in the NSC1 cluster. FC, fold change. c Enriched pathways of the categories Cell process analyzed using Pathway Studio for the DEGs of the NSC1 cluster. P -values were determined by one-sided Fisher's exact tests. FDR corrected p -values are represented by q -values. d Visualization of the "Intraflagellar transport: BBSome interaction" pathway with manual annotations. Up- (red) and downregulated (blue) genes are sorted into functional categories intraflagellar transport (IFT), transition zone, BBSome, axoneme, and ciliogenesis. Color intensity is proportional to fold change. e (right) Density plot illustrating the distribution of PC length (in um) in a hNPC population. (left) Fraction of ciliated cells. PC length was measured in immunostainings of PINK1 ko and isogenic Ctrl hNPCs with anti-ARL13B. n = 38-89 cilia per clone and replicate (three independent differentiations). f PC immunostaining with anti-AC-TUB and anti-ARL13B exemplarily shown for isogenic Ctrl of PINK1 ko hNPCs. g PC immunostaining with anti-Chat and anti-Adcy3 exemplarily shown for a Pink1 ko mice. h (left) Fraction of ciliated cells (in a striatal volume of 115 um x 87 um x 40 um) and (right) density plot illustrating the distr

- Submitted by
- Invitrogen Antibodies (provider)
- Main image
- Experimental details
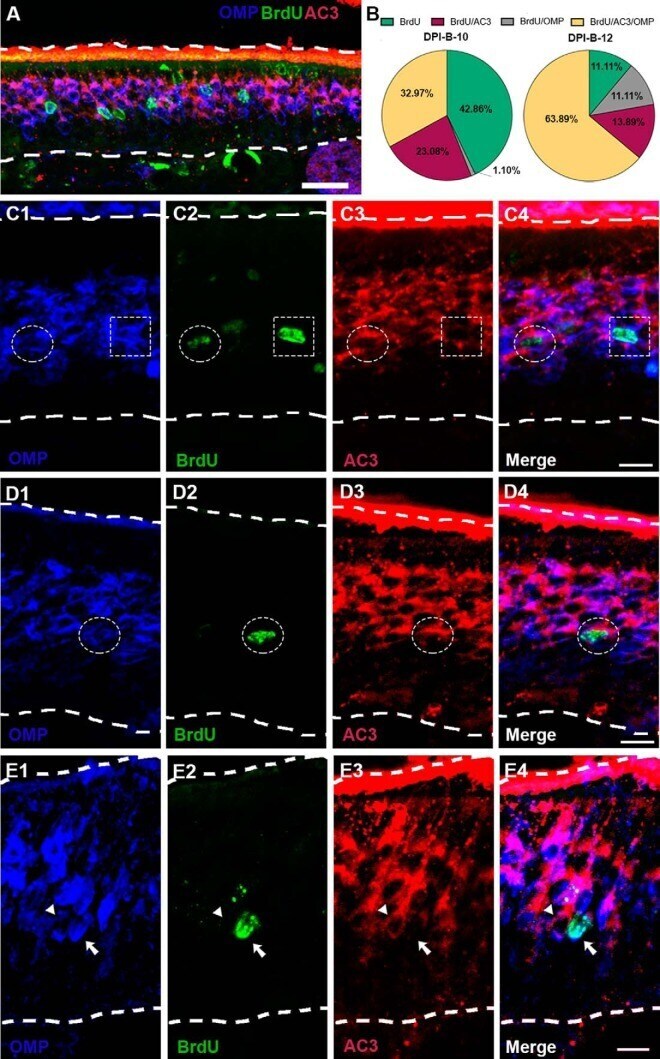
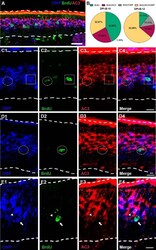
- Figure 6. BrdU/AC3/OMP triple immunostaining at 10 and 12 d following BrdU administration. A , Confocal image at low magnification representing flattened stacks of seven to nine 1-mum-thick optical sections. BrdU + (green) OSNs coexpressing AC3 (red) and OMP (blue) at day 12 after BrdU injections (arrows). B , Pie charts quantifying BrdU + cells expressing AC3 (maroon) or OMP (gray), coexpressing AC3 and OMP (yellow), or not expressing either AC3 and/or OMP (green) at DPI-B-10 and DPI-B-12. C , D , Higher-magnification confocal images showing examples of BrdU + cells (green) coexpressing AC3 (red) and/or OMP (blue). C1-C4 , Dotted circle denotes a BrdU + cell ( C2 , green) coexpressing OMP ( C1 , blue) and AC3 ( C3 , red), while a dotted square highlights a BrdU + cell ( C2 , green) expressing OMP ( C1 , blue), but not AC3 ( C3 , red); C4 shows a merged image. D1-D4 , A dotted circle shows a BrdU + cell ( D2 , green) coexpressing OMP ( D1 , blue) and AC3 ( D3 , red); D4 shows a merged image. E1-E4 , Arrow pointing to a BrdU + cell ( E2 , green) expressing OMP ( E1 , blue), but not AC3 ( E3 ). Next to the BrdU + cell, there is a BrdU - cell (arrowhead) coexpressing OMP ( E1 , blue) and AC3 ( E3 , red); E4 shows a merged image. Dashed white lines delineate the surface of the OE (top) and basal lamina (bottom). Scale bars: A , 25 mum; C-E , 10 mum.