Explore
 Validate
 Learn
Learn Western blot
Antibody data
- Antibody Data
- Antigen structure
- References [1]
- Comments [0]
- Validations
- Western blot [1]
- Other assay [1]
Submit
Validation data
Reference
Comment
Report error
- Product number
- MA5-15012 - Provider product page

- Provider
- Invitrogen Antibodies
- Product name
- Jagged1 Monoclonal Antibody (J.841.5)
- Antibody type
- Monoclonal
- Antigen
- Synthetic peptide
- Description
- It is not recommended to aliquot this antibody.
- Antibody clone number
- J.841.5
- Concentration
- 78 µg/mL
Submitted references M1-Polarized Macrophages Promote Self-Renewing Phenotype of Hepatic Progenitor Cells with Jagged1-Notch Signalling Involved: Relevance in Primary Sclerosing Cholangitis.
Li H, Sun S, Lei Q, Lei P, Cai X, Wan C, Shen G
Journal of immunology research 2018;2018:4807145
Journal of immunology research 2018;2018:4807145
No comments: Submit comment
Supportive validation
- Submitted by
- Invitrogen Antibodies (provider)
- Main image

- Experimental details
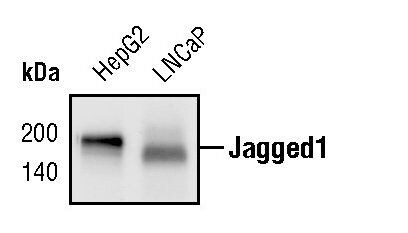
- Western blot analysis of Jagged1 in total cell lysates from HepG2 and LNCaP cells using Jagged1 monoclonal antibody (Product # MA5-15012).
Supportive validation
- Submitted by
- Invitrogen Antibodies (provider)
- Main image

- Experimental details
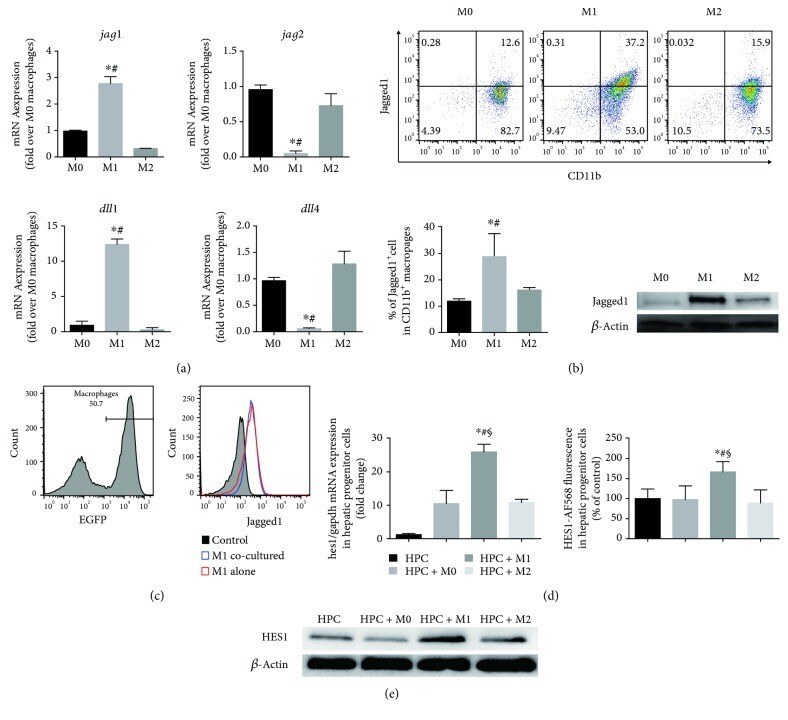
- Figure 3 Classical macrophage activation is associated with elevated Notch ligand Jagged1 expression in macrophages and activation of Notch signalling in cocultured HPCs. (a) Quantitative analysis of Notch ligands ( Jag1 , Jag2 , Dll1 , and Dll4 ) expression in M0, M1, and M2 macrophages. (b) Jagged1 levels on M1 macrophages are confirmed by flow cytometry and Western blots. Flow cytometry results are represented by scatter plot, and calculated flow cytometry data are represented; * p < 0.05 vs M0 macrophages and # p < 0.05 vs M2 macrophages. (c) Histograms from flow cytometry analysis represent Jagged1 expressions in M1 macrophages from EGFP transgenic C57BL/6 mice cultured with or without HPC for 24 hours. (d) Graphs show relative mRNA expression levels of HES1 in HPC alone or in HPC cocultured with M0, M1, or M2 macrophages; levels of HES1 staining (Alexa Flour 568) in HPC were determined by static cytometry. Graphs show calculated relative expression of HES1 in HPC cocultured with M0, M1, or M2 macrophages (percentage of HPC culture alone). * p < 0.05 vs HPC alone, # p < 0.05 vs M0 macrophages cocultured with HPC, and SS p < 0.05 vs M2 macrophages cocultured with HPC. (c) Representative Western blots showing HES1 protein levels in HPC after coculturing with M0, M1, or M2 macrophages.