Explore
 Validate
 Learn
Learn Western blot
 Flow cytometry
Antibody data
- Antibody Data
- Antigen structure
- References [3]
- Comments [0]
- Validations
- Flow cytometry [5]
- Other assay [1]
Submit
Validation data
Reference
Comment
Report error
- Product number
- MA1-41015 - Provider product page

- Provider
- Invitrogen Antibodies
- Product name
- RANK Monoclonal Antibody (9A725), PE
- Antibody type
- Monoclonal
- Antigen
- Other
- Description
- This antibody recognizes an epitope located between amino acid residues 330-427 of human RaNK. Suggested positive control: Raw.
- Reactivity
- Human, Mouse, Rat, Chicken/Avian
- Host
- Mouse
- Conjugate
- Yellow dye
- Isotype
- IgG
- Antibody clone number
- 9A725
- Vial size
- 100 μL
- Concentration
- 0.52 mg/mL
- Storage
- 4°C, store in dark
Submitted references CaSR Induces Osteoclast Differentiation and Promotes Bone Metastasis in Lung Adenocarcinoma.
Chondrocytes-Specific Expression of Osteoprotegerin Modulates Osteoclast Formation in Metaphyseal Bone.
Human polymorphonuclear neutrophils express RANK and are activated by its ligand, RANKL.
Liu L, Fan Y, Chen Z, Zhang Y, Yu J
Frontiers in oncology 2020;10:305
Frontiers in oncology 2020;10:305
Chondrocytes-Specific Expression of Osteoprotegerin Modulates Osteoclast Formation in Metaphyseal Bone.
Wang B, Jin H, Shu B, Mira RR, Chen D
Scientific reports 2015 Sep 2;5:13667
Scientific reports 2015 Sep 2;5:13667
Human polymorphonuclear neutrophils express RANK and are activated by its ligand, RANKL.
Riegel A, Maurer T, Prior B, Stegmaier S, Heppert V, Wagner C, Hänsch GM
European journal of immunology 2012 Apr;42(4):975-81
European journal of immunology 2012 Apr;42(4):975-81
No comments: Submit comment
Supportive validation
- Submitted by
- Invitrogen Antibodies (provider)
- Main image
- Experimental details
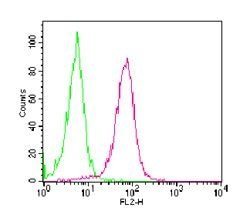
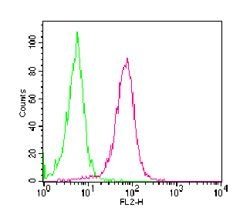
- Intracellular flow analysis of RANK in RAW cells using 0.5 µg of CD265/RANK monoclonal antibody (Product # MA1-41015). Green histogram represents isotype control antibody; red represents CD265/RANK monoclonal antibody (Product # MA1-41015).
- Conjugate
- Yellow dye
- Submitted by
- Invitrogen Antibodies (provider)
- Main image
- Experimental details
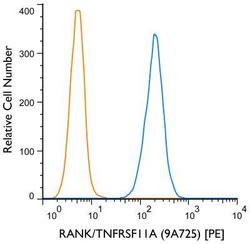
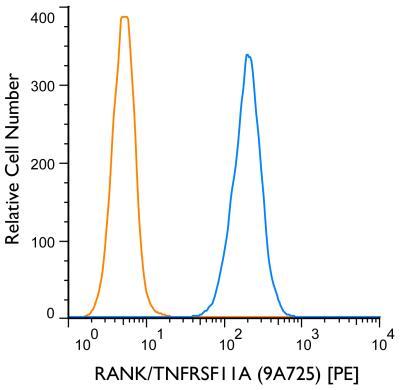
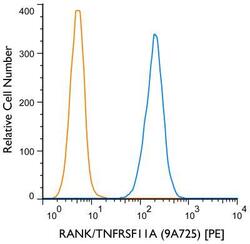
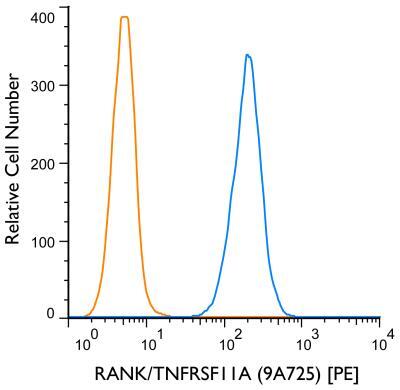
- Flow cytometry of RANK in K-562 cells (blue) and a matched isotype control (orange). Samples were incubated in RANK monoclonal antibody (Product # MA1-41015) using a dilution of 1 µg/mL for 30 minutes at room temperature. Cells were fixed with 4% PFA and then permeablized with 0.1% saponin. Both antibodies were conjugated to Phycoerythrin.
- Conjugate
- Yellow dye
- Submitted by
- Invitrogen Antibodies (provider)
- Main image
- Experimental details
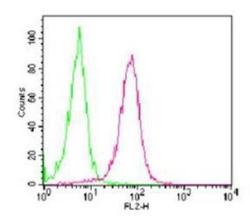
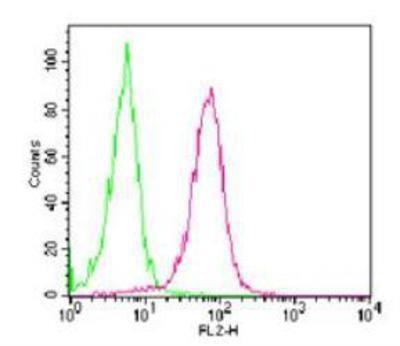
- Flow cytometry of RANK in RAW cells. Samples were incubated in RANK monoclonal antibody (Product # MA1-41015) using a dilution of 0.5 µg. Green histogram represents isotype control antibody; red represents RANK antibody.
- Conjugate
- Yellow dye

- Submitted by
- Invitrogen Antibodies (provider)
- Main image
- Experimental details
- Flow cytometry of RANK in K-562 cells (blue) and a matched isotype control (orange). Samples were incubated in RANK monoclonal antibody (Product # MA1-41015) using a dilution of 1 µg/mL for 30 minutes at room temperature. Cells were fixed with 4% PFA and then permeablized with 0.1% saponin. Both antibodies were conjugated to Phycoerythrin.
- Submitted by
- Invitrogen Antibodies (provider)
- Main image

- Experimental details
- Flow cytometry of RANK in RAW cells. Samples were incubated in RANK monoclonal antibody (Product # MA1-41015) using a dilution of 0.5 µg. Green histogram represents isotype control antibody; red represents RANK antibody.
Supportive validation
- Submitted by
- Invitrogen Antibodies (provider)
- Main image
- Experimental details
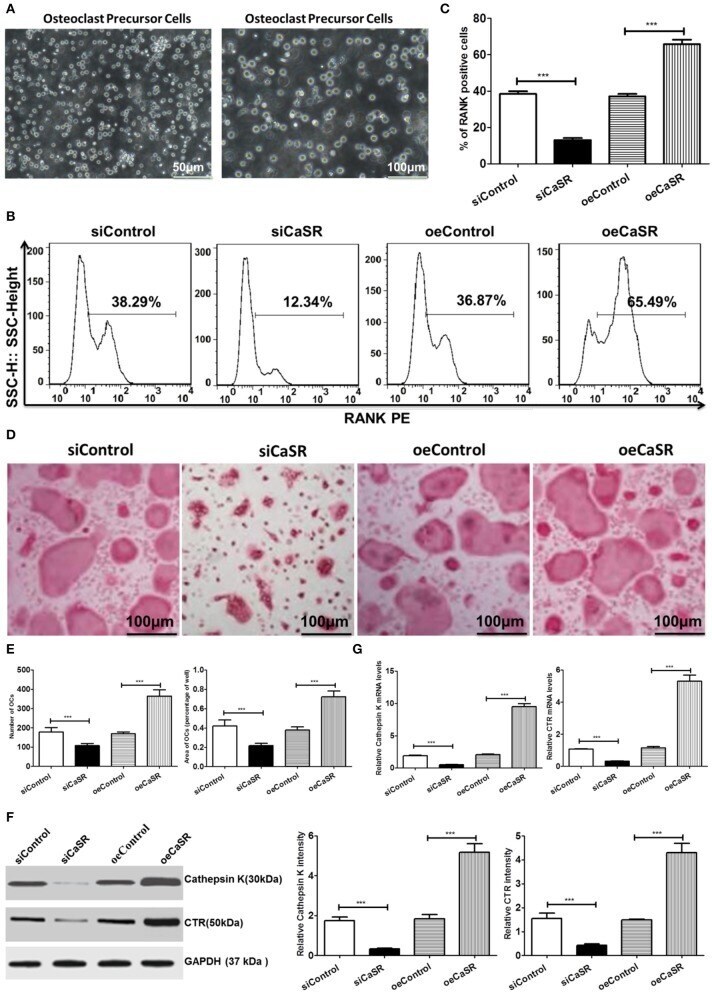
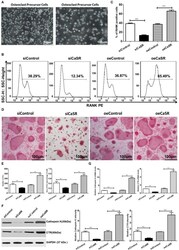
- Figure 3 Analysis of CaSR effects on OCs. (A) Isolation and identification of OC precursor cells. (B-E) Four groups of OC precursor cells were treated with CM from modified A549 cells co-cultured with macrophages to examine potential OC differentiation induction. Flow cytometry was used to detect expression of RANK-positive OCs. TRAP+ multinucleated cells were counted using 400-fold microscope and TRAP-stained OC area was calculated using ImageJ software (NIH). OC number and osteolytic area size in CaSR overexpression group were significantly higher than those in empty vector and negative control groups ( p < 0.001). The difference between negative and empty vector control groups was not statistically significant ( p > 0.05). (F) Protein expression levels of bone matrix degradation-related enzymes cathepsin K and CTR were detected by western blot after CaSR overexpression and knockdown in A549 cells. ImageJ software (NIH) for image processing was used to verify band intensities as a result of semi-quantitative western blots. Protein expression levels of cathepsin K and CTR were significantly higher in CaSR overexpression group than in empty vector and negative control groups ( p < 0.001). (G) The qPCR was used to detect expression of bone matrix degradation-related enzymes cathepsin K and CTR mRNA levels after CaSR overexpression and knockdown. Cathepsin K and CRT mRNA expression levels were significantly higher in CaSR overexpression group than in empty vector and negative c
- Conjugate
- Yellow dye