Explore
 Validate
 Learn
Learn Western blot
 Immunohistochemistry
Antibody data
- Antibody Data
- Antigen structure
- References [1]
- Comments [0]
- Validations
- Immunohistochemistry [1]
- Other assay [1]
Submit
Validation data
Reference
Comment
Report error
- Product number
- PA5-40909 - Provider product page

- Provider
- Invitrogen Antibodies
- Product name
- IkB beta Polyclonal Antibody
- Antibody type
- Polyclonal
- Antigen
- Synthetic peptide
- Description
- Peptide sequence: MLRPNPILAR LLRAHGAPEP EGEDEKSGPC SSSSDSDSGD EGDEYDDIVV Sequence homology: Cow: 91%; Dog: 83%; Guinea Pig: 92%; Horse: 92%; Human: 100%; Mouse: 85%; Rabbit: 77%; Rat: 92%
- Reactivity
- Human
- Host
- Rabbit
- Isotype
- IgG
- Vial size
- 100 μL
- Concentration
- 1 mg/mL
- Storage
- -20°C, Avoid Freeze/Thaw Cycles
Submitted references Quantitative Analysis of Cellular Proteome Alterations in CDV-Infected Mink Lung Epithelial Cells.
Tong M, Yi L, Sun N, Cheng Y, Cao Z, Wang J, Li S, Lin P, Sun Y, Cheng S
Frontiers in microbiology 2017;8:2564
Frontiers in microbiology 2017;8:2564
No comments: Submit comment
Supportive validation
- Submitted by
- Invitrogen Antibodies (provider)
- Main image

- Experimental details
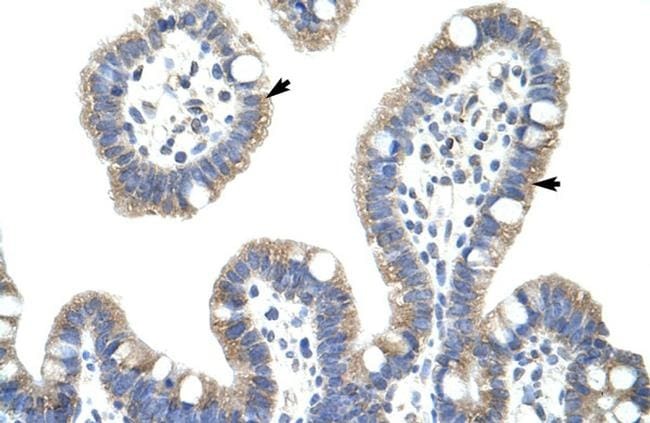
- Immunohistochemistry analysis of human intestine tissue using an anti-I-kappa-B-beta polyclonal antibody (Product # PA5-40909).
Supportive validation
- Submitted by
- Invitrogen Antibodies (provider)
- Main image

- Experimental details
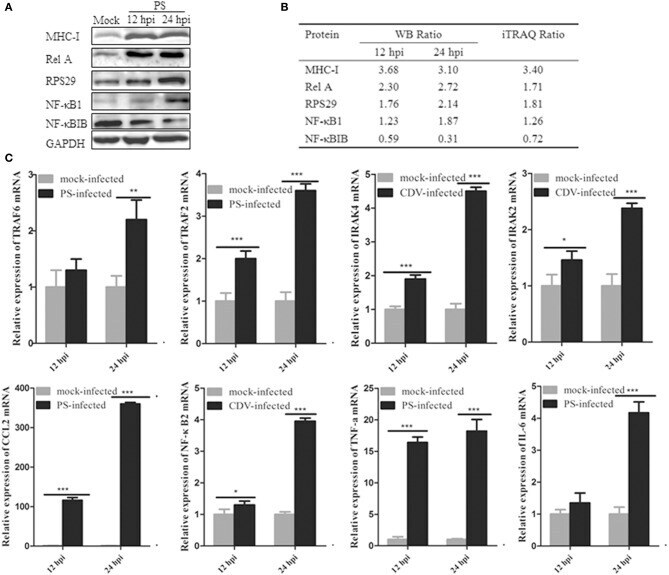
- Figure 5 Confirmation of the iTRAQ-MS data by western blotting or real-time RT-PCR. (A) Western blot analysis of NF-kappaB1, RelA, MHC-I, RPS29, and NFkappaBIB in PS-infected and control samples at 12 and 24 hpi. GAPDH was served as internal reference. (B) The intensity ratio of the corresponding bands (infection/mock) was quantified using ImageJ software and normalized against GAPDH. (C) Eight selected differently expression proteins related to NF-kappaB pathway were testified using real-time RT-PCR method. Each gene was performed in three independent experiments. The relative gene expression was calculated using 2- DeltaDelta CT model, representative of n -fold changes in comparison with mock-infected samples. Error bars represent the standard error for triplicate samples. * P < 0.05; ** P < 0.01; *** P < 0.001. The data was analyzed by two-way ANOVA followed by Duncan's test.