 Explore
 Validate
 Learn
Learn Western blot
 Chromatin Immunoprecipitation
Antibody data
- Antibody Data
- Antigen structure
- References [1]
- Comments [0]
- Validations
- Chromatin Immunoprecipitation [2]
Submit
Validation data
Reference
Comment
Report error
- Product number
- PA1-813 - Provider product page

- Provider
- Invitrogen Antibodies
- Product name
- FOXA3 Polyclonal Antibody
- Antibody type
- Polyclonal
- Antigen
- Synthetic peptide
- Description
- PA1-813 detects FOXA3 from human samples. PA1-813 has been successfully used in Western blot and ChIP applications. By Western blot, PA1-813 detects a ~37 kDa band representing FOXA3 from mouse liver. The PA1-813 immunogen is a synthetic peptide corresponding to residues S(4) V K M E A H D L A E W S Y Y P E A G E(23) of mouse FOXA3. This immunizing peptide (PEP-299) is available for use in neutralization and control experiments.
- Reactivity
- Human, Mouse, Rat
- Host
- Rabbit
- Isotype
- IgG
- Vial size
- 100 μg
- Concentration
- 1 mg/mL
- Storage
- -20°C, Avoid Freeze/Thaw Cycles
Submitted references Hepatocyte-like cells generated by direct reprogramming from murine somatic cells can repopulate decellularized livers.
Chen C, Pla-Palacín I, Baptista PM, Shang P, Oosterhoff LA, van Wolferen ME, Penning LC, Geijsen N, Spee B
Biotechnology and bioengineering 2018 Nov;115(11):2807-2816
Biotechnology and bioengineering 2018 Nov;115(11):2807-2816
No comments: Submit comment
Supportive validation
- Submitted by
- Invitrogen Antibodies (provider)
- Main image
- Experimental details
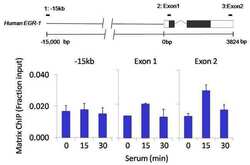
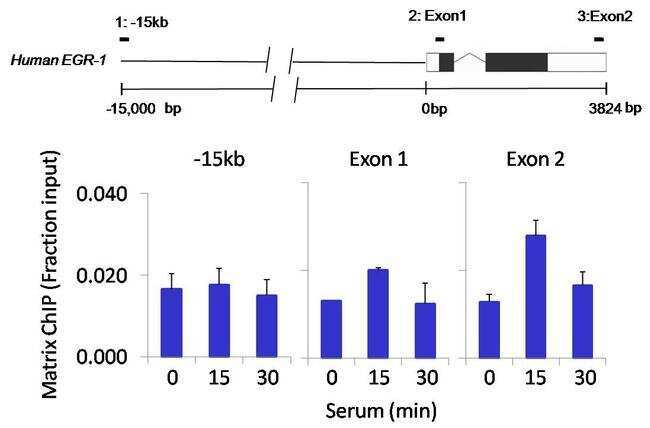
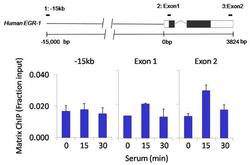
- Chromatin immunoprecipitation analysis of FOXA3 was performed using cross-linked chromatin from 1x10^6 HCT116 colon carcinoma cells treated with serum for 0, 15, and 30 minutes. Immunoprecipitation was performed using a multiplex microplate Matrix ChIP assay (see reference for Matrix ChIP protocol: http://www.ncbi.nlm.nih.gov/pubmed/22098709) with 1.0 µL/100 µL well volume of a FOXA3 polyclonal antibody (Product # PA1-813). Chromatin aliquots from ~1x10^5 cells were used per ChIP pull-down. Quantitative PCR data were done in quadruplicate using 1 µL of eluted DNA in 2 µL SYBR real-time PCR reactions containing primers to amplify -15kb upstream of the Egr1 gene or exon-1 or exon-2 of Egr1. PCR calibration curves were generated for each primer pair from a dilution series of sheared total genomic DNA. Quantitation of immunoprecipitated chromatin is presented as signal relative to the total amount of input chromatin. Results represent the mean +/- SEM for three experiments. A schematic representation of the Egr-1 locus is shown above the data where boxes represent exons (black boxes = translated regions, white boxes = untranslated regions), the zigzag line represents an intron, and the straight line represents upstream sequence. Regions amplified by Egr-1 primers are represented by black bars. Data courtesy of the Innovators Program.
- Submitted by
- Invitrogen Antibodies (provider)
- Main image
- Experimental details
- Chromatin immunoprecipitation analysis of FOXA3 was performed using cross-linked chromatin from 1x10^6 HCT116 colon carcinoma cells treated with serum for 0, 15, and 30 minutes. Immunoprecipitation was performed using a multiplex microplate Matrix ChIP assay (see reference for Matrix ChIP protocol: http://www.ncbi.nlm.nih.gov/pubmed/22098709) with 1.0 µL/100 µL well volume of a FOXA3 polyclonal antibody (Product # PA1-813). Chromatin aliquots from ~1x10^5 cells were used per ChIP pull-down. Quantitative PCR data were done in quadruplicate using 1 µL of eluted DNA in 2 µL SYBR real-time PCR reactions containing primers to amplify -15kb upstream of the Egr1 gene or exon-1 or exon-2 of Egr1. PCR calibration curves were generated for each primer pair from a dilution series of sheared total genomic DNA. Quantitation of immunoprecipitated chromatin is presented as signal relative to the total amount of input chromatin. Results represent the mean +/- SEM for three experiments. A schematic representation of the Egr-1 locus is shown above the data where boxes represent exons (black boxes = translated regions, white boxes = untranslated regions), the zigzag line represents an intron, and the straight line represents upstream sequence. Regions amplified by Egr-1 primers are represented by black bars. Data courtesy of the Innovators Program.
