 Explore
 Validate
 Learn
Learn Western blot
Antibody data
- Antibody Data
- Antigen structure
- References [9]
- Comments [0]
- Validations
- Western blot [5]
- Immunocytochemistry [7]
- Immunohistochemistry [3]
- Other assay [7]
Submit
Validation data
Reference
Comment
Report error
- Product number
- PA5-27406 - Provider product page

- Provider
- Invitrogen Antibodies
- Product name
- LDHA Polyclonal Antibody
- Antibody type
- Polyclonal
- Antigen
- Recombinant full-length protein
- Description
- Recommended positive controls: 293T, A431, HeLa, HepG2, MCF-7, MDA-MB-231, Neuro2A, C8D30, NIH-3T3, Raw264.7, C2C12, PC-12, Rat2. Predicted reactivity: Mouse (92%), Rat (91%), Xenopus laevis (80%), Pig (90%), Rabbit (91%), Chicken (80%), Rhesus Monkey (99%), Chimpanzee (100%), Bovine (91%). Store product as a concentrated solution. Centrifuge briefly prior to opening the vial.
- Reactivity
- Human, Mouse, Rat
- Host
- Rabbit
- Isotype
- IgG
- Vial size
- 100 μL
- Concentration
- 0.37 mg/mL
- Storage
- Store at 4°C short term. For long term storage, store at -20°C, avoiding freeze/thaw cycles.
Submitted references Identification of metabolic pathways underlying FGF1 and CHIR99021-mediated cardioprotection.
Metabolic Reprogramming of Glioblastoma Cells during HCMV Infection Induces Secretome-Mediated Paracrine Effects in the Microenvironment.
Metabolic Profile in Neonatal Pig Hearts.
SIRT3 and Metabolic Reprogramming Mediate the Antiproliferative Effects of Whey in Human Colon Cancer Cells.
Lactate oxidative phosphorylation by annulus fibrosus cells: evidence for lactate-dependent metabolic symbiosis in intervertebral discs.
Lactate Reprograms Energy and Lipid Metabolism in Glucose-Deprived Oxidative Glioma Stem Cells.
LDHA-mediated ROS generation in chondrocytes is a potential therapeutic target for osteoarthritis.
Breast cancer stem cells rely on fermentative glycolysis and are sensitive to 2-deoxyglucose treatment.
p63 isoforms regulate metabolism of cancer stem cells.
Xu B, Li F, Zhang W, Su Y, Tang L, Li P, Joshi J, Yang A, Li D, Wang Z, Wang S, Xie J, Gu H, Zhu W
iScience 2022 Jun 17;25(6):104447
iScience 2022 Jun 17;25(6):104447
Metabolic Reprogramming of Glioblastoma Cells during HCMV Infection Induces Secretome-Mediated Paracrine Effects in the Microenvironment.
Harrison MAA, Hochreiner EM, Benjamin BP, Lawler SE, Zwezdaryk KJ
Viruses 2022 Jan 7;14(1)
Viruses 2022 Jan 7;14(1)
Metabolic Profile in Neonatal Pig Hearts.
Li P, Li F, Tang L, Zhang W, Jin Y, Gu H, Zhu W
Frontiers in cardiovascular medicine 2021;8:763984
Frontiers in cardiovascular medicine 2021;8:763984
SIRT3 and Metabolic Reprogramming Mediate the Antiproliferative Effects of Whey in Human Colon Cancer Cells.
D'Onofrio N, Martino E, Balestrieri A, Mele L, Neglia G, Balestrieri ML, Campanile G
Cancers 2021 Oct 16;13(20)
Cancers 2021 Oct 16;13(20)
Lactate oxidative phosphorylation by annulus fibrosus cells: evidence for lactate-dependent metabolic symbiosis in intervertebral discs.
Wang D, Hartman R, Han C, Zhou CM, Couch B, Malkamaki M, Roginskaya V, Van Houten B, Mullett SJ, Wendell SG, Jurczak MJ, Kang J, Lee J, Sowa G, Vo N
Arthritis research & therapy 2021 May 21;23(1):145
Arthritis research & therapy 2021 May 21;23(1):145
Lactate Reprograms Energy and Lipid Metabolism in Glucose-Deprived Oxidative Glioma Stem Cells.
Minami N, Tanaka K, Sasayama T, Kohmura E, Saya H, Sampetrean O
Metabolites 2021 May 18;11(5)
Metabolites 2021 May 18;11(5)
LDHA-mediated ROS generation in chondrocytes is a potential therapeutic target for osteoarthritis.
Arra M, Swarnkar G, Ke K, Otero JE, Ying J, Duan X, Maruyama T, Rai MF, O'Keefe RJ, Mbalaviele G, Shen J, Abu-Amer Y
Nature communications 2020 Jul 9;11(1):3427
Nature communications 2020 Jul 9;11(1):3427
Breast cancer stem cells rely on fermentative glycolysis and are sensitive to 2-deoxyglucose treatment.
Ciavardelli D, Rossi C, Barcaroli D, Volpe S, Consalvo A, Zucchelli M, De Cola A, Scavo E, Carollo R, D'Agostino D, Forlì F, D'Aguanno S, Todaro M, Stassi G, Di Ilio C, De Laurenzi V, Urbani A
Cell death & disease 2014 Jul 17;5(7):e1336
Cell death & disease 2014 Jul 17;5(7):e1336
p63 isoforms regulate metabolism of cancer stem cells.
D'Aguanno S, Barcaroli D, Rossi C, Zucchelli M, Ciavardelli D, Cortese C, De Cola A, Volpe S, D'Agostino D, Todaro M, Stassi G, Di Ilio C, Urbani A, De Laurenzi V
Journal of proteome research 2014 Apr 4;13(4):2120-36
Journal of proteome research 2014 Apr 4;13(4):2120-36
No comments: Submit comment
Supportive validation
- Submitted by
- Invitrogen Antibodies (provider)
- Main image
- Experimental details
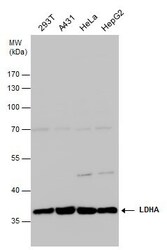
- LDHA Polyclonal Antibody detects LDHA protein by western blot analysis. Various whole cell extracts (30 µg) were separated by 10% SDS-PAGE, and the membrane was blotted with LDHA Polyclonal Antibody (Product # PA5-27406) diluted at 1:1,000. The HRP-conjugated anti-rabbit IgG antibody was used to detect the primary antibody.
- Submitted by
- Invitrogen Antibodies (provider)
- Main image
- Experimental details
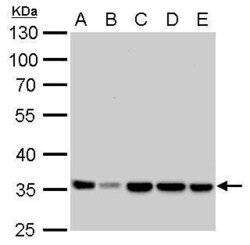
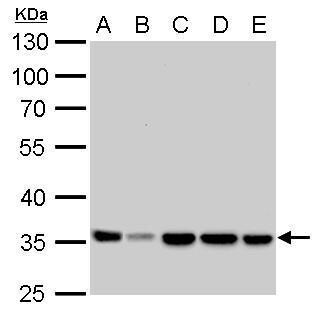
- LDHA Polyclonal Antibody detects LDHA protein by western blot analysis. A. 30 µg Neuro2A whole cell lysate/extract. B. 30 µg C8D30 whole cell lysate/extract. C. 30 µg NIH-3T3 whole cell lysate/extract. D. 30 µg Raw264.7 whole cell lysate/extract. E. 30 µg C2C12 whole cell lysate/extract.10% SDS-PAGE. LDHA Polyclonal Antibody (Product # PA5-27406) dilution: 1:1,000. The HRP-conjugated anti-rabbit IgG antibody was used to detect the primary antibody.
- Submitted by
- Invitrogen Antibodies (provider)
- Main image

- Experimental details
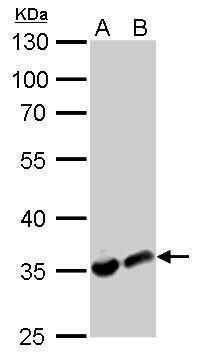
- LDHA Polyclonal Antibody detects LDHA protein by western blot analysis. A. 30 µg PC-12 whole cell lysate/extract. B. 30 µg Rat2 whole cell lysate/extract.10% SDS-PAGE. LDHA Polyclonal Antibody (Product # PA5-27406) dilution: 1:1,000. The HRP-conjugated anti-rabbit IgG antibody was used to detect the primary antibody.
- Submitted by
- Invitrogen Antibodies (provider)
- Main image
- Experimental details
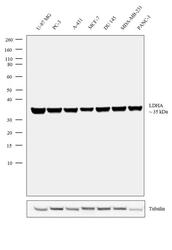
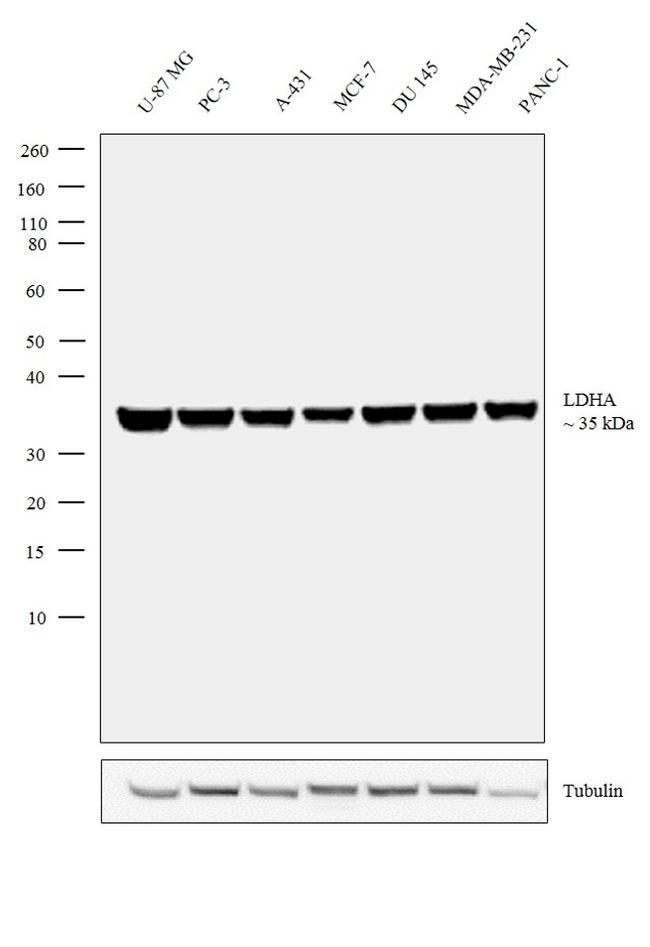
- Western blot analysis was performed on whole cell extracts (30 µg lysate) of U-87 MG (Lane 1), PC-3 (Lane 2), A-431 (Lane 3), MCF-7 (Lane 4), DU 145 (Lane 5) MDA-MB-231 (Lane 6) and PANC-1 (Lane 7). The blot was probed with Anti-LDHA Polyclonal Antibody (Product # PA5-27406, 1 µg/mL dilution) and detected by chemiluminescence using Goat anti-Rabbit IgG (Heavy Chain) Superclonal™ Secondary Antibody, HRP conjugate (Product # A27036, 0.25 µg/mL, 1:4000 dilution). A 35 kDa band corresponding to LDHA was observed across the cell lines tested.
- Submitted by
- Invitrogen Antibodies (provider)
- Main image

- Experimental details
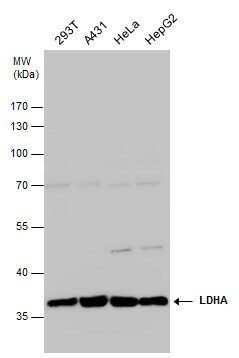
- Western Blot analysis of LDHA was performed by separating 30 µg of various whole cell extracts by 12% SDS-PAGE. Proteins were transferred to a membrane and probed with a LDHA Polyclonal Antibody (Product # PA5-27406) at a dilution of 1:1000 and a HRP-conjugated anti-rabbit IgG secondary antibody.
Supportive validation
- Submitted by
- Invitrogen Antibodies (provider)
- Main image
- Experimental details
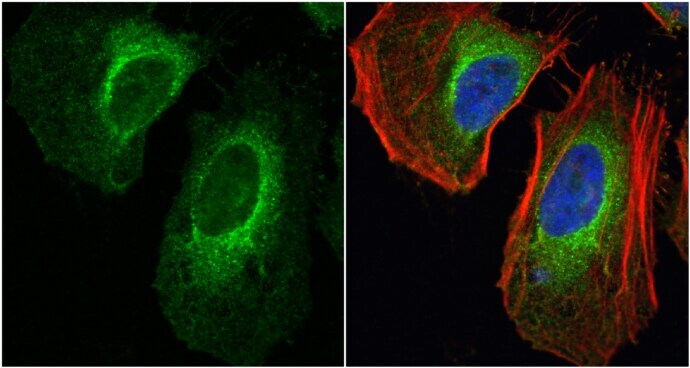
- Immunofluorescent analysis of Lactate Dehydrogenase in methanol-fixed A431 cells using a Lactate Dehydrogenase polyclonal antibody (Product # PA5-27406) at a 1:500 dilution.
- Submitted by
- Invitrogen Antibodies (provider)
- Main image
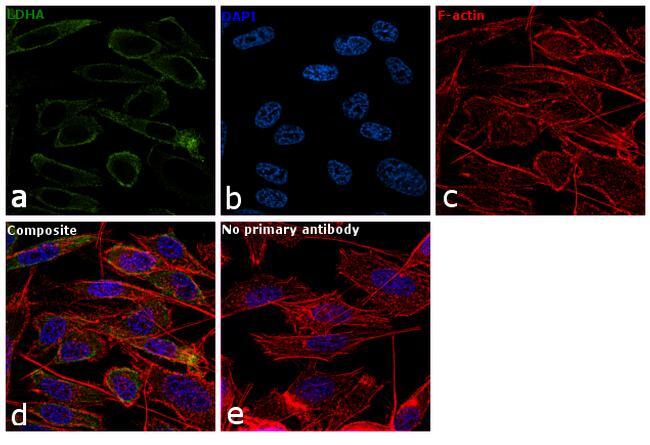
- Experimental details
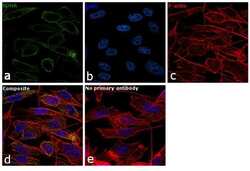
- Immunofluorescence analysis of LDHA was performed using 70% confluent log phase PC-3 cells. The cells were fixed with 4% paraformaldehyde for 10 minutes, permeabilized with 0.1% Triton™ X-100 for 10 minutes, and blocked with 1% BSA for 1 hour at room temperature. The cells were labeled with LDHA Polyclonal Antibody (Product # PA5-27406) at 5 µg/mL in 0.1% BSA and incubated overnight at 4 degree and then labeled with Goat anti-Rabbit IgG (H+L) Superclonal™ Secondary Antibody, Alexa Fluor® 488 conjugate (Product # A27034) at a dilution of 1:2000 for 45 minutes at room temperature (Panel a: green). Nuclei (Panel b: blue) were stained with SlowFade® Gold Antifade Mountant with DAPI (Product # S36938). F-actin (Panel c: red) was stained with Rhodamine Phalloidin (Product # R415, 1:300). Panel d represents the merged image showing cytoplasmic localization. Panel e represents control cells with no primary antibody to assess background. The images were captured at 60X magnification.

- Submitted by
- Invitrogen Antibodies (provider)
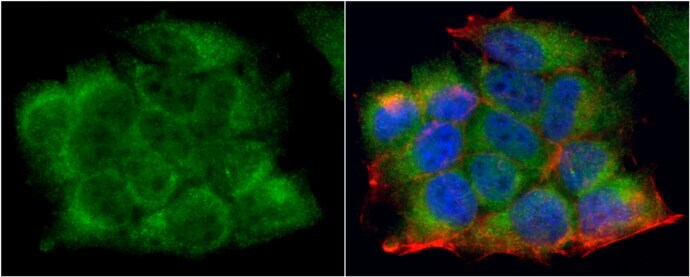
- Main image

- Experimental details
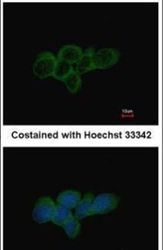
- Immunocytochemistry-Immunofluorescence analysis of LDHA was performed in HeLa cells fixed in 4% paraformaldehyde at RT for 15 min. Green: LDHA Polyclonal Antibody (Product # PA5-27406) diluted at 1:1000. Red: phalloidin, a cytoskeleton marker. Blue: Hoechst 33342 staining.

- Submitted by
- Invitrogen Antibodies (provider)
- Main image

- Experimental details
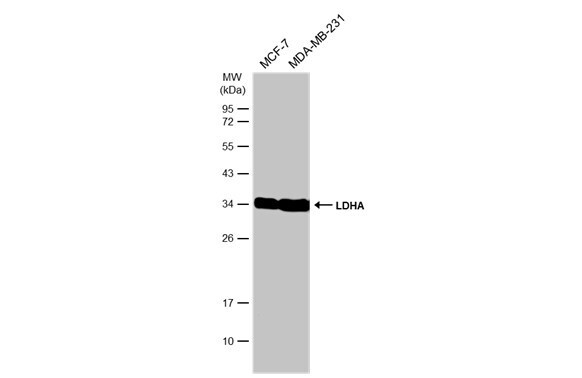
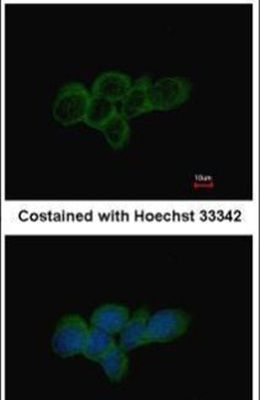
- Immunocytochemistry-Immunofluorescence analysis of LDHA was performed in MCF7 cells fixed in 4% paraformaldehyde at RT for 15 min. Green: LDHA Polyclonal Antibody (Product # PA5-27406) diluted at 1:1000. Red: phalloidin, a cytoskeleton marker. Blue: Hoechst 33342 staining.

- Submitted by
- Invitrogen Antibodies (provider)
- Main image

- Experimental details
- Immunocytochemistry-Immunofluorescence analysis of LDHA was performed in HeLa cells fixed in 4% paraformaldehyde at RT for 15 min. Green: LDHA Polyclonal Antibody (Product # PA5-27406) diluted at 1:1000. Red: phalloidin, a cytoskeleton marker. Blue: Hoechst 33342 staining.
- Submitted by
- Invitrogen Antibodies (provider)
- Main image

- Experimental details
- Immunocytochemistry-Immunofluorescence analysis of LDHA was performed in MCF7 cells fixed in 4% paraformaldehyde at RT for 15 min. Green: LDHA Polyclonal Antibody (Product # PA5-27406) diluted at 1:1000. Red: phalloidin, a cytoskeleton marker. Blue: Hoechst 33342 staining.
- Submitted by
- Invitrogen Antibodies (provider)
- Main image

- Experimental details
- Immunofluorescence analysis of LDHA was performed using 70% confluent log phase PC-3 cells. The cells were fixed with 4% paraformaldehyde for 10 minutes, permeabilized with 0.1% Triton™ X-100 for 10 minutes, and blocked with 1% BSA for 1 hour at room temperature. The cells were labeled with LDHA Polyclonal Antibody (Product # PA5-27406) at 5 µg/mL in 0.1% BSA and incubated overnight at 4 degree and then labeled with Goat anti-Rabbit IgG (Heavy Chain) Superclonal™ Secondary Antibody, Alexa Fluor® 488 conjugate (Product # A27034) at a dilution of 1:2000 for 45 minutes at room temperature (Panel a: green). Nuclei (Panel b: blue) were stained with SlowFade® Gold Antifade Mountant with DAPI (Product # S36938). F-actin (Panel c: red) was stained with Rhodamine Phalloidin (Product # R415, 1:300). Panel d represents the merged image showing cytoplasmic localization. Panel e represents control cells with no primary antibody to assess background. The images were captured at 60X magnification.
Supportive validation
- Submitted by
- Invitrogen Antibodies (provider)
- Main image
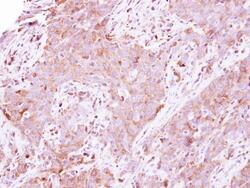
- Experimental details
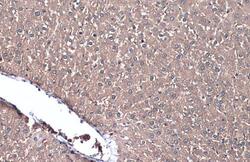
- Immunohistochemical analysis of paraffin-embedded human lung papillory adenocarcinoma, using LDHA (Product # PA5-27406) antibody at 1:500 dilution. Antigen Retrieval: EDTA based buffer, pH 8.0, 15 min.
- Submitted by
- Invitrogen Antibodies (provider)
- Main image
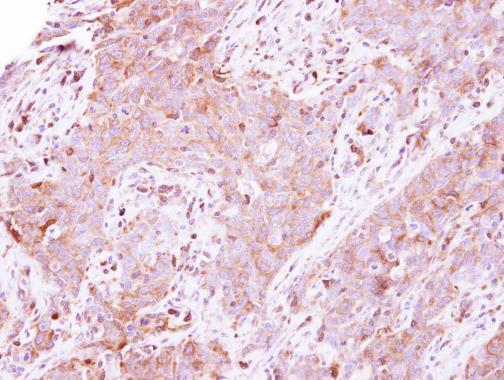
- Experimental details
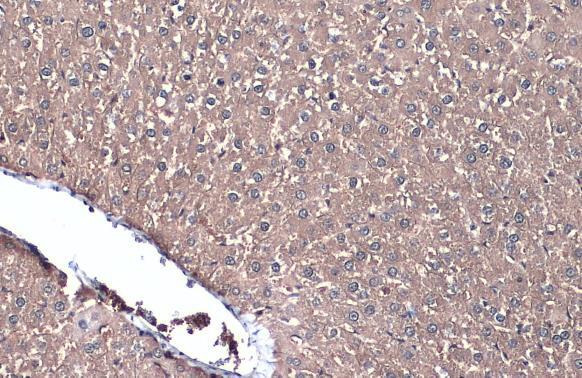
- LDHA Polyclonal Antibody detects LDHA protein at cytoplasm by immunohistochemical analysis. Sample: Paraffin-embedded mouse liver. LDHA stained by LDHA Polyclonal Antibody (Product # PA5-27406) diluted at 1:500. Antigen Retrieval: Citrate buffer, pH 6.0, 15 min.
- Submitted by
- Invitrogen Antibodies (provider)
- Main image
- Experimental details
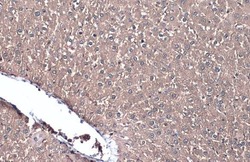
- LDHA Polyclonal Antibody detects LDHA protein at cytoplasm by immunohistochemical analysis. Sample: Paraffin-embedded mouse liver. LDHA stained by LDHA Polyclonal Antibody (Product # PA5-27406) diluted at 1:500. Antigen Retrieval: Citrate buffer, pH 6.0, 15 min.

Supportive validation
- Submitted by
- Invitrogen Antibodies (provider)
- Main image

- Experimental details
- Figure 4 The expression levels and activities of glycolytic enzymes are increased in BCSCs and correlate with altered energy and redox status of BCSCs. ( a ) WB showing PKM2, LDH-A, and G6PDH expression in BCSCs compared with SDACs. beta -Actin is used as a protein-loading control. A representative WB of three independent experiments is shown. ( b ) PK and ( c ) LDH, and enzyme activities evaluated in spheres (BCSCs) as compared with differentiated cells (SDACs). Bar graphs show the mean activity ( n =6) expressed as mu mol/mg Protein /min, and bars represent the S.E.M. ( d ) WB showing the expression of PKM2 and LDH-A in cells sorted for CD24 expression. beta -Actin is used as a loading control. ( e ) PK and ( f ) LDH activity in CD24 -/low cells compared with CD24 + BCSCs. Bar graphs show the mean activity ( n =6) expressed as mu mol/mg Protein /min, and bars represent the S.E.M. ( g ) G6PDH enzyme activity evaluated in spheres (BCSCs) as compared with differentiated cells (SDACs). Bar graphs show the mean activity ( n =6) expressed as mu mol/mg Protein /min, and bars represent the S.E.M. ( h ) NADP + /NADPH, ( i ) NAD + /NADH, and ( j ) ADP/ATP ratios in BCSCs compared with SDACs. Treatment with rotenone does not affect ATP production in BCSCs, whereas strongly increases the ADP/ATP ratio and inhibits mitochondrial ATP production in SDACs. No changes in the ADP/ATP ratio are observed in BCSCs and SDACs after addition of dimethylsulphoxide (DMSO) alone used as a vehicle con

- Submitted by
- Invitrogen Antibodies (provider)
- Main image
- Experimental details
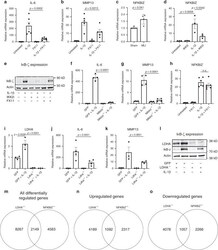
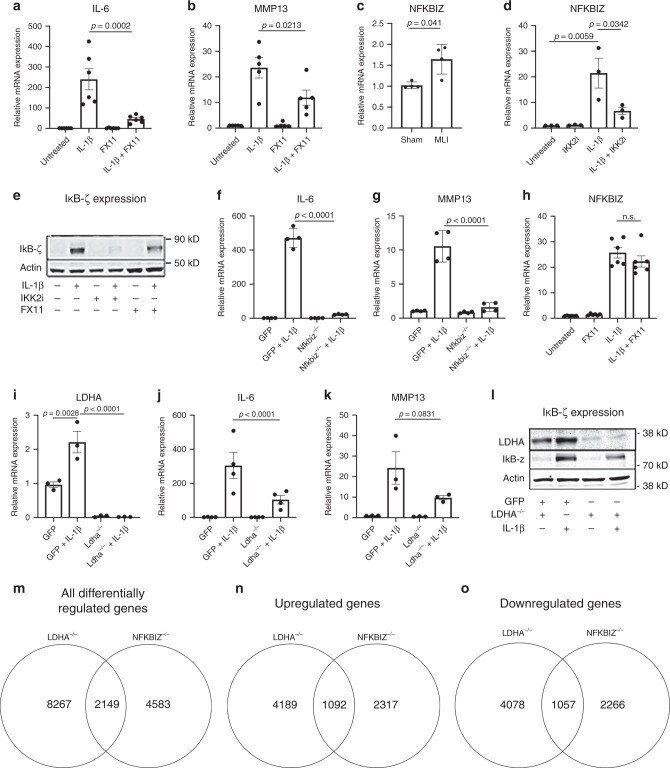
- Fig. 4 LDHA regulates catabolic gene expression and IkappaB-zeta protein levels. a , b Primary chondrocytes were treated with IL-1beta (10 ng/mL) and/or FX11 (40 muM) for 24 h. Bar graphs represent qPCR data for IL-6 and MMP13 expression with error bars representing mean +- S.E.M. of n = 5 experiments. c Articular cartilage was isolated from knee joints of mice 4 weeks after undergoing sham or MLI surgery. Gene expression of Nfkbiz was measured by qPCR, with bars representing mean +- S.D. from n = 4 mice. Two-tailed student's t- test was performed. d Primary chondrocytes were treated with IL-1beta and/or IKK2i (10 muM) for 24 h. Gene expression of Nfkbiz was measured by qPCR. Bars represent mean +- S.E.M. from n = 3 independent experiments. e Representative immunoblot for IkappaB-zeta from chondrocytes treated with IL-1beta and/or IKK2i (10 muM) or FX11 (40 muM) for 24 h. f - g Primary Nfkbiz f/f chondrocytes were infected with adeno-GFP or adeno-cre (labeled Nfkbiz -/- ), then treated with IL-1beta (10 ng/mL) for 24 h. Gene expression of IL-6 and MMP13 was measured, with bars representing mean +- S.D. for n = 4 replicates per group, representative of one of three independent experiments. h Primary chondrocytes were treated with IL-1beta and/or FX11 (40 muM) for 24 h. Gene expression of Nfkbiz was measured. Bars represent mean +- S.E.M. for n = 6 independent experiments. i - k Primary LDHA f/f chondrocytes were infected with adeno-GFP or adeno-cre (labeled LDHA -/- ), then tr
- Submitted by
- Invitrogen Antibodies (provider)
- Main image
- Experimental details
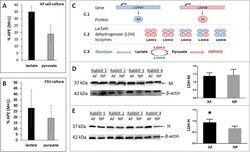
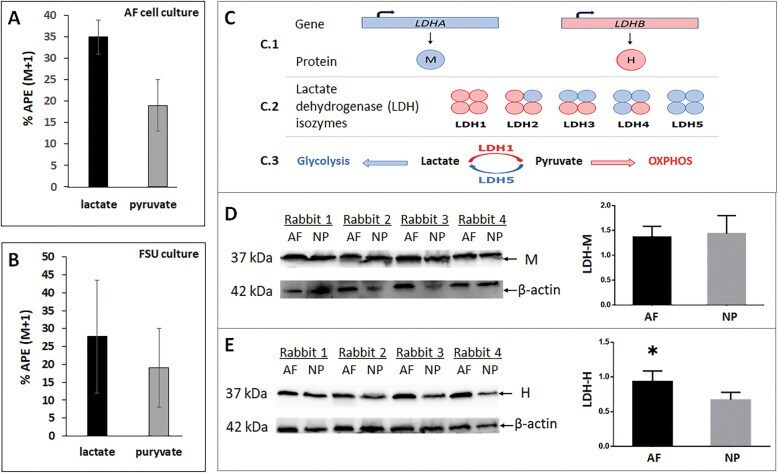
- Fig. 3 Lactate conversion to pyruvate in AF cells. 13 C-lactate tracing to pyruvate in rabbit AF cells in cell culture containing 4mM 3- 13 C-lactate ( a ) and in AF tissue extract derived from the rabbit functional spine unit (FSU) culture 3days post injection of 5l of 40mM 13 C-lactate into the NP region of the disc ( b ). Intracellular enrichment of 13 C lactate or 13 C pyruvate AF cells from AF cell culture or AF tissue of the ex vivo disc organ culture is reported as atomic percent excess (APE) of the total amount of lactate or pyruvate, e.g., 10% APE of pyruvate indicates 10% of total pyruvate contains 13 C. Percent (%) APE shown (M+1) indicates that one 13 C carbon is present. c , Schematic of gene expression and assembly of lactate dehydrogenase (LDH), the primary enzyme that catalyzes the interconversion of lactate and pyruvate. LDH exists in five isozymes composed of a tetramer of M and H protein subunits encoded by the LDHA and LDHB genes, respectively. LDH5, composed of four M subunits, preferentially converts pyruvate to lactate while LDH1, consisting of four H subunits, preferentially converts lactate to pyruvate. Western blot of LDHM ( d ) and LDHH ( e ) in rabbit AF and NP tissue protein extract and their protein levels were quantified by normalizing to -actin as loading control (graphs). Data are means SD of four independent experiments (four rabbits). * p
- Submitted by
- Invitrogen Antibodies (provider)
- Main image
- Experimental details
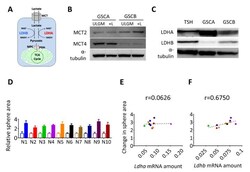
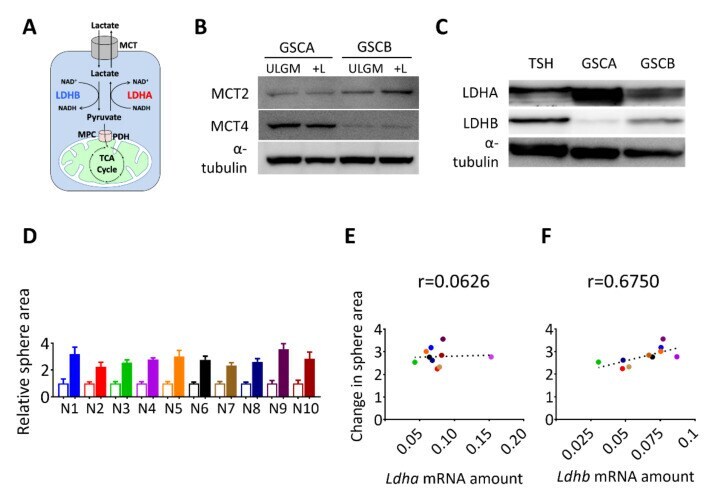
- Figure 2 Expression of lactate dehydrogenase B (LDHB) correlates with the rescue effect of lactate in glucose-deprived GSCs. ( A ) Schematic representation of lactate uptake and lactate-pyruvate interconversion. ( B ) Immunoblot analysis of monocarboxylate transporter 2 (MCT2), MCT4, and alpha-tubulin (loading control) in GSC cell lines (GSCA and GSCB) cultured in ULGM or ULGM supplemented with 4 mM lactate (+L). ( C ) Immunoblot analysis of LDHA and LDHB in GSC cell lines (GSCA, GSCB, and TSH) cultured in normal medium. ( D ) Relative sphere area for TSH-derived clones (N1-N10) cultured for 7 days in ULGM (open bars) or ULGM supplemented with 4 mM lactate (filled bars). ( E , F ) Correlation plots of Ldha ( E ) or Ldhb ( F ) mRNA levels and lactate-induced sphere growth determined as in ( D ) for TSH clones N1 to N10. Quantitative data are means +- SD for 10-12 spheres from one representative experiment and were subjected to Pearson correlation ( r ) analysis.
- Submitted by
- Invitrogen Antibodies (provider)
- Main image
- Experimental details
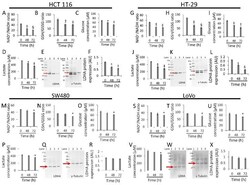
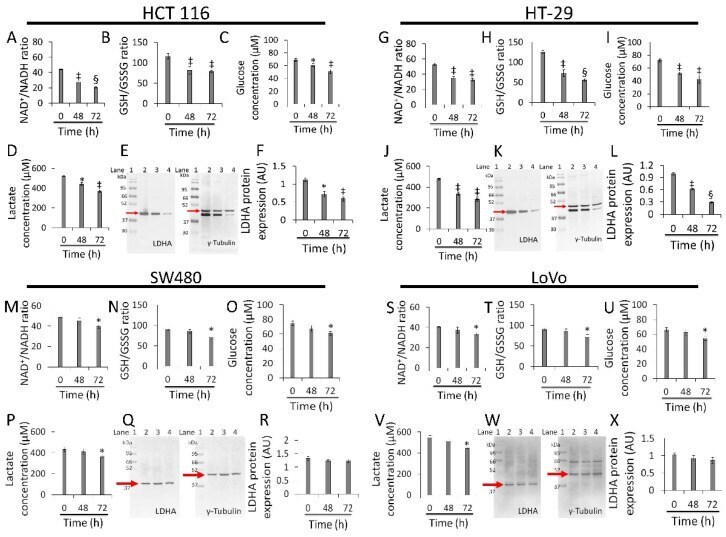
- Figure 5 Whey affects energy metabolism in CRC cells. The effects of whey on NAD+/NADH, GSH/GSSG, glucose uptake, lactate production, and LDHA protein expression levels were detected on ( A - F ) HCT 116, ( G - L ) HT-29, ( M - R ) SW480 and ( S - X ) LoVo cells. Cells were treated with whey 40% v / v . Lane 1 = molecular markers; Lane 2 = 0 h; lane 3 = 48 h; lane 4 = 72 h. LDHA protein expression was determined, after normalization with gamma-tubulin as internal control, with ImageJ software and values expressed as arbitrary units (AU). * p < 0.05 vs. 0 h; ++ p < 0.01 vs. 0 h; SS p < 0.001 vs. 0 h.
- Submitted by
- Invitrogen Antibodies (provider)
- Main image
- Experimental details
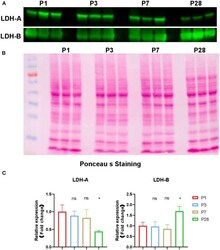
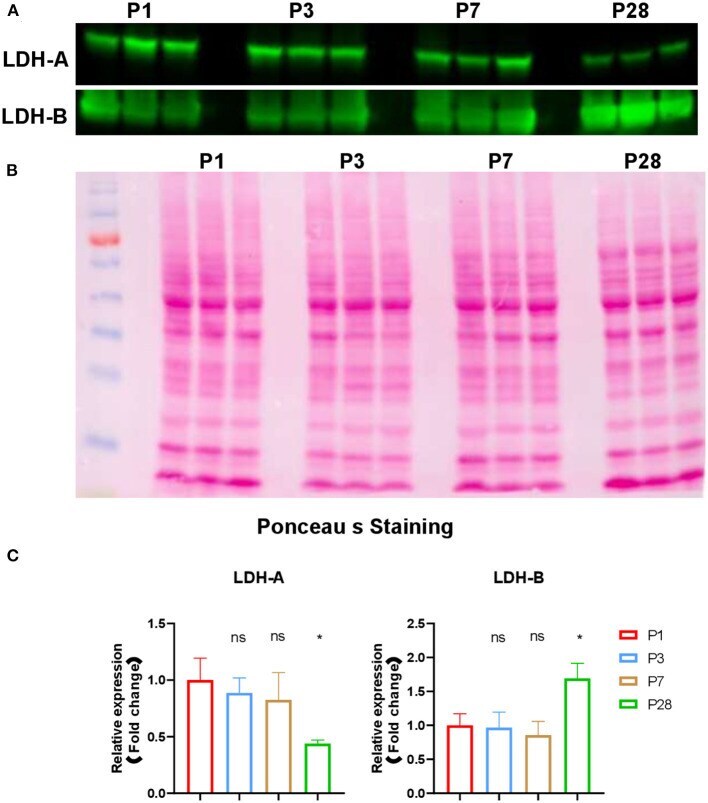
- Figure 5 Expression of LDHA and LDHB in neonatal pig hearts. (A) Western blot analysis of expression of LDHA and LDHB in in the four sets of heart samples (P1, P3, P7, and P28 hearts, n = 3 hearts per age). (B) Ponceau S staining of the blot to confirm equal protein loading. (C) Quantification of band intensity by western blot via densitometric analysis. * p < 0.05; one-way ANOVA with Tukey's Honestly Significant Difference Test.
- Submitted by
- Invitrogen Antibodies (provider)
- Main image
- Experimental details
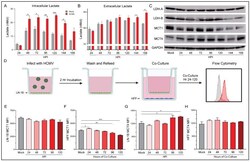
- Figure 6 HCMV-associated alterations to lactate dynamics. Lactate concentration was determined in the ( A ) extracellular and the ( B ) intracellular compartment of mock- or HCMV-infected LN-18 cells using a colorimetric L-lactate assay kit with a standard. ( C ) Protein expression of prominent lactate regulators LDH-A, LDH-B, MCT1, and MCT4 were examined following infection using Western blot assays. ( D ) Schematic of co-culture experiment in which HCMV-infected LN-18 cells were co-cultured, but physically separated from, HFF cells using Transwells with 0.4 mum pores in 6-well culture dishes. At indicated points post infection, cells were collected separately and processed by flow cytometry for expression of MCT1 ( E , F ) and MCT4 ( G , H ) in infected LN-18 and non-infected HFF cells respectively. Graphs represent pooled data from three independent experiments. Mean +- the SEM of at least 3 triplicates. *, p < 0.05; **, p < 0.01; ***, p < 0.001. Created with BioRender.com.
