Explore
 Validate
 Learn
Learn Flow cytometry
Antibody data
- Antibody Data
- Antigen structure
- References [8]
- Comments [0]
- Validations
- Flow cytometry [1]
- Other assay [6]
Submit
Validation data
Reference
Comment
Report error
- Product number
- 50-0759-42 - Provider product page

- Provider
- Invitrogen Antibodies
- Product name
- CD75 Monoclonal Antibody (LN-1), eFluor™ 660, eBioscience™
- Antibody type
- Monoclonal
- Antigen
- Other
- Description
- Description: This LN-1 monoclonal antibody reacts with human CD75, a cell surface carbohydrate determinant produced by alpha-2,6-sialytransferase. CD75 is expressed predominantly on mature B cells in peripheral blood and germinal centers, as well as several B cell lines (e.g., Raji, Ramos). CD75 is also expressed on non-immune tissues such as breast, prostate, colon, liver, and kidney. Reports demonstrate that CD75 is a ligand of CD22. Studies have shown that, depending on fixation and tissue processing, the LN-1 antibody also recognizes astrocytes and microglia in the human brain. Applications Reported: This LN-1 antibody has been reported for use in flow cytometric analysis. Applications Tested: This LN-1 antibody has been pre-titrated and tested by flow cytometric analysis of normal human peripheral blood cells. This can be used at 5 µL (0.25 µg) per test. A test is defined as the amount (µg) of antibody that will stain a cell sample in a final volume of 100 µL. Cell number should be determined empirically but can range from 10^5 to 10^8 cells/test. eFluor® 660 is a replacement for Alexa Fluor® 647. eFluor® 660 emits at 659 nm and is excited with the red laser (633 nm). Please make sure that your instrument is capable of detecting this fluorochome. Excitation: 633-647 nm; Emission: 668 nm; Laser: Red Laser. Filtration: 0.2 µm post-manufacturing filtered.
- Reactivity
- Human
- Host
- Mouse
- Isotype
- IgM
- Antibody clone number
- LN-1
- Vial size
- 100 Tests
- Concentration
- 5 µL/Test
- Storage
- 4° C, store in dark, DO NOT FREEZE!
Submitted references Probing the signaling requirements for naive human pluripotency by high-throughput chemical screening.
Identification of ALPPL2 as a Naive Pluripotent State-Specific Surface Protein Essential for Human Naive Pluripotency Regulation.
Derivation of trophoblast stem cells from naïve human pluripotent stem cells.
Comprehensive Cell Surface Protein Profiling Identifies Specific Markers of Human Naive and Primed Pluripotent States.
The B lymphocyte surface antigen CD75 is not an alpha-2,6-sialyltransferase but is a carbohydrate antigen, the production of which requires the enzyme.
The B lymphocyte adhesion molecule CD22 interacts with leukocyte common antigen CD45RO on T cells and alpha 2-6 sialyltransferase, CD75, on B cells.
Astrocytes and microglia in human brain share an epitope recognized by a B-lymphocyte-specific monoclonal antibody (LN-1).
Two new monoclonal antibodies (LN-1, LN-2) reactive in B5 formalin-fixed, paraffin-embedded tissues with follicular center and mantle zone human B lymphocytes and derived tumors.
Khan SA, Park KM, Fischer LA, Dong C, Lungjangwa T, Jimenez M, Casalena D, Chew B, Dietmann S, Auld DS, Jaenisch R, Theunissen TW
Cell reports 2021 Jun 15;35(11):109233
Cell reports 2021 Jun 15;35(11):109233
Identification of ALPPL2 as a Naive Pluripotent State-Specific Surface Protein Essential for Human Naive Pluripotency Regulation.
Bi Y, Tu Z, Zhang Y, Yang P, Guo M, Zhu X, Zhao C, Zhou J, Wang H, Wang Y, Gao S
Cell reports 2020 Mar 17;30(11):3917-3931.e5
Cell reports 2020 Mar 17;30(11):3917-3931.e5
Derivation of trophoblast stem cells from naïve human pluripotent stem cells.
Dong C, Beltcheva M, Gontarz P, Zhang B, Popli P, Fischer LA, Khan SA, Park KM, Yoon EJ, Xing X, Kommagani R, Wang T, Solnica-Krezel L, Theunissen TW
eLife 2020 Feb 12;9
eLife 2020 Feb 12;9
Comprehensive Cell Surface Protein Profiling Identifies Specific Markers of Human Naive and Primed Pluripotent States.
Collier AJ, Panula SP, Schell JP, Chovanec P, Plaza Reyes A, Petropoulos S, Corcoran AE, Walker R, Douagi I, Lanner F, Rugg-Gunn PJ
Cell stem cell 2017 Jun 1;20(6):874-890.e7
Cell stem cell 2017 Jun 1;20(6):874-890.e7
The B lymphocyte surface antigen CD75 is not an alpha-2,6-sialyltransferase but is a carbohydrate antigen, the production of which requires the enzyme.
Munro S, Bast BJ, Colley KJ, Tedder TF
Cell 1992 Mar 20;68(6):1003
Cell 1992 Mar 20;68(6):1003
The B lymphocyte adhesion molecule CD22 interacts with leukocyte common antigen CD45RO on T cells and alpha 2-6 sialyltransferase, CD75, on B cells.
Stamenkovic I, Sgroi D, Aruffo A, Sy MS, Anderson T
Cell 1991 Sep 20;66(6):1133-44
Cell 1991 Sep 20;66(6):1133-44
Astrocytes and microglia in human brain share an epitope recognized by a B-lymphocyte-specific monoclonal antibody (LN-1).
Dickson DW, Mattiace LA
The American journal of pathology 1989 Jul;135(1):135-47
The American journal of pathology 1989 Jul;135(1):135-47
Two new monoclonal antibodies (LN-1, LN-2) reactive in B5 formalin-fixed, paraffin-embedded tissues with follicular center and mantle zone human B lymphocytes and derived tumors.
Epstein AL, Marder RJ, Winter JN, Fox RI
Journal of immunology (Baltimore, Md. : 1950) 1984 Aug;133(2):1028-36
Journal of immunology (Baltimore, Md. : 1950) 1984 Aug;133(2):1028-36
No comments: Submit comment
Supportive validation
- Submitted by
- Invitrogen Antibodies (provider)
- Main image

- Experimental details
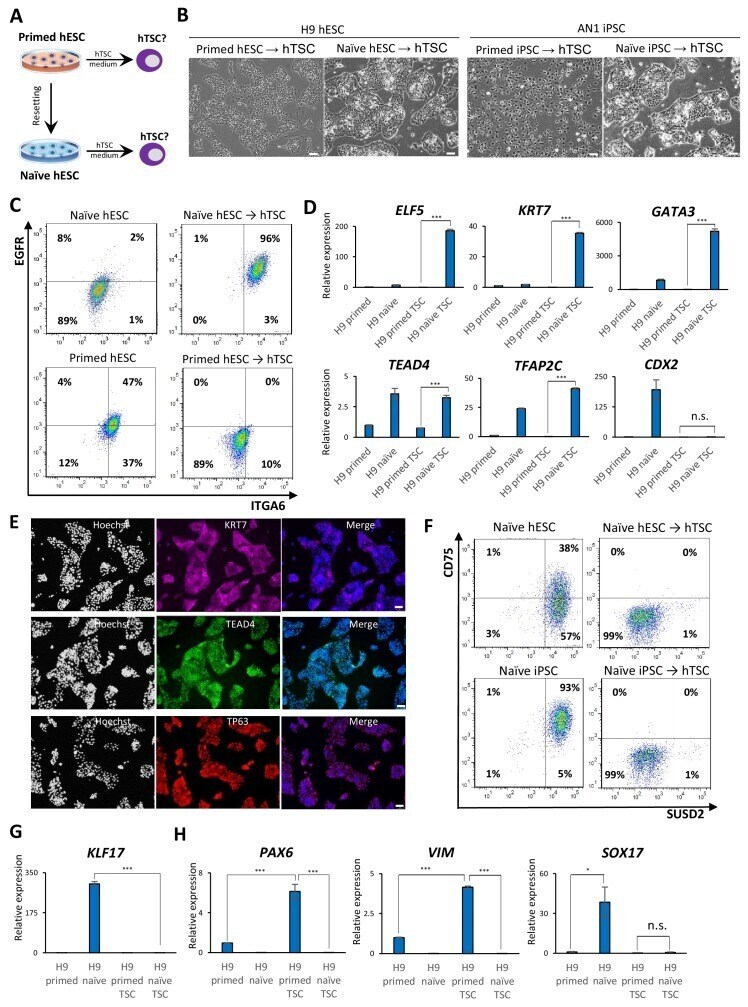
- Staining of normal human peripheral blood cells with Anti-Human CD19 FITC (Product # 11-0199-42) and Mouse IgM Isotype Control eFluor® 660 (Product # 50-4752-82) (left) or Anti-Human CD75 eFluor® 660 (right). Cells in the lymphocyte gate were used for analysis.
Supportive validation
- Submitted by
- Invitrogen Antibodies (provider)
- Main image
- Experimental details
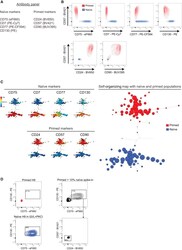
- Figure 3 An Antibody Panel to Distinguish between Naive-State and Primed-State Human PSCs (A) A list of antibodies that are combined to form a multiplexed panel. The information in brackets shows the fluorophore conjugation of each antibody. See Table S4 for antibody details and Table S5 for flow cytometer parameters. (B) Flow cytometry contour plots of pairwise antibody combinations. The primed-specific marker CD57 is on the y axes, and different naive-specific (top) and primed-specific (bottom) markers are on the x axes. Primed (red) and t2i/L+PKCi-cultured naive (blue) H9 PSCs are shown for each antibody combination. See Figure S4 A for flow cytometry plots that exemplify a typical complete gating scheme for H9 naive PSCs. Note that CD77 shows a greater degree of heterogeneity in naive PSCs compared with the other markers but is still useful when used in combination. (C) FlowSOM visualization of flow cytometry data for all antibodies in the panel. An unsupervised self-organizing map arranges the cells into clusters (represented by circles) according to similarities in their cell surface protein expression profiles (right). Overlaying the identity of the cell type within each cluster reveals a clear separation of naive (blue) and primed (red) populations. The heatmap panels (left) show the expression level of each cell surface protein in the cell clusters. Clusters are arranged in the same position as for the minimal spanning tree of the self-organizing map. See Figures S4

- Submitted by
- Invitrogen Antibodies (provider)
- Main image

- Experimental details
- Figure 4 Cell Surface Protein Expression Levels Track the Dynamics of Naive-to-Primed PSC Transition (A) Overview of the experimental design. Shown is a time course experiment of PSCs undergoing a transition from the naive state to the primed state, with flow cytometry analysis every 48 hr. (B) Phase contrast images of H9 PSCs reveal the morphological changes that occur during naive state-to-primed state transition under t2i/L+PKCi conditions. Scale bars, 100 mum. (C) Flow cytometry dotplots of pairwise antibody combinations over the time course. Shown are primed-specific markers on the y axis (CD57, top; CD90, bottom) and naive-specific markers on the x axis (CD75, top; CD130, bottom). (D) FlowSOM visualization of the flow cytometry time course data for H9 PSCs. The minimal spanning tree of the self-organizing map displays an unsupervised clustering of the samples based on their cell surface protein expression levels (right). The results reveal a progressive change in cell surface protein expression during conversion from the naive state to the primed state. The heatmap shows the expression level of each cell surface protein marker in the cell clusters (left).

- Submitted by
- Invitrogen Antibodies (provider)
- Main image

- Experimental details
- Figure 5 Monitoring the Dynamics of Primed-State to Naive-State PSC Conversion Using Cell Surface Protein Markers (A) Phase contrast images of H9 PSCs reveal the morphological changes that occur during primed-state to naive-state conversion under t2i/L+PKCi conditions. Doxycycline-inducible NANOG and KLF2 transgenes were activated for the first 8 days in t2i/L, and then doxycycline was withdrawn and PKCi was added. Scale bars, 100 mum. (B) Flow cytometry dotplots of pairwise antibody combinations over the time course. Shown are primed-specific markers on the y axis (CD57, top; CD24, bottom) and naive-specific markers on the x axis (CD75, top; CD130, bottom). (C and D) FlowSOM visualization of the flow cytometry time course data for (C) H9 PSCs under t2i/L+PKCi conditions and (D) WIBR3 under 5i/L/A conditions. Note that 5i/L/A conversion is transgene-free and that 5i/L/A was added on day 1. The minimal spanning trees of the self-organizing maps display an unsupervised clustering of the samples based on their cell surface protein expression levels (right). The heatmap shows the expression level of each cell surface protein marker in the cell clusters (left).

- Submitted by
- Invitrogen Antibodies (provider)
- Main image

- Experimental details
- Figure 6 Prospective Isolation of Early-Stage Naive Cells (A) Flow cytometry dotplots of day 10 cells during primed-state to naive-state conversion of H9 PSCs under t2i/L+PKCi conditions. Left: the levels of two naive-specific markers, CD75 and CD77. Based on unstained, live, human day 10 samples, three cell sorting gates have been drawn that correspond to CD75 + /CD77 + (green box), CD75 - /CD77 + (orange box), and CD75 - /CD77 - (purple box) cell populations. Right: the levels of CD7 and CD130 proteins for the same three gated cell populations. Boxed areas indicate the N4 + (green), N3 + (orange), and N4 - (purple) cell populations that were used for subsequent experiments. The percentage of cells within each cell sorting gate relative to all live, human cells is shown. Note that the values do not take into account additional gates; for example, to exclude primed-state markers. See Figure S5 C for the N min gating strategy. (B) FlowSOM visualization of the flow cytometry data for day 10 cells during primed to naive conversion. The minimal spanning tree of the self-organizing map displays an unsupervised clustering of the sample based on the cell surface protein expression levels (right). The cells corresponding to each cell sorting population, N4 + , N3 + , and N4 - , are indicated. The heatmap shows the expression level of each cell surface protein marker in the cell clusters (left). See Figure S5 A for FlowSOM visualization of WIBR3 PSCs on day 10 of primed state-to-naive

- Submitted by
- Invitrogen Antibodies (provider)
- Main image
- Experimental details
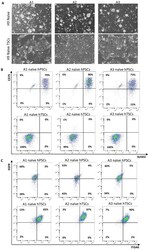
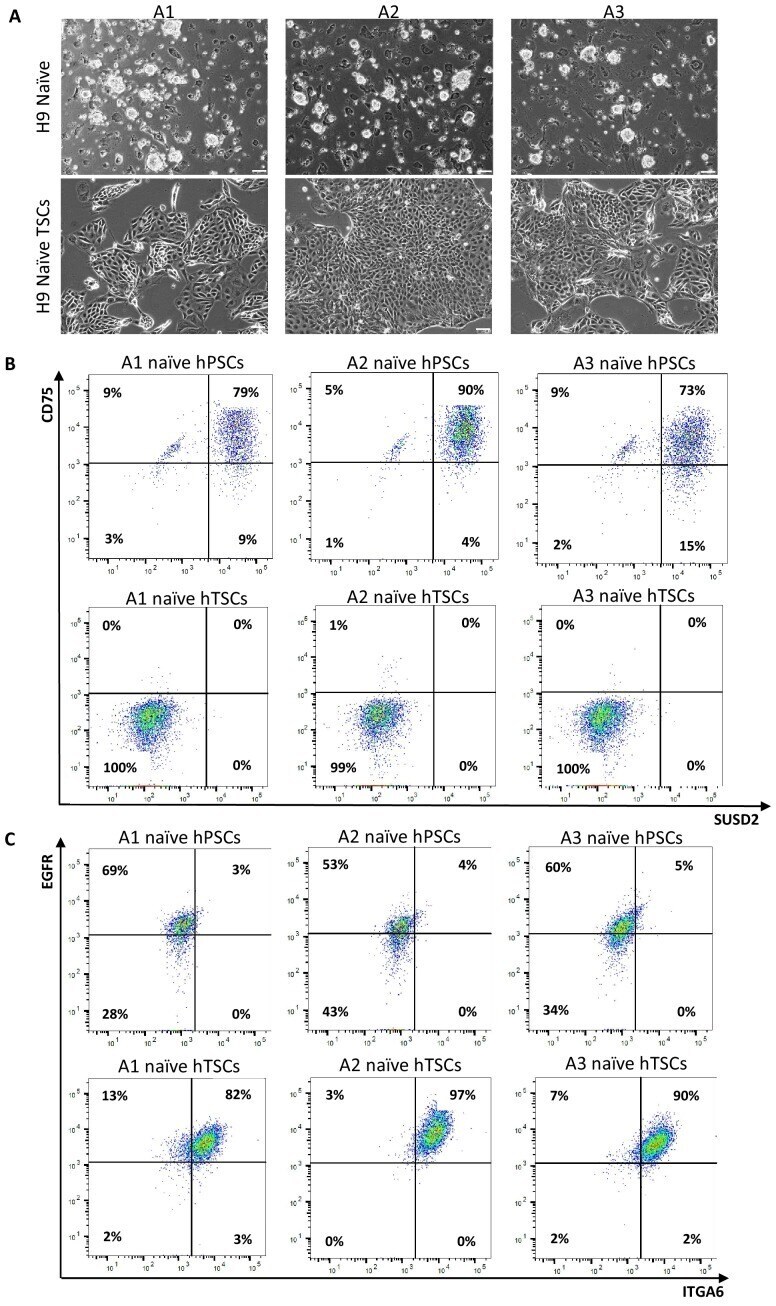
- Figure 2--figure supplement 2. Derivation of naive hTSCs from clonally expanded naive hPSCs. ( A ) Phase contrast images of single-cell expanded H9 naive hPSC clones A1, A2, and A3 (top), and naive hTSCs derived from A1, A2, and A3 naive hPSCs (bottom). The scale bars indicate 75 mum. ( B ) Flow cytometry analysis for naive hPSC markers SUSD2 and CD75 in A1, A2, and A3 naive hPSCs (top) and A1, A2, and A3 naive hTSCs (bottom). ( C ) Flow cytometry analysis for TSC markers ITGA6 and EGFR in A1, A2, and A3 naive hPSCs (top) and A1, A2, and A3 naive hTSCs (bottom).
- Submitted by
- Invitrogen Antibodies (provider)
- Main image
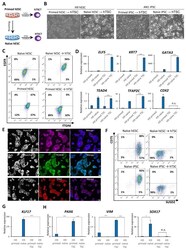
- Experimental details
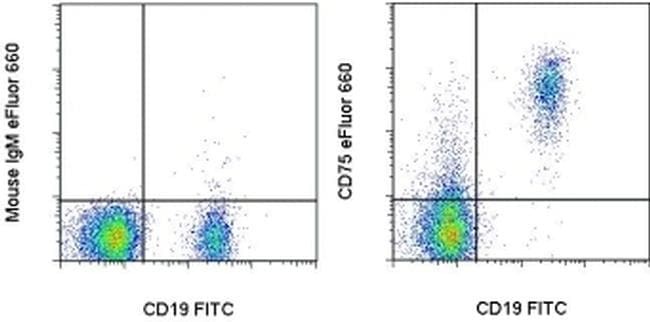
- Figure 2. Examining the response of naive and primed hPSCs to conditions for hTSC derivation. ( A ) The experimental scheme for deriving hTSCs from primed and naive hPSCs. ( B ) Phase contrast images of H9 and AN_1.1 hTSC-like cells derived from naive hPSCs, as well as H9 and AN_1.1 primed hPSCs following culture in hTSC medium. All H9 cells were at passage 8, and all AN_1.1 cells were at passage 10. The scale bars indicate 75 mum. ( C ) Flow cytometry analysis for TSC markers ITGA6 and EGFR in H9 naive hPSCs, H9 hTSC-like cells derived from naive hPSCs, H9 primed hPSCs, and H9 primed hPSCs cultured in hTSC medium. ( D ) Quantitative gene expression analysis for trophoblast marker genes ELF5, KRT7, GATA3, TFAP2C, TEAD4, and CDX2 in H9 primed and naive hPSCs, H9 hTSC-like cells derived from naive hPSCs, and H9 primed hPSCs cultured in hTSC medium. Error bars indicate +-1 SD of technical replicates. '***' indicates a p-value