Explore
 Validate
 Learn
Learn Western blot
 Immunocytochemistry
Antibody data
- Antibody Data
- Antigen structure
- References [1]
- Comments [0]
- Validations
- Immunocytochemistry [7]
- Immunohistochemistry [1]
- Other assay [2]
Submit
Validation data
Reference
Comment
Report error
- Product number
- PA5-21415 - Provider product page

- Provider
- Invitrogen Antibodies
- Product name
- TAP Polyclonal Antibody
- Antibody type
- Polyclonal
- Antigen
- Recombinant full-length protein
- Description
- Recommended positive controls: HeLa, HepG2, Molt-4. Predicted reactivity: Mouse (87%), Rat (90%), Pig (83%), Chimpanzee (100%). Store product as a concentrated solution. Centrifuge briefly prior to opening the vial.
- Reactivity
- Human
- Host
- Rabbit
- Isotype
- IgG
- Vial size
- 100 μL
- Concentration
- 0.3 mg/mL
- Storage
- Store at 4°C short term. For long term storage, store at -20°C, avoiding freeze/thaw cycles.
Submitted references HIV-1 and M-PMV RNA Nuclear Export Elements Program Viral Genomes for Distinct Cytoplasmic Trafficking Behaviors.
Pocock GM, Becker JT, Swanson CM, Ahlquist P, Sherer NM
PLoS pathogens 2016 Apr;12(4):e1005565
PLoS pathogens 2016 Apr;12(4):e1005565
No comments: Submit comment
Supportive validation
- Submitted by
- Invitrogen Antibodies (provider)
- Main image
- Experimental details
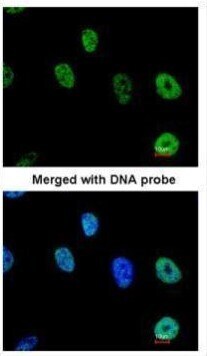
- Immunofluorescent analysis of TAP in paraformaldehyde-fixed HeLa cells using a TAP polyclonal antibody (Product # PA5-21415) at a 1:200 dilution.
- Submitted by
- Invitrogen Antibodies (provider)
- Main image
- Experimental details
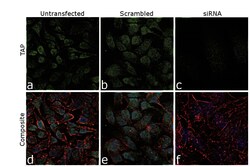
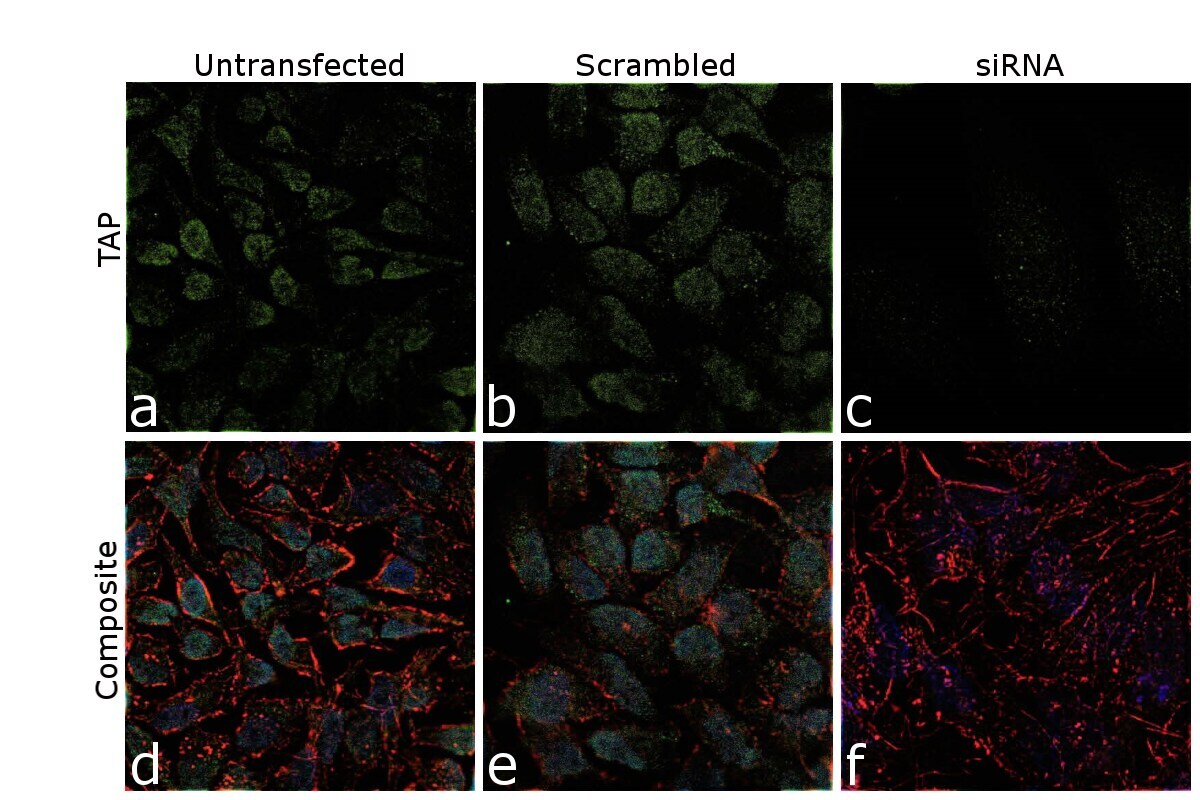
- Knockdown of TAP was achieved by transfecting HeLa cells with TAP specific siRNA (Silencer® select Product # S35502, S20533). Immunofluorescence analysis was performed on untransfected HeLa cells (panels a,d), transfected with non-specific scrambled siRNA (panels b,e) and transfected with TAP specific siRNA (panels c,f). Cells were fixed, permeabilized, and labelled with TAP Polyclonal Antibody (Product # PA5-21415), (1:100 dilution) followed by Donkey anti-Rabbit IgG (H+L) Highly Cross-Adsorbed Secondary Antibody, Alexa Fluor Plus 488 (Product # A32790, 1:2,000 dilution). Nuclei (blue) were stained with SlowFade® Gold Antifade Mountant with DAPI (Product # S36938), and Rhodamine Phalloidin (Product # R415, 1:300) was used for cytoskeletal F-actin (Red) staining. Partial reduction of specific signal was observed upon siRNA mediated knockdown (panels c,f) confirming specificity of the antibody to TAP (Green). The Images were captured at 60X magnification with oil immersion.

- Submitted by
- Invitrogen Antibodies (provider)
- Main image

- Experimental details
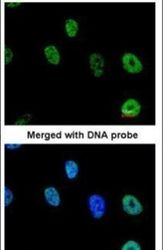
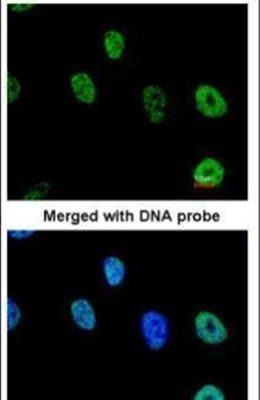
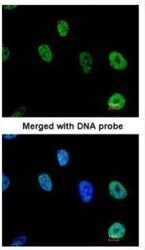
- Immunofluorescence analysis of paraformaldehyde-fixed HeLa, using TAP (Product # PA5-21415) antibody at 1:200 dilution.

- Submitted by
- Invitrogen Antibodies (provider)
- Main image
- Experimental details
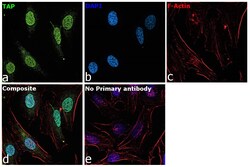
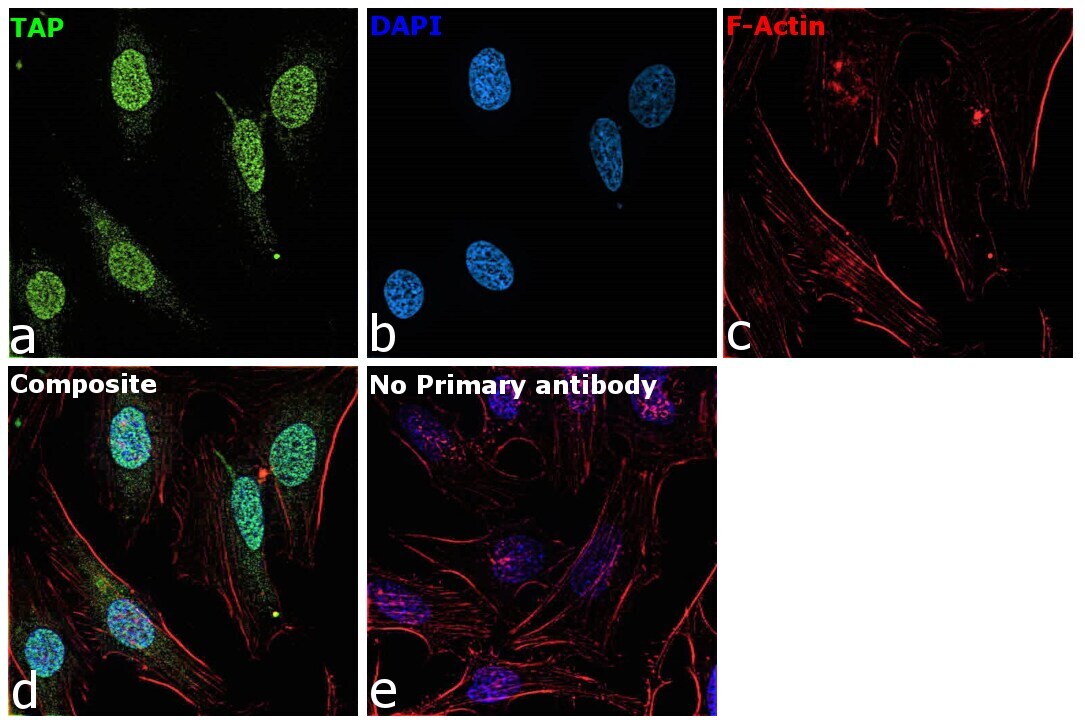
- Immunofluorescence analysis of TAP was performed using HeLa cells. The cells were fixed with 4% paraformaldehyde for 10 minutes, permeabilized with 0.1% Triton™ X-100 for 15 minutes and blocked with 2% BSA for 1 hour at room temperature. The cells were labeled with Anti-TAP Polyclonal Antibody (Product # PA5-21415) at 1:50 dilution in 0.1% BSA and incubated overnight at 4 degree and then labeled with Donkey anti-Rabbit IgG (H+L) Highly Cross-Adsorbed Secondary Antibody, Alexa Fluor Plus 488 (Product # A32790) at a dilution of 1:2000 for 45 minutes at room temperature (Panel a: green). Nuclei (Panel b: blue) were stained with ProLong™ Diamond Antifade Mountant with DAPI (Product # P36962). F-actin (Panel c: red) was stained with Rhodamine Phalloidin (Product # R415, 1:300). Panel d represents the composite image showing Nuclear with slight cytosolic localization of TAP in HeLa cells. Panel e represents control cells with no primary antibody to assess background. The images were captured at 60X magnification with oil immersion.

- Submitted by
- Invitrogen Antibodies (provider)
- Main image

- Experimental details
- Knockdown of TAP was achieved by transfecting HeLa cells with TAP specific siRNA (Silencer® select Product # S35502, S20533). Immunofluorescence analysis was performed on untransfected HeLa cells (panels a,d), transfected with non-specific scrambled siRNA (panels b,e) and transfected with TAP specific siRNA (panels c,f). Cells were fixed, permeabilized, and labelled with TAP Polyclonal Antibody (Product # PA5-21415), (1:100 dilution) followed by Donkey anti-Rabbit IgG (H+L) Highly Cross-Adsorbed Secondary Antibody, Alexa Fluor Plus 488 (Product # A32790, 1:2,000 dilution). Nuclei (blue) were stained with SlowFade® Gold Antifade Mountant with DAPI (Product # S36938), and Rhodamine Phalloidin (Product # R415, 1:300) was used for cytoskeletal F-actin (Red) staining. Partial reduction of specific signal was observed upon siRNA mediated knockdown (panels c,f) confirming specificity of the antibody to TAP (Green). The Images were captured at 60X magnification with oil immersion.
- Submitted by
- Invitrogen Antibodies (provider)
- Main image
- Experimental details
- Immunofluorescence analysis of paraformaldehyde-fixed HeLa, using TAP (Product # PA5-21415) antibody at 1:200 dilution.
- Submitted by
- Invitrogen Antibodies (provider)
- Main image

- Experimental details
- Immunofluorescence analysis of TAP was performed using HeLa cells. The cells were fixed with 4% paraformaldehyde for 10 minutes, permeabilized with 0.1% Triton™ X-100 for 15 minutes and blocked with 2% BSA for 1 hour at room temperature. The cells were labeled with Anti-TAP Polyclonal Antibody (Product # PA5-21415) at 1:50 dilution in 0.1% BSA and incubated overnight at 4 degree and then labeled with Donkey anti-Rabbit IgG (H+L) Highly Cross-Adsorbed Secondary Antibody, Alexa Fluor Plus 488 (Product # A32790) at a dilution of 1:2000 for 45 minutes at room temperature (Panel a: green). Nuclei (Panel b: blue) were stained with ProLong™ Diamond Antifade Mountant with DAPI (Product # P36962). F-actin (Panel c: red) was stained with Rhodamine Phalloidin (Product # R415, 1:300). Panel d represents the composite image showing Nuclear with slight cytosolic localization of TAP in HeLa cells. Panel e represents control cells with no primary antibody to assess background. The images were captured at 60X magnification with oil immersion.
Supportive validation
- Submitted by
- Invitrogen Antibodies (provider)
- Main image
- Experimental details
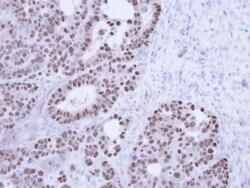
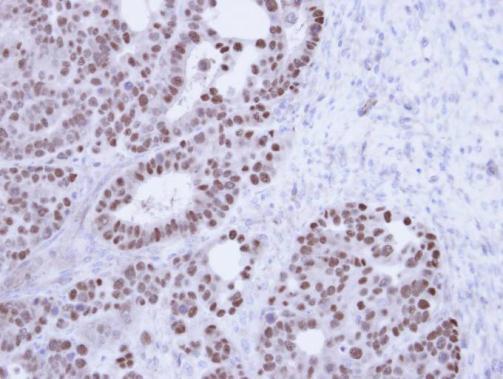
- Immunohistochemical analysis of paraffin-embedded NCIN87 Xenograft , using TAP (Product # PA5-21415) antibody at 1:100 dilution. Antigen Retrieval: EDTA based buffer, pH 8.0, 15 min.
Supportive validation
- Submitted by
- Invitrogen Antibodies (provider)
- Main image
- Experimental details
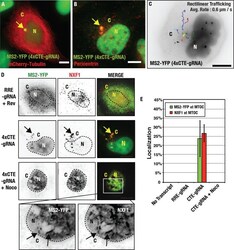
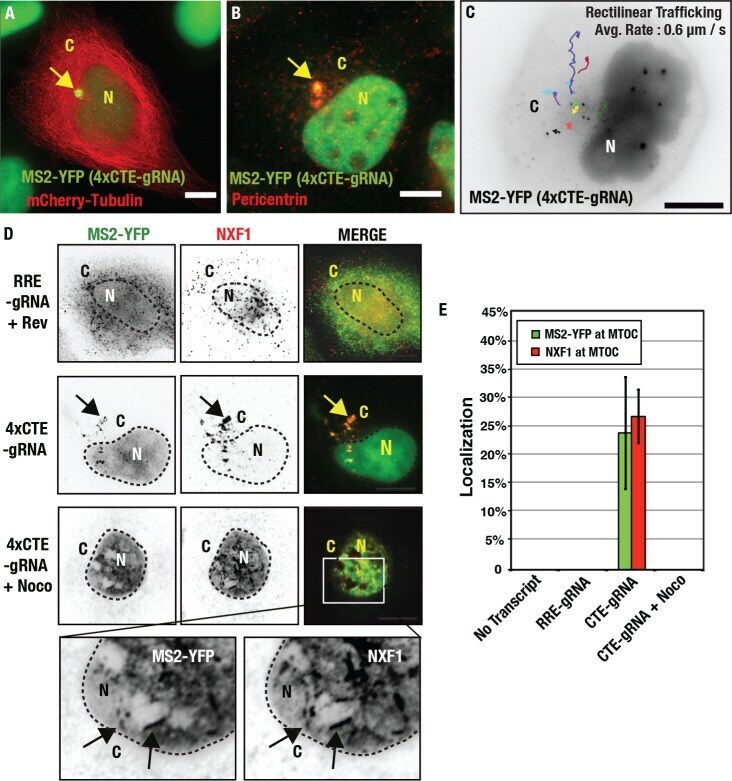
- Fig 4 CTE-gRNAs accumulate at the microtubule organizing center. (A, B). 4xCTE-gRNAs in HeLa.MS2-YFP cells cluster at the MTOC as demonstrated by co-expressing mCherry-Tubulin (A) or staining for the centrosomal marker Pericentrin (B) . Arrows highlight the marked enrichment of CTE-gRNAs to this region. (C) Single particle tracking over 10 minutes for 4xCTE-gRNAs undergoing bidirectional and rectilinear trafficking at or near the MTOC. Arrows represent individual gRNA paths over the time of imaging. Figure corresponds to S4 Movie . (D) NXF1 traffics with 4xCTE-gRNAs to the MTOC. Cells expressing RRE- or 4xCTE-gRNAs were incubated with or without 3 muM nocodazole (as indicated) for 36 h prior to fixation and detection of NXF1 using indirect immunofluorescence. Black arrows indicate regions of co-localization between NXF1 and 4xCTE-gRNAs (E) Quantification of MS2-YFP and NXF1 localization at the MTOC for the indicated conditions. For these experiments the MTOC was defined using Pericentrin immunostaining. Error bars represent the standard deviation of the mean for three (MS2-YFP, n = 50) or two (NXF1, n = 50) independent experiments. All size bars correspond to 10 mum.
- Submitted by
- Invitrogen Antibodies (provider)
- Main image
- Experimental details
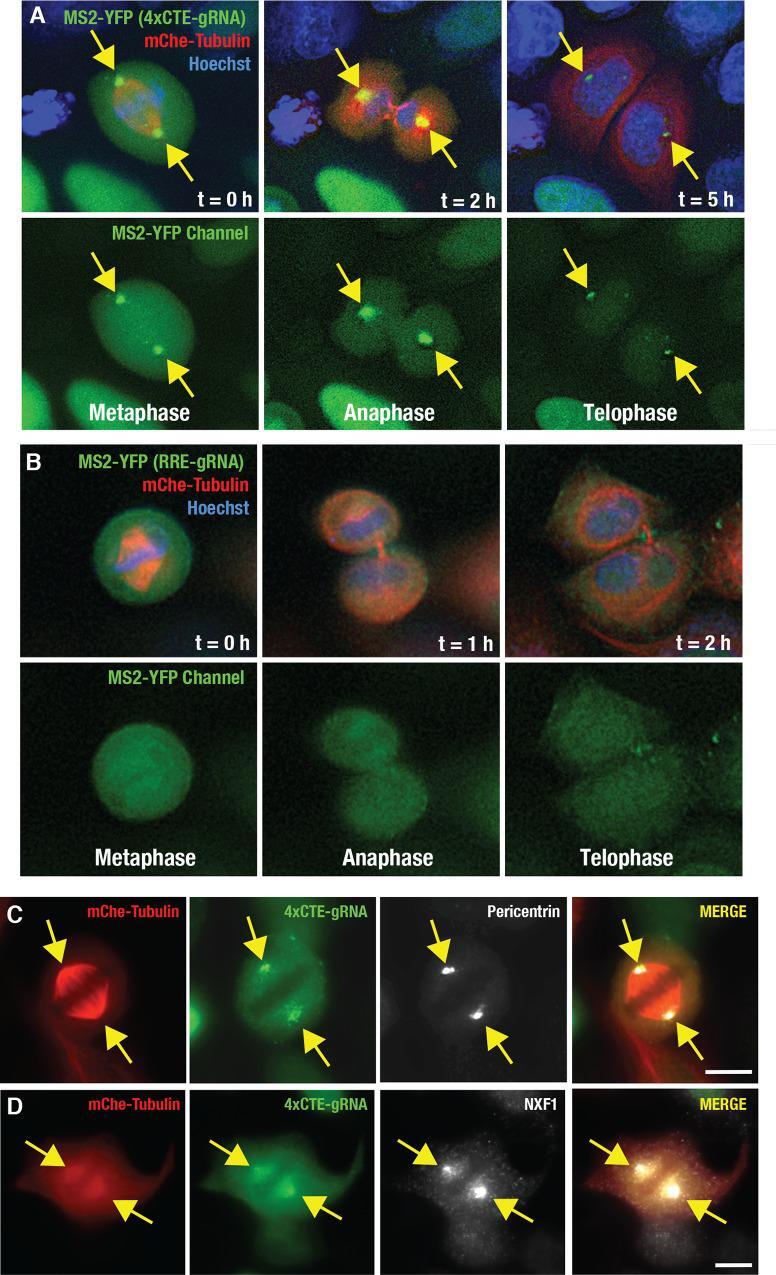
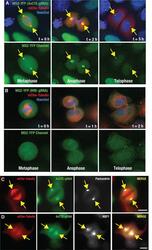
- Fig 5 CTE-gRNAs accumulate at centrosomes during mitosis and are subsequently partitioned to daughter cells. (A) 4xCTE-gRNAs are partitioned to daughter cells via centrosomes during cell division. A representative HeLa.MS2-YFP cell expressing 4xCTE-gRNAs and tracked through metaphase, anaphase, and telophase. Yellow arrows indicate the enriched MS2-YFP signal (green) at the spindle poles (mCherry-tubulin in red) during metaphase (Hoechst DNA stain in blue). Figure corresponds to S5 Movie . (B) Unlike 4xCTE-gRNAs, RRE-gRNAs do not accumulate at the mitotic spindle. Imaging as for (A) but for cells co-expressing RRE-gRNAs and Rev. (C,D) 4xCTE-gRNAs (MS2-YFP; green) co-localize with the centrosome marker Pericentrin (C, white) and also NXF1 (D, white) at the poles of the spindle (shown using mCherry-tubulin, red). Pericentrin and NXF1 were detected by indirect immunofluorescence. For all panels, yellow arrows highlight 4xCTE-gRNA enrichment at the centrosome. Size bars represent 10 mum.