Explore
 Validate
 Learn
Learn Western blot
 ELISA
ELISA Immunohistochemistry
Antibody data
- Antibody Data
- Antigen structure
- References [32]
- Comments [0]
- Validations
- ELISA [1]
- Immunocytochemistry [2]
- Other assay [25]
Submit
Validation data
Reference
Comment
Report error
- Product number
- MA3-16888 - Provider product page

- Provider
- Invitrogen Antibodies
- Product name
- Aggrecan Monoclonal Antibody (BC-3)
- Antibody type
- Monoclonal
- Antigen
- Synthetic peptide
- Description
- Purified recombinant Aggrecan Interglobular Domain (IGD) protein (Amino acids T331-G458 with C-term His-tag, expressed in E. coli), was used to validate this antibody. The recombinant protein contains cleavage sites for aggrecanases (E373-A374 in aggrecan) and matrix metalloproteinases (N341-F342 in aggrecan). The recombinant protein was cleaved in vitro using recombinant Aggrecanase. Degradation of IGD and accumulation of cleaved fragments was visualized via MEMCode reversible protein staining, followed by Western Blot using the BC-3 antibody for the specific detection of the aggrecan neoepitope. The antibody will also recognize full length IGD, as shown by ELISA, however with significantly lower affinity. MA3-16888 has successfully been used in ELISA, immunohistochemistry (frozen and FFPE) and Western blot applications. This antibody may be used to immunostain formalin-fixed, paraffin-embedded sections, as well as alcohol-fixed frozen sections and un-fixed snap frozen sections. Samples must be deglycosylated using 0.01 Units Chondroitinase ABC, 0.01 Units Keratanase and 0.0001 Units Keratanase II per 10 µg S-GAG of non-deglycosylated aggrecan for optimal epitope recognition. MA3-16888 detects aggrecan in human, bovine, feline, canine, guinea pig, equine, porcine, rabbit, rat, and sheep samples.
- Reactivity
- Human, Rat, Bovine, Canine, Feline, Guinea Pig, Porcine, Rabbit
- Host
- Mouse
- Isotype
- IgG
- Antibody clone number
- BC-3
- Vial size
- 100 μg
- Concentration
- 1 mg/mL
- Storage
- -20°C
Submitted references circPhc3 sponging microRNA‑93‑3p is involved in the regulation of chondrocyte function by mechanical instability in osteoarthritis.
Modulation of miR-204 Expression during Chondrogenesis.
Xanthohumol Attenuated Inflammation and ECM Degradation by Mediating HO-1/C/EBPβ Pathway in Osteoarthritis Chondrocytes.
SIRT3 mitigates intervertebral disc degeneration by delaying oxidative stress-induced senescence of nucleus pulposus cells.
Ultrasound-targeted simvastatin-loaded microbubble destruction promotes OA cartilage repair by modulating the cholesterol efflux pathway mediated by PPARγ in rabbits.
Post-translational regulation and proteolytic activity of the metalloproteinase ADAMTS8.
In vitro temporal HIF-mediated deposition of osteochondrogenic matrix governed by hypoxia and osteogenic factors synergy.
Hyaluronic acid hydrogels reinforced with laser spun bioactive glass micro- and nanofibres doped with lithium.
Exosite inhibition of ADAMTS-5 by a glycoconjugated arylsulfonamide.
Precision 3D printed meniscus scaffolds to facilitate hMSCs proliferation and chondrogenic differentiation for tissue regeneration.
Immunity-and-matrix-regulatory cells derived from human embryonic stem cells safely and effectively treat mouse lung injury and fibrosis.
Silencing of long‑chain non‑coding RNA GAS5 in osteoarthritic chondrocytes is mediated by targeting the miR‑34a/Bcl‑2 axis.
Basement Membrane Remodeling Controls Endothelial Function in Idiopathic Pulmonary Arterial Hypertension.
Increased matrix metalloproteinase levels and perineuronal net proteolysis in the HIV-infected brain; relevance to altered neuronal population dynamics.
Notch Signaling Regulates MMP-13 Expression via Runx2 in Chondrocytes.
Non-pathological Chondrogenic Features of Valve Interstitial Cells in Normal Adult Zebrafish.
TLR2 Promotes Vascular Smooth Muscle Cell Chondrogenic Differentiation and Consequent Calcification via the Concerted Actions of Osteoprotegerin Suppression and IL-6-Mediated RANKL Induction.
Intraarticular senescent chondrocytes impair the cartilage regeneration capacity of mesenchymal stem cells.
Exosites in Hypervariable Loops of ADAMTS Spacer Domains control Substrate Recognition and Proteolysis.
Morphological and Molecular Changes in Juvenile Normal Human Fibroblasts Exposed to Simulated Microgravity.
Andrographolide mitigates IL‑1β‑induced human nucleus pulposus cells degeneration through the TLR4/MyD88/NF‑κB signaling pathway.
A fully defined static suspension culture system for large-scale human embryonic stem cell production.
Three-Dimensional Coculture of Meniscal Cells and Mesenchymal Stem Cells in Collagen Type I Hydrogel on a Small Intestinal Matrix-A Pilot Study Toward Equine Meniscus Tissue Engineering.
Cx43-Dependent Skeletal Phenotypes Are Mediated by Interactions between the Hapln1a-ECM and Sema3d during Fin Regeneration.
Olive and grape seed extract prevents post-traumatic osteoarthritis damages and exhibits in vitro anti IL-1β activities before and after oral consumption.
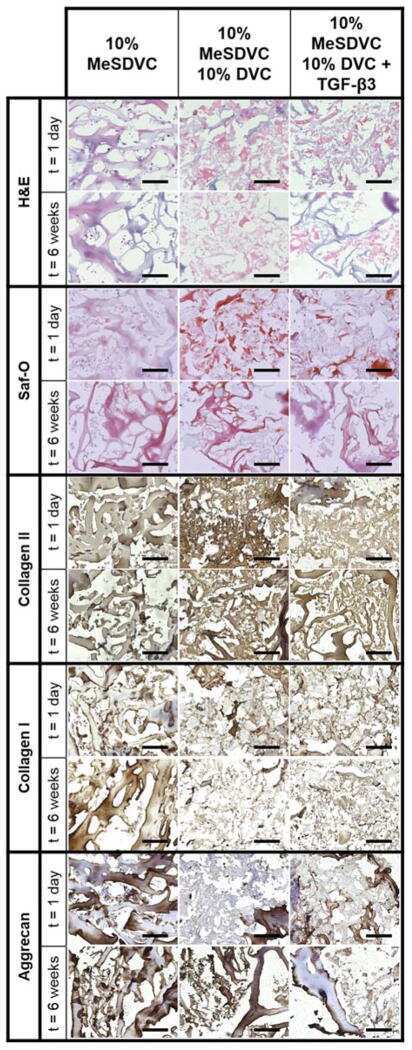
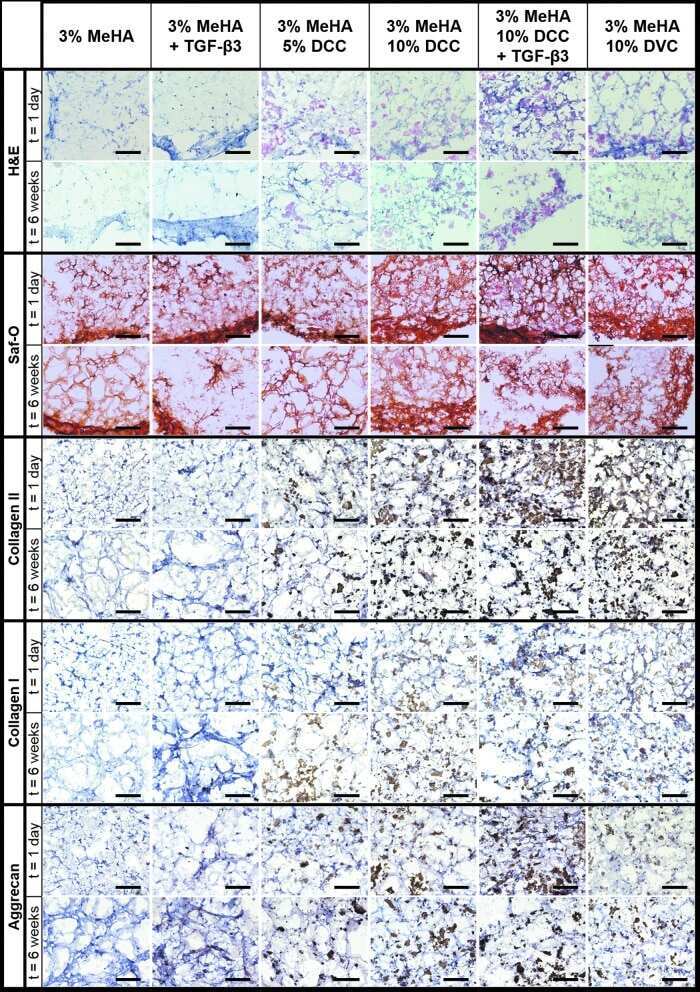
Chondroinductive Hydrogel Pastes Composed of Naturally Derived Devitalized Cartilage.
Approaching the compressive modulus of articular cartilage with a decellularized cartilage-based hydrogel.
Chondroinduction from Naturally Derived Cartilage Matrix: A Comparison Between Devitalized and Decellularized Cartilage Encapsulated in Hydrogel Pastes.
Dynamic remodeling of the extra cellular matrix during zebrafish fin regeneration.
Lyme disease spirochaetes possess an aggrecan-binding protease with aggrecanase activity.
Proteomic profiling and functional characterization of early and late shoulder osteoarthritis.
Effects of a glycogen synthase kinase-3β inhibitor (LiCl) on c-myc protein in intervertebral disc cells.
Wang Z, Rao Z, Wang X, Jiang C, Yang Y
International journal of molecular medicine 2022 Jan;49(1)
International journal of molecular medicine 2022 Jan;49(1)
Modulation of miR-204 Expression during Chondrogenesis.
Dalle Carbonare L, Bertacco J, Minoia A, Cominacini M, Bhandary L, Elia R, Gambaro G, Mottes M, Valenti MT
International journal of molecular sciences 2022 Feb 15;23(4)
International journal of molecular sciences 2022 Feb 15;23(4)
Xanthohumol Attenuated Inflammation and ECM Degradation by Mediating HO-1/C/EBPβ Pathway in Osteoarthritis Chondrocytes.
Zhang M, Zhang R, Zheng T, Chen Z, Ji G, Peng F, Wang W
Frontiers in pharmacology 2021;12:680585
Frontiers in pharmacology 2021;12:680585
SIRT3 mitigates intervertebral disc degeneration by delaying oxidative stress-induced senescence of nucleus pulposus cells.
Lin J, Du J, Wu X, Xu C, Liu J, Jiang L, Cheng X, Ge G, Chen L, Pang Q, Geng D, Mao H
Journal of cellular physiology 2021 Sep;236(9):6441-6456
Journal of cellular physiology 2021 Sep;236(9):6441-6456
Ultrasound-targeted simvastatin-loaded microbubble destruction promotes OA cartilage repair by modulating the cholesterol efflux pathway mediated by PPARγ in rabbits.
Wang X, Wang D, Xia P, Cheng K, Wang Q, Wang X, Lin Q, Song J, Chen A, Li X
Bone & joint research 2021 Oct;10(10):693-703
Bone & joint research 2021 Oct;10(10):693-703
Post-translational regulation and proteolytic activity of the metalloproteinase ADAMTS8.
Santamaria S, Martin DR, Dong X, Yamamoto K, Apte SS, Ahnström J
The Journal of biological chemistry 2021 Nov;297(5):101323
The Journal of biological chemistry 2021 Nov;297(5):101323
In vitro temporal HIF-mediated deposition of osteochondrogenic matrix governed by hypoxia and osteogenic factors synergy.
Calejo I, Costa-Almeida R, Reis RL, Gomes ME
Journal of cellular physiology 2021 May;236(5):3991-4007
Journal of cellular physiology 2021 May;236(5):3991-4007
Hyaluronic acid hydrogels reinforced with laser spun bioactive glass micro- and nanofibres doped with lithium.
Riveiro A, Amorim S, Solanki A, Costa DS, Pires RA, Quintero F, Del Val J, Comesaña R, Badaoui A, Lusquiños F, Maçon ALB, Tallia F, Jones JR, Reis RL, Pou J
Materials science & engineering. C, Materials for biological applications 2021 Jul;126:112124
Materials science & engineering. C, Materials for biological applications 2021 Jul;126:112124
Exosite inhibition of ADAMTS-5 by a glycoconjugated arylsulfonamide.
Santamaria S, Cuffaro D, Nuti E, Ciccone L, Tuccinardi T, Liva F, D'Andrea F, de Groot R, Rossello A, Ahnström J
Scientific reports 2021 Jan 13;11(1):949
Scientific reports 2021 Jan 13;11(1):949
Precision 3D printed meniscus scaffolds to facilitate hMSCs proliferation and chondrogenic differentiation for tissue regeneration.
Deng X, Chen X, Geng F, Tang X, Li Z, Zhang J, Wang Y, Wang F, Zheng N, Wang P, Yu X, Hou S, Zhang W
Journal of nanobiotechnology 2021 Dec 2;19(1):400
Journal of nanobiotechnology 2021 Dec 2;19(1):400
Immunity-and-matrix-regulatory cells derived from human embryonic stem cells safely and effectively treat mouse lung injury and fibrosis.
Wu J, Song D, Li Z, Guo B, Xiao Y, Liu W, Liang L, Feng C, Gao T, Chen Y, Li Y, Wang Z, Wen J, Yang S, Liu P, Wang L, Wang Y, Peng L, Stacey GN, Hu Z, Feng G, Li W, Huo Y, Jin R, Shyh-Chang N, Zhou Q, Wang L, Hu B, Dai H, Hao J
Cell research 2020 Sep;30(9):794-809
Cell research 2020 Sep;30(9):794-809
Silencing of long‑chain non‑coding RNA GAS5 in osteoarthritic chondrocytes is mediated by targeting the miR‑34a/Bcl‑2 axis.
Ji Q, Qiao X, Liu Y, Wang D, Yan J
Molecular medicine reports 2020 Mar;21(3):1310-1319
Molecular medicine reports 2020 Mar;21(3):1310-1319
Basement Membrane Remodeling Controls Endothelial Function in Idiopathic Pulmonary Arterial Hypertension.
Jandl K, Marsh LM, Hoffmann J, Mutgan AC, Baum O, Bloch W, Thekkekara-Puthenparampil H, Kolb D, Sinn K, Klepetko W, Heinemann A, Olschewski A, Olschewski H, Kwapiszewska G
American journal of respiratory cell and molecular biology 2020 Jul;63(1):104-117
American journal of respiratory cell and molecular biology 2020 Jul;63(1):104-117
Increased matrix metalloproteinase levels and perineuronal net proteolysis in the HIV-infected brain; relevance to altered neuronal population dynamics.
Bozzelli PL, Caccavano A, Avdoshina V, Mocchetti I, Wu JY, Conant K
Experimental neurology 2020 Jan;323:113077
Experimental neurology 2020 Jan;323:113077
Notch Signaling Regulates MMP-13 Expression via Runx2 in Chondrocytes.
Xiao D, Bi R, Liu X, Mei J, Jiang N, Zhu S
Scientific reports 2019 Oct 30;9(1):15596
Scientific reports 2019 Oct 30;9(1):15596
Non-pathological Chondrogenic Features of Valve Interstitial Cells in Normal Adult Zebrafish.
Schulz A, Brendler J, Blaschuk O, Landgraf K, Krueger M, Ricken AM
The journal of histochemistry and cytochemistry : official journal of the Histochemistry Society 2019 May;67(5):361-373
The journal of histochemistry and cytochemistry : official journal of the Histochemistry Society 2019 May;67(5):361-373
TLR2 Promotes Vascular Smooth Muscle Cell Chondrogenic Differentiation and Consequent Calcification via the Concerted Actions of Osteoprotegerin Suppression and IL-6-Mediated RANKL Induction.
Lee GL, Yeh CC, Wu JY, Lin HC, Wang YF, Kuo YY, Hsieh YT, Hsu YJ, Kuo CC
Arteriosclerosis, thrombosis, and vascular biology 2019 Mar;39(3):432-445
Arteriosclerosis, thrombosis, and vascular biology 2019 Mar;39(3):432-445
Intraarticular senescent chondrocytes impair the cartilage regeneration capacity of mesenchymal stem cells.
Cao X, Luo P, Huang J, Liang C, He J, Wang Z, Shan D, Peng C, Wu S
Stem cell research & therapy 2019 Mar 12;10(1):86
Stem cell research & therapy 2019 Mar 12;10(1):86
Exosites in Hypervariable Loops of ADAMTS Spacer Domains control Substrate Recognition and Proteolysis.
Santamaria S, Yamamoto K, Teraz-Orosz A, Koch C, Apte SS, de Groot R, Lane DA, Ahnström J
Scientific reports 2019 Jul 29;9(1):10914
Scientific reports 2019 Jul 29;9(1):10914
Morphological and Molecular Changes in Juvenile Normal Human Fibroblasts Exposed to Simulated Microgravity.
Buken C, Sahana J, Corydon TJ, Melnik D, Bauer J, Wehland M, Krüger M, Balk S, Abuagela N, Infanger M, Grimm D
Scientific reports 2019 Aug 15;9(1):11882
Scientific reports 2019 Aug 15;9(1):11882
Andrographolide mitigates IL‑1β‑induced human nucleus pulposus cells degeneration through the TLR4/MyD88/NF‑κB signaling pathway.
Zhang L, Chen Q, Wang H, Yang J, Sheng S
Molecular medicine reports 2018 Dec;18(6):5427-5436
Molecular medicine reports 2018 Dec;18(6):5427-5436
A fully defined static suspension culture system for large-scale human embryonic stem cell production.
Li X, Ma R, Gu Q, Liang L, Wang L, Zhang Y, Wang X, Liu X, Li Z, Fang J, Wu J, Wang Y, Li W, Hu B, Wang L, Zhou Q, Hao J
Cell death & disease 2018 Aug 30;9(9):892
Cell death & disease 2018 Aug 30;9(9):892
Three-Dimensional Coculture of Meniscal Cells and Mesenchymal Stem Cells in Collagen Type I Hydrogel on a Small Intestinal Matrix-A Pilot Study Toward Equine Meniscus Tissue Engineering.
Kremer A, Ribitsch I, Reboredo J, Dürr J, Egerbacher M, Jenner F, Walles H
Tissue engineering. Part A 2017 May;23(9-10):390-402
Tissue engineering. Part A 2017 May;23(9-10):390-402
Cx43-Dependent Skeletal Phenotypes Are Mediated by Interactions between the Hapln1a-ECM and Sema3d during Fin Regeneration.
Govindan J, Tun KM, Iovine MK
PloS one 2016;11(2):e0148202
PloS one 2016;11(2):e0148202
Olive and grape seed extract prevents post-traumatic osteoarthritis damages and exhibits in vitro anti IL-1β activities before and after oral consumption.
Mével E, Merceron C, Vinatier C, Krisa S, Richard T, Masson M, Lesoeur J, Hivernaud V, Gauthier O, Abadie J, Nourissat G, Houard X, Wittrant Y, Urban N, Beck L, Guicheux J
Scientific reports 2016 Sep 19;6:33527
Scientific reports 2016 Sep 19;6:33527
Chondroinductive Hydrogel Pastes Composed of Naturally Derived Devitalized Cartilage.
Beck EC, Barragan M, Tadros MH, Kiyotake EA, Acosta FM, Kieweg SL, Detamore MS
Annals of biomedical engineering 2016 Jun;44(6):1863-80
Annals of biomedical engineering 2016 Jun;44(6):1863-80
Approaching the compressive modulus of articular cartilage with a decellularized cartilage-based hydrogel.
Beck EC, Barragan M, Tadros MH, Gehrke SH, Detamore MS
Acta biomaterialia 2016 Jul 1;38:94-105
Acta biomaterialia 2016 Jul 1;38:94-105
Chondroinduction from Naturally Derived Cartilage Matrix: A Comparison Between Devitalized and Decellularized Cartilage Encapsulated in Hydrogel Pastes.
Beck EC, Barragan M, Libeer TB, Kieweg SL, Converse GL, Hopkins RA, Berkland CJ, Detamore MS
Tissue engineering. Part A 2016 Apr;22(7-8):665-79
Tissue engineering. Part A 2016 Apr;22(7-8):665-79
Dynamic remodeling of the extra cellular matrix during zebrafish fin regeneration.
Govindan J, Iovine MK
Gene expression patterns : GEP 2015 Sep-Nov;19(1-2):21-9
Gene expression patterns : GEP 2015 Sep-Nov;19(1-2):21-9
Lyme disease spirochaetes possess an aggrecan-binding protease with aggrecanase activity.
Russell TM, Johnson BJ
Molecular microbiology 2013 Oct;90(2):228-40
Molecular microbiology 2013 Oct;90(2):228-40
Proteomic profiling and functional characterization of early and late shoulder osteoarthritis.
Wanner J, Subbaiah R, Skomorovska-Prokvolit Y, Shishani Y, Boilard E, Mohan S, Gillespie R, Miyagi M, Gobezie R
Arthritis research & therapy 2013 Nov 6;15(6):R180
Arthritis research & therapy 2013 Nov 6;15(6):R180
Effects of a glycogen synthase kinase-3β inhibitor (LiCl) on c-myc protein in intervertebral disc cells.
Hiyama A, Sakai D, Arai F, Nakajima D, Yokoyama K, Mochida J
Journal of cellular biochemistry 2011 Oct;112(10):2974-86
Journal of cellular biochemistry 2011 Oct;112(10):2974-86
No comments: Submit comment
Supportive validation
- Submitted by
- Invitrogen Antibodies (provider)
- Main image
- Experimental details
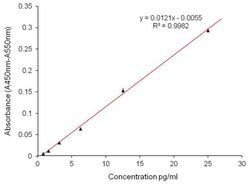
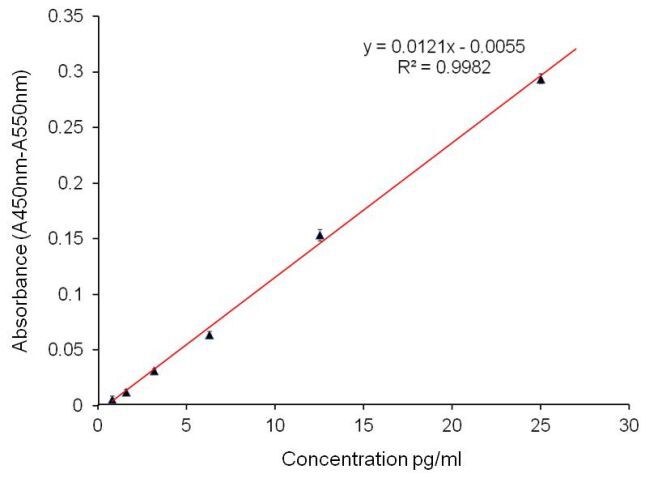
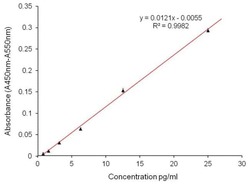
- ELISA analysis of Aggrecan was performed by coating Amine-binding Maleic Anhydride Activated Plates (Product # 15110) overnight with 100 µL of 2 µg/mL Aggrecan Interglobular Domain recombinant protein (Product # RP-77527). Plates were blocked for 1 hour at room temperature with StartingBlock Blocking Buffer (Product # 37538) and incubated with 100 µL per well of an Aggrecan monoclonal antibody (Product # MA3-16888) in duplicate at 25, 12.5, 6.25, 3.125, 1.563, 0.78 µg/100 µL with serial dilutions of for 2 hours at room temperature. The plate was washed and incubated with 100 µL per well of goat anti-mouse IgG-HRP secondary antibody (Product # 31430) in all test wells at 1:30,000 for 1 hour at room temperature. Detection was performed using 1-Step Ultra TMB - ELISA Substrate (Product # 34028) for 30 minutes at room temperature in the dark. The plate was then stopped with 0.16M sulfuric acid. Absorbance values were read on a spectrophotometer at 450-550 nm.
Supportive validation
- Submitted by
- Invitrogen Antibodies (provider)
- Main image
- Experimental details
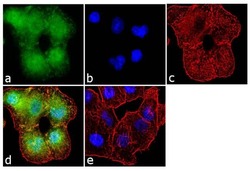
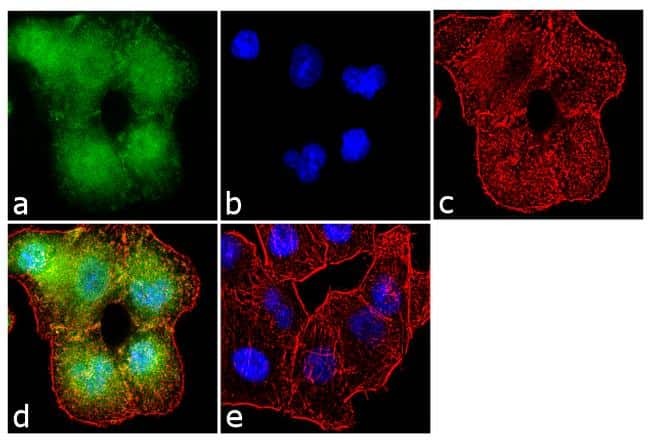
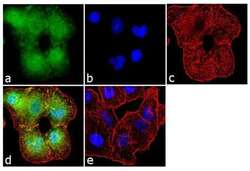
- Immunofluorescence analysis of Aggrecan was performed using 70% confluent log phase A549 cells. The cells were fixed with 4% paraformaldehyde for 10 minutes, permeabilized with 0.1% Triton™ X-100 for 10 minutes, and blocked with 1% BSA for 1 hour at room temperature. The cells were labeled with Aggrecan (BC-3) Mouse Monoclonal Antibody (Product # MA3-16888) at 2 µg/mL in 0.1% BSA and incubated for 3 hours at room temperature and then labeled with Goat anti-Mouse IgG (H+L) Superclonal™ Secondary Antibody, Alexa Fluor® 488 conj µgate (Product # A28175) at a dilution of 1:2000 for 45 minutes at room temperature (Panel a: green). Nuclei (Panel b: blue) were stained with SlowFade® Gold Antifade Mountant with DAPI (Product # S36938). F-actin (Panel c: red) was stained with Alexa Fluor® 555 Rhodamine Phalloidin (Product # R415, 1:300). Panel d represents the merged image showing localization in the extracellular matrix. Panel e shows the no primary antibody control. The images were captured at 60X magnification.
- Submitted by
- Invitrogen Antibodies (provider)
- Main image
- Experimental details
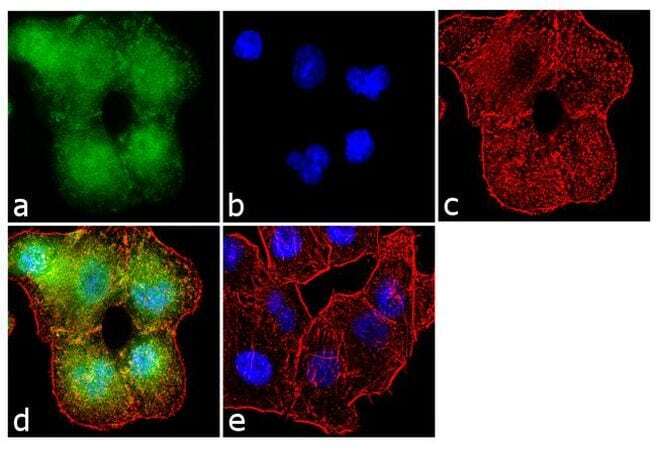
- Immunofluorescence analysis of Aggrecan was performed using 70% confluent log phase A549 cells. The cells were fixed with 4% paraformaldehyde for 10 minutes, permeabilized with 0.1% Triton™ X-100 for 10 minutes, and blocked with 1% BSA for 1 hour at room temperature. The cells were labeled with Aggrecan (BC-3) Mouse Monoclonal Antibody (Product # MA3-16888) at 2 µg/mL in 0.1% BSA and incubated for 3 hours at room temperature and then labeled with Goat anti-Mouse IgG (H+L) Superclonal™ Secondary Antibody, Alexa Fluor® 488 conj µgate (Product # A28175) at a dilution of 1:2000 for 45 minutes at room temperature (Panel a: green). Nuclei (Panel b: blue) were stained with SlowFade® Gold Antifade Mountant with DAPI (Product # S36938). F-actin (Panel c: red) was stained with Alexa Fluor® 555 Rhodamine Phalloidin (Product # R415, 1:300). Panel d represents the merged image showing localization in the extracellular matrix. Panel e shows the no primary antibody control. The images were captured at 60X magnification.
Supportive validation
- Submitted by
- Invitrogen Antibodies (provider)
- Main image
- Experimental details
- NULL
- Submitted by
- Invitrogen Antibodies (provider)
- Main image
- Experimental details
- NULL
- Submitted by
- Invitrogen Antibodies (provider)
- Main image
- Experimental details
- NULL

- Submitted by
- Invitrogen Antibodies (provider)
- Main image
- Experimental details
- ELISA analysis of Aggrecan was performed by coating Amine-binding Maleic Anhydride Activated Plates (Product # 15110) overnight with 100 æL of 2 æg/mL Aggrecan Interglobular Domain recombinant protein (Product # RP-77527). Plates were blocked for 1 hour at room temperature with StartingBlock Blocking Buffer (Product # 37538) and incubated with 100 æL per well of an Aggrecan monoclonal antibody (Product # MA3-16888) in duplicate at 25, 12.5, 6.25, 3.125, 1.563, 0.78 æg/100 æL with serial dilutions of for 2 hours at room temperature. The plate was washed and incubated with 100 æL per well of goat anti-mouse IgG-HRP secondary antibody (Product # 31430) in all test wells at 1:30,000 for 1 hour at room temperature. Detection was performed using 1-Step Ultra TMB - ELISA Substrate (Product # 34028) for 30 minutes at room temperature in the dark. The plate was then stopped with 0.16M sulfuric acid. Absorbance values were read on a spectrophotometer at 450-550 nm.

- Submitted by
- Invitrogen Antibodies (provider)
- Main image
- Experimental details
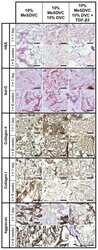
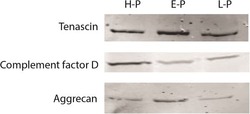
- Figure 7 Western blot analysis. Tenascin, complement factor D and aggrecan were analyzed from pooled healthy (H-P), pooled early (E-P) and pooled late (L-P) sample sets: 50 mug of protein extract was loaded into each lane.

- Submitted by
- Invitrogen Antibodies (provider)
- Main image
- Experimental details
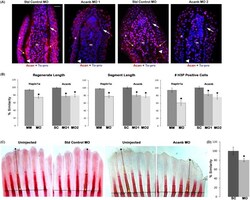
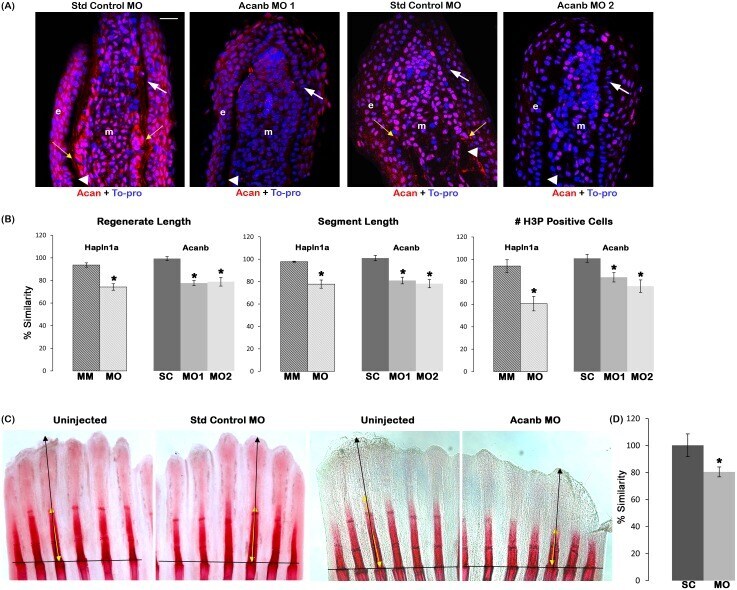
- Fig 6 Reduced Acan contributes to Hapln1a knockdown phenotypes. (A) Longitudinal section of fin rays treated with standard control morpholino (Standard control MO) and acanb ATG-blocking morpholino (Acanb MO1) or splice blocking morpholino (Acanb MO2). Immuno-staining for Acan (red) and counterstained for nuclei with To-pro (blue). Compared to the standard MO treated fins, Acanb MO treated fins show reduced staining for Acan. White arrow identifies the basal layer of epithelium; yellow arrow identifies Acan staining in the lepidotrichia, arrow head identifies the bone; m, mesenchyme; e, epithelium. Scale bar represents 20 mum. (B) Bar graph shows that regenerate length, segment length and cell proliferation are significantly reduced upon acanb knockdown using both MO1 and MO2. The mean of percent similarity for the MO treated experimental group and the corresponding control group were estimated and compared. Statistical significance was determined using the student's t -test (P
- Submitted by
- Invitrogen Antibodies (provider)
- Main image
- Experimental details
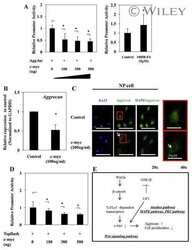
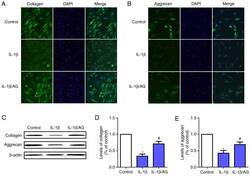
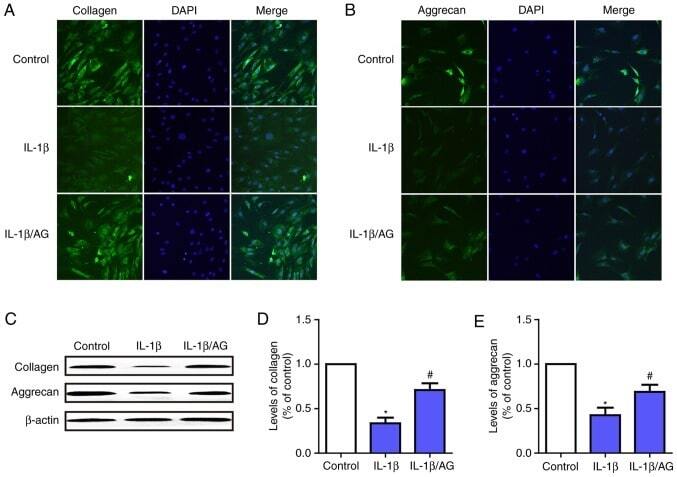
- Figure 4. Effect of AG on IL-1beta-induced extracellular matrix degradation in human NP cells. NP cells were stimulated by IL-1beta with or without AG treatment. Immunofluorescence images of (A) collagen-II and (B) aggrecan expression following treatment (magnification, x400). (C) The protein expression levels of aggrecan and collagen were determined western blot analysis. (D) Quantification of collagen levels. (E) Quantification of aggrecan levels. The values are presented as the mean +- standard deviation of 3 independent experiments. *P
- Submitted by
- Invitrogen Antibodies (provider)
- Main image
- Experimental details
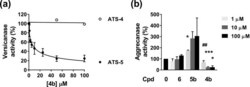
- Figure 2 Inhibitory activity of compound 4b . ( A ) Inhibition of versicanase activity. ADAMTS-4 (5.5 nM) and -5 (0.4 nM) were incubated either with compound 4b or DMSO for 2 h at 37 degC before addition of V1-5GAG (50 nM). At each time point, reactions were stopped by addition of EDTA and ADAMTS-generated versican fragments (versikine) quantified by sandwich ELISA. The relative versicanase activity is presented and 100% activity corresponds to that in the presence of DMSO alone. ( B ) Inhibition of ADAMTS-5 aggrecanase activity. Compounds (Cpd) 4b , 5b and 6 were incubated with ADAMTS-5 (1 nM) for 2 h at 37 degC before addition of aggrecan (20 mug). Following SDS-PAGE and immunoblot, fragments cleaved at the Glu392|Ala393 bond were detected by a monoclonal neoepitope antibody recognizing the new C-terminal fragment (anti-ARGSV) and analyzed by densitometric analysis. Data are presented as mean +- SEM (n = 4). * p < 0.05 and *** p < 0.001, compared to DMSO controls; ## p < 0.01, compared to the same concentration of compound 6 (Mann-Whitney test).

- Submitted by
- Invitrogen Antibodies (provider)
- Main image
- Experimental details
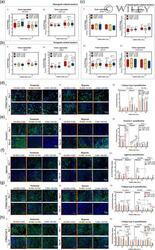
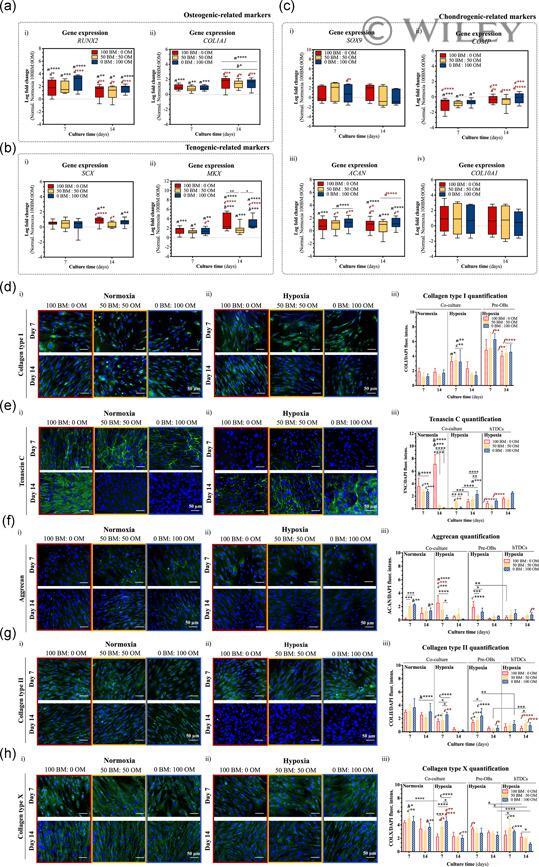
- 3 Figure Temporal expression of osteogenic-, tenogenic-, and chondrogenic-related markers in direct cocultures maintained in different ratios of osteogenic supplementation in hypoxic and normoxic setups. Gene expression of (a) osteogenic-related markers, (i) runt-related transcription factor 2 ( RUNX2 ), and (ii) collagen type I alpha 1 chain ( COL1A1 ); (b) tenogenic-related markers, (i) scleraxis ( SCX ) and (ii) mohawk ( MKX ); and (c) chondrogenic-related markers, sex-determining region Y-box 9 ( SOX9 ) (i), cartilage oligomeric matrix protein ( COMP ) (ii), aggrecan ( ACAN ) (iii) and collagen type X alpha 1 chain ( COL10A1 ) was determined by RT-PCR. Expression of target genes was normalized to the basal condition (100 BM: 0 OM) of the correspondent day under normoxia and the log-fold change calculated ( n = 3, five replicates). Immunofluorescence of (d) collagen type I (COLI), (e) tenascin C, (f) aggrecan (ACAN), (g) collagen type II (COLII), and (h) collagen type X (COLX) in co-cultures and single cultures at (i) normoxia and (ii) hypoxia for 14 days in the presence of increasing ratios of OM. Scale bars = 50 mum. Fluorescence intensity ratio quantification (iii) of proteins deposition. Data are represented as means +- SD . For (a-h), statistically significant differences are shown as * p < .05; ** p < .01; *** p < .001; **** p < .0001; b and c are statistically significant in comparison with the same condition at 7 and 14 days, respectively; (d) is statistically sign
- Submitted by
- Invitrogen Antibodies (provider)
- Main image
- Experimental details
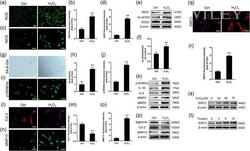
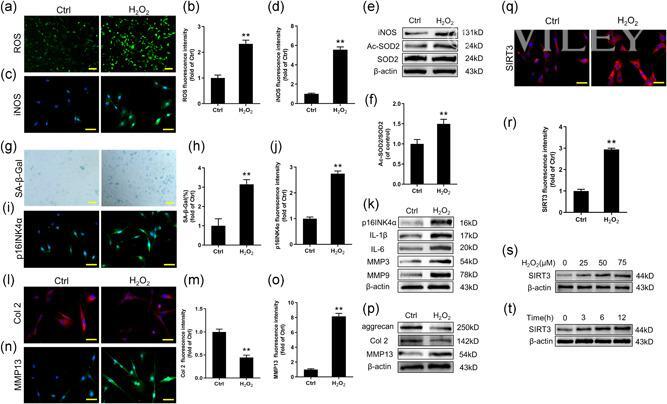
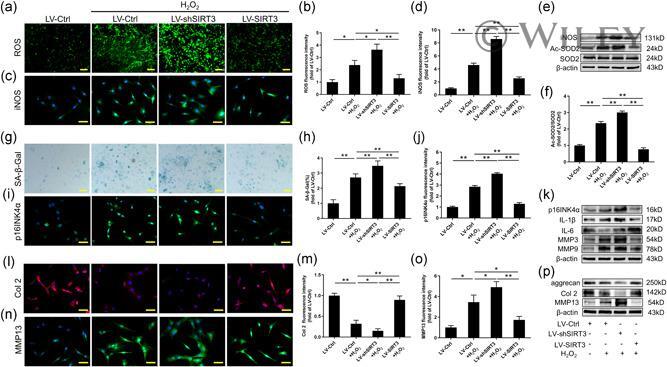
- 3 Figure Increased expression of SIRT3 in H 2 O 2 -induced senescent NPC. (a, b) DCFH-DA fluorescent staining results of ROS (scale bar = 100 mum). (c, d) Immunofluorescence staining results of iNOS (scale bar = 50 mum). (e, f) Western blot results of iNOS, Ac-SOD2, and SOD2. (g, h) SA-beta-Gal staining and quantitative analysis results (scale bar = 100 mum). (i, j) Immunofluorescence staining results of p16INK4a (scale bar = 50 mum). (k) Western blot results of p16INK4a and SASP. (l-o) Immunofluorescence staining results of Col 2 and MMP13 (scale bar = 50 mum). (p) Western blot results of aggrecan, Col 2, and MMP13. (q, r) Immunofluorescence staining results of SIRT3 (scale bar = 50 mum). (s, t) Western blot results of dose and time-dependent expression of SIRT3 expression under oxidative stress. Every experiment was performed three times, and the data are shown as the mean +- SD . * p < .05, ** p < .01 versus the control group. Ac-SOD2, acetylated-SOD2; Col 2, collagen type 2; DCFH-DA, dichloro-dihydro-fluorescein diacetate; iNOS, inducible nitric oxide synthase; MMP13, matrix metalloproteinase 13; ROS, reactive oxygen species; SA-beta-Gal, senescence-associated beta-galactosidase; SASP, senescence-associated secretory phenotype; SIRT3, silent information regulator 2 homolog 3; SOD2, superoxide dismutase 2
- Submitted by
- Invitrogen Antibodies (provider)
- Main image
- Experimental details
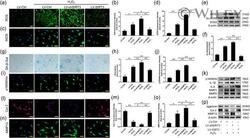
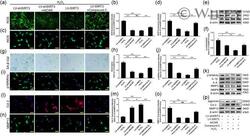
- 4 Figure The impact of the targeted regulation of SIRT3 on H 2 O 2 -induced senescence NPC. (a, b) DCFH-DA fluorescent staining results of ROS (scale bar = 100 mum). (c, d) Immunofluorescence staining results of iNOS (scale bar = 50 mum). (e, f) Western blot results of iNOS, Ac-SOD2, and SOD2. (g, h) SA-beta-Gal staining and quantitative analysis results (scale bar = 100 mum). (i, j) Immunofluorescence staining results of p16INK4a (scale bar = 50 mum). (k) Western blot results of p16INK4a, and SASP. (l-o) Immunofluorescence staining results of Col 2 and MMP13 (scale bar = 50 mum). (p) Western blot results of aggrecan, Col 2, and MMP13. Each experiment was conducted three times, and the data are shown as the mean +- SD . * p < .05, ** p < .01. Ac-SOD2, acetylated-SOD2; Col 2, collagen type 2; DCFH-DA, dichloro-dihydro-fluorescein diacetate; iNOS, inducible nitric oxide synthase; MMP13, matrix metalloproteinase 13; NPC, nucleus pulposus cell; ROS, reactive oxygen species; SA-beta-Gal, senescence-associated beta-galactosidase; SASP, senescence-associated secretory phenotype; SIRT3, silent information regulator 2 homolog 3; SOD2, superoxide dismutase 2
- Submitted by
- Invitrogen Antibodies (provider)
- Main image
- Experimental details
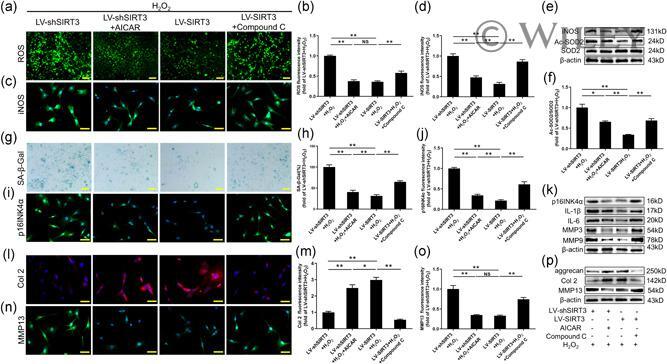
- 6 Figure AMPK/PGC-1a signaling pathway was involved in the regulation of SIRT3 on H 2 O 2 -induced senescent NPC. (a, b) DCFH-DA fluorescent staining results of ROS (scale bar = 100 mum). (c, d) Immunofluorescence staining results of iNOS (scale bar = 50 mum). (e, f) Western blot results of iNOS, Ac-SOD2, and SOD2. (g, h) SA-beta-Gal staining and quantitative analysis results (scale bar = 100 mum). (i, j) Immunofluorescence staining results of p16INK4a (scale bar = 50 mum). (k) Western blot results of p16INK4a and SASP. (l-o) Immunofluorescence staining results of Col 2 and MMP13 (scale bar = 50 mum). (p) Western blot results of aggrecan, Col 2, and MMP13. Each experiment was conducted three times, and the data are shown as the mean +- SD . * p < .05, ** p < .01. Ac-SOD2, acetylated-SOD2; AMPK, adenosine monophosphate-activated protein kinase; Col 2, collagen type 2; DCFH-DA, dichloro-dihydro-fluorescein diacetate; iNOS, inducible nitric oxide synthase; MMP13, matrix metalloproteinase 13; NPC, nucleus pulposus cell; PGC-1a, peroxisome proliferator-activated receptor-gamma coactivator-1alpha; ROS, reactive oxygen species; SA-beta-Gal, senescence-associated beta-galactosidase; SASP, senescence-associated secretory phenotype; SIRT3, silent information regulator 2 homolog 3; SOD2, superoxide dismutase 2
- Submitted by
- Invitrogen Antibodies (provider)
- Main image

- Experimental details
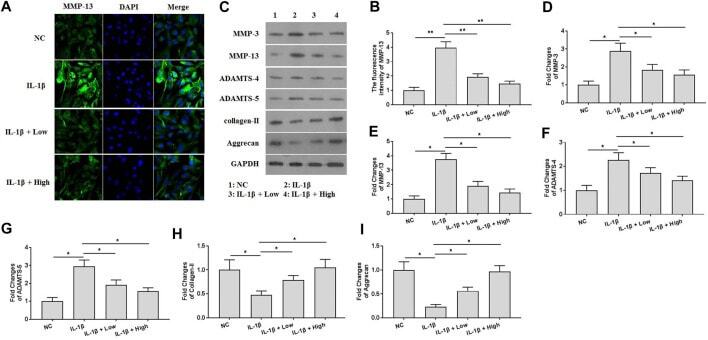
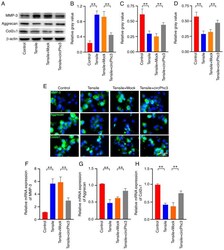
- FIGURE 4 XH attenuated ECM degradation in IL-1beta-treated chondrocytes. (A) The immunofluorescence study of MMP-13 in IL-1beta-treated chondrocytes. (B) The summary data of fluorescence intensity of MMP-13. (C) The proteins expression of MMP-3, MMP-13, ADAMTS-4, ADAMTS-5, collagen-II, and aggrecan were detected by western blotting. (D-I) were the quantified values of tested proteins. All experiments were performed in triplicate and data are presented as the mean +- standard deviation. * p < 0.05 and ** p < 0.01. NC, negative control; Low, XH (5 muM); High, XH (20 muM).
- Submitted by
- Invitrogen Antibodies (provider)
- Main image
- Experimental details
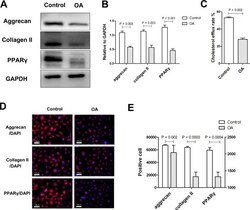
- Fig. 1 The extracellular matrix expression and cholesterol efflux rate decreases in osteoarthritis (OA) chondrocytes. a) and b) Western blot analysis of aggrecan, collagen II, and peroxisome proliferator-activated receptor (PPARgamma) expression in chondrocytes. Glyceraldehyde 3-phosphate dehydrogenase (GAPDH) was used as the endogenous control. c) The difference in cholesterol efflux rate between the control and osteoarthritis (OA) groups. d) and e) Representative immunofluorescence staining and quantification of the positive cell numbers. Chondrocytes are stained blue and the target proteins are stained red (scale bar = 100 um). DAPI, 4',6-diamidino-2-phenylindole. All p-values calculated using independent-samples t -test.

- Submitted by
- Invitrogen Antibodies (provider)
- Main image
- Experimental details
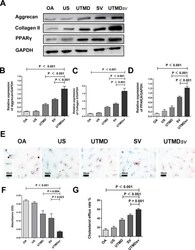
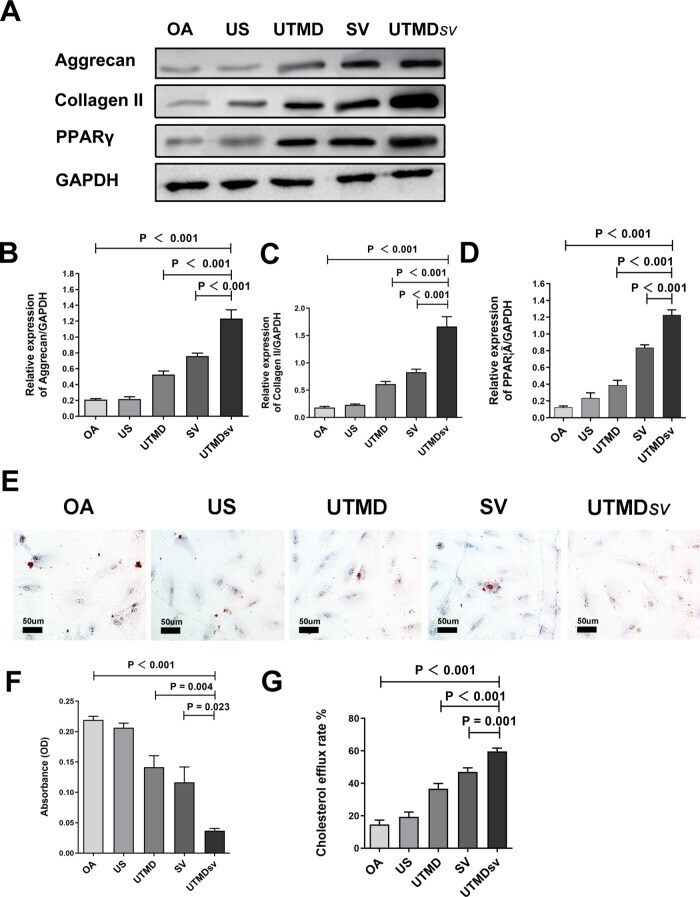
- Fig. 2 Effects of UTMD sv on cartilage metabolism and lipid metabolism. a) to d) Representative Western blot and quantification of aggrecan, collagen II, and PPARgamma, relative to glyceraldehyde-3-phosphate dehydrogenase (GAPDH) in osteoarthritis (OA) chondrocytes after treatment with ultrasound (US), US-targeted microbubble destruction (UTMD), simvastatin (SV), and US-targeted simvastatin-loaded microbubble destruction (UTMD sv ). e) Representative oil red images; scale bar = 50 mum. f) Triglyceride levels were quantified in chondrocytes by measuring absorbance at 490 nm. g) The difference in cholesterol efflux rate between groups.
- Submitted by
- Invitrogen Antibodies (provider)
- Main image
- Experimental details
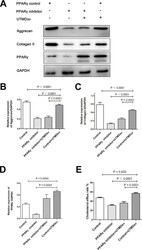
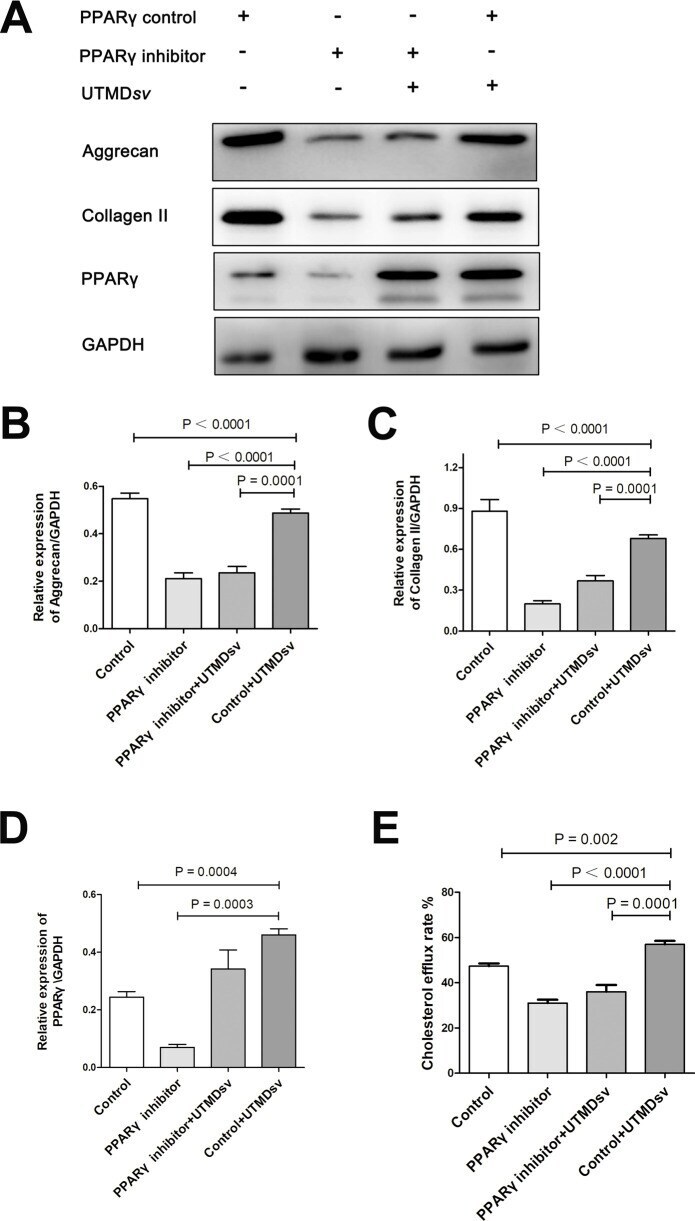
- Fig. 3 Peroxisome proliferator-activated receptor (PPARgamma) inhibitor reduces the extracellular matrix production and the cholesterol efflux rate in chondrocytes. The chondrocytes were treated with PPARgamma inhibitor. a) to d) Western blot and quantification of the relative expression levels of aggrecan, collagen II, and PPARgamma after PPARgamma inhibitor and ultrasound-targeted simvastatin-loaded microbubble destruction (UTMD SV ) intervention in osteoarthritis (OA) chondrocytes; glyceraldehyde 3-phosphate dehydrogenase (GADPH) was used as the endogenous control. e) The effect of the PPARgamma inhibitor and UTMD SV on the cholesterol efflux rate. All p-values were calculated using one-way analysis of variance.
- Submitted by
- Invitrogen Antibodies (provider)
- Main image
- Experimental details
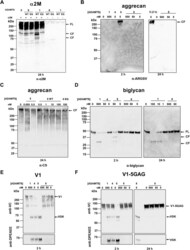
- Figure 5 Proteolytic activity of ADAMTS8. A , ADAMTS8 cleaves alpha2-macroglobulin. alpha 2 M (250 nM) was incubated with either ADAMTS8 or ADAMTS1 (250 nM) for 24 h. Samples were subjected to 4 to 12% SDS-PAGE and probed with polyclonal anti-alpha 2 M antibodies. Full-length (FL) substrates and specific cleavage fragments (CF) are indicated. All reactions were performed with the WT or EQ form of each enzyme. B , activity of ADAMTS1 (500 nM), ADAMTS4 (5 nM), ADAMTS5 (5 nM), and ADAMTS8 (5-500 nM) against bovine aggrecan (667 nM). Cleavage fragments generated after either 2 or 24 h digestion (as indicated) were detected using the anti-ARGSV neoepitope antibody BC3. C , activity of ADAMTS5 (0.005-0.5 nM) and ADAMTS8 (0.5-100 nM) against aggrecan (667 nM) after 24 h digestion. Activity of 100 nM ADAMTS8 EQ is shown for comparison. Bands were detected by the antibody 2B6, recognizing the CS stubs remaining following treatment of aggrecan with chondroitinase ABC. D , activity of ADAMTS1 (1-500 nM), ADAMTS4 (5-50 nM), ADAMTS5 (5-50 nM), and ADAMTS8 (5-500 nM) against biglycan (2 muM) was investigated after 2 or 24 h digestion (as indicated) using polyclonal antibodies against biglycan. Full-length (FL) substrates and specific cleavage fragments (CF) are indicated. E and F , activity of ADAMTS1 (500 nM), ADAMTS4 (5 nM), ADAMTS5 (5 nM), and ADAMTS8 (5-500 nM) against versican V1 ( E ) and V1-5GAG ( F ) (each at 100 nM) after 2 and 24 h digestions. Bands were detected using anti-VC an

- Submitted by
- Invitrogen Antibodies (provider)
- Main image

- Experimental details
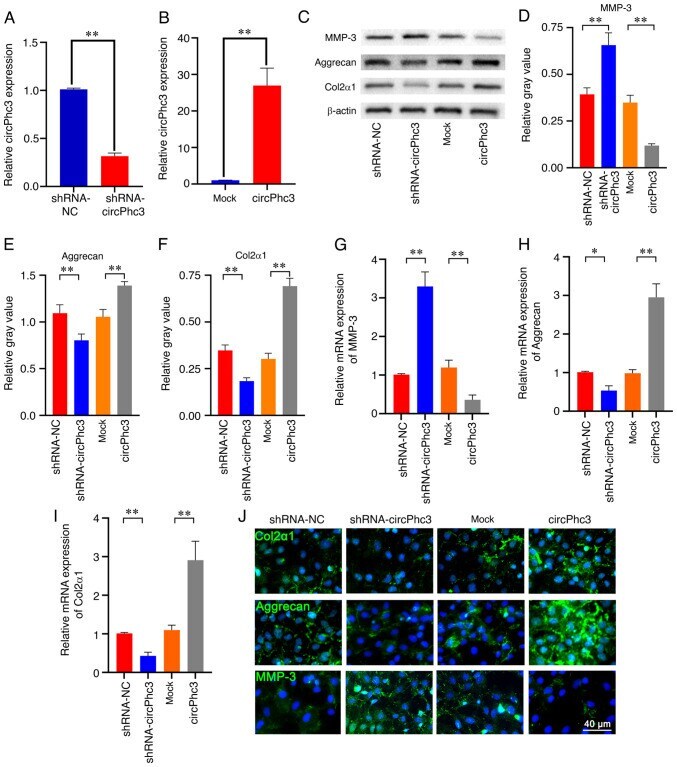
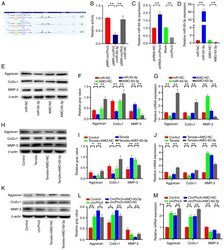
- Figure 3 circPhc3 is involved in the secretion of extracellular matrix and cartilage-degrading enzymes. (A) circPhc3 expression levels in chondrocytes transfected with shRNA-NC or shRNA-circPhc3 were analysed by RT-qPCR. The results showed that circPhc3 silencing was effective. ** P
- Submitted by
- Invitrogen Antibodies (provider)
- Main image
- Experimental details
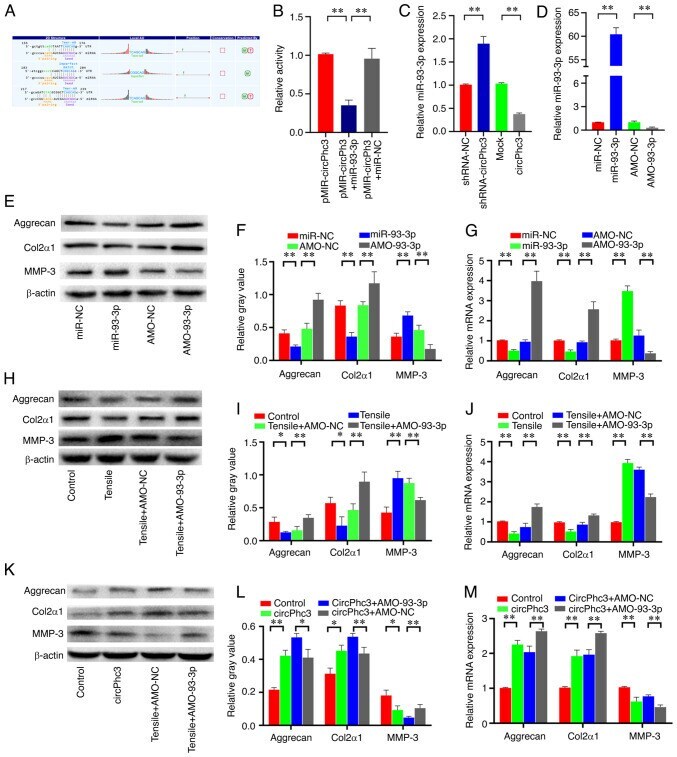
- Figure 4 circPhc3 is involved in mechanical loading-regulated production of extracellular matrix and cartilage-degrading enzymes. Protein expression levels were (A) determined by western blotting and semi-quantified for (B) MMP-3, (C) Aggrecan and (D) Col2alpha1 in chondrocytes transfected with Mock or circPhc3 overexpression vector, followed by treatment with 10% tensile for 48 h. ** P

- Submitted by
- Invitrogen Antibodies (provider)
- Main image
- Experimental details
- Figure 5 miR-93-3p targeted by circPhc3 is involved in the secretion of extracellular matrix and cartilage-degrading enzymes. (A) Bioinformatics analysis demonstrated the circPhc3 had multiple binding sites for miR-93-3p. (B) Dual luciferase reporter assay results showed that the firefly luciferase activity was significantly decreased when the cells were transfected with pMIR-circPhc3 and miR-93-3p mimics compared with those transfected with pMIR-circPh3 and miR-NC. ** P
- Submitted by
- Invitrogen Antibodies (provider)
- Main image
- Experimental details
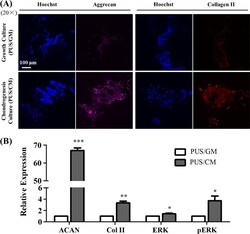
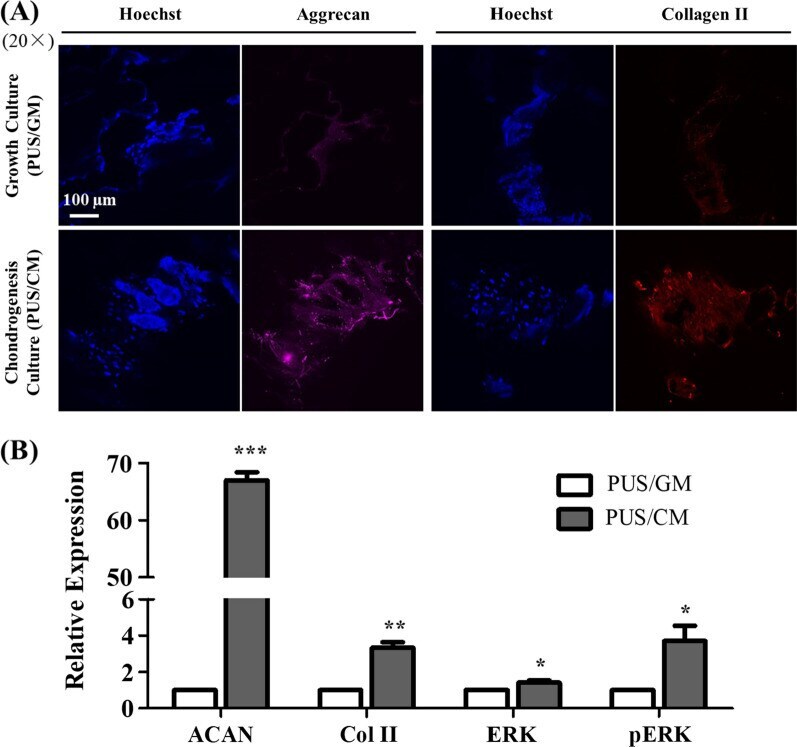
- Fig. 10 Chondrogenic differentiation of hMSCs cultured for 21 days on scaffolds assessed by A immunostaining of aggrecan and collagen II expression, and B western blot analysis of aggrecan, collagen II, ERK and pERK expression (n = 2). The relative expression values are given as the fold change compared to PUS/GM group. *p < 0.05, **p < 0.01 and ***p < 0.001
- Submitted by
- Invitrogen Antibodies (provider)
- Main image
- Experimental details
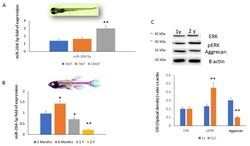
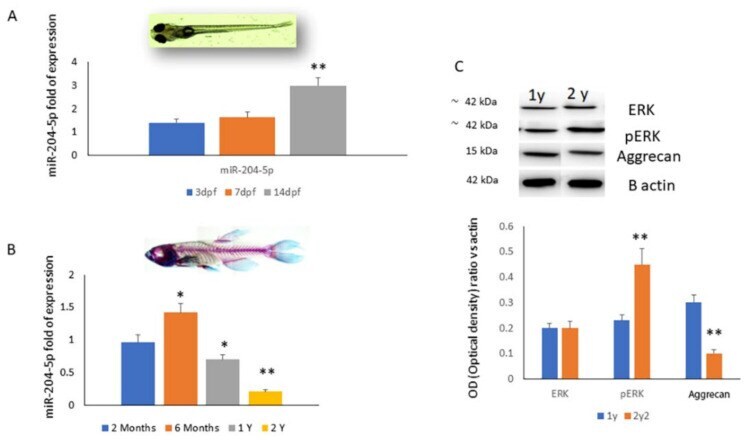
- Figure 3 miR-204-5p mRNA expression levels quantified by RT-PCR during ( A ) embryogenesis (3, 7 and 14 days post fecundation (dpf)) and ( B ) aging (2 and 6 months, 1 and 2 years old) in a zebrafish larvae in vivo model. ( C ) ERK, pERK and aggrecan protein levels assessed by western blot (top) and quantified as a relative optical density ratio vs. B-actin (down) on protein lysates from a zebrafish larvae in vivo model. (* p < 0.05; ** p < 0.005 vs. expression levels of larvae after 3 (dpf) ( A , B ) and vs. 1 year old ( C )).
- Submitted by
- Invitrogen Antibodies (provider)
- Main image
- Experimental details
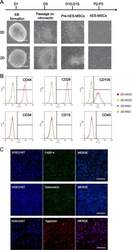
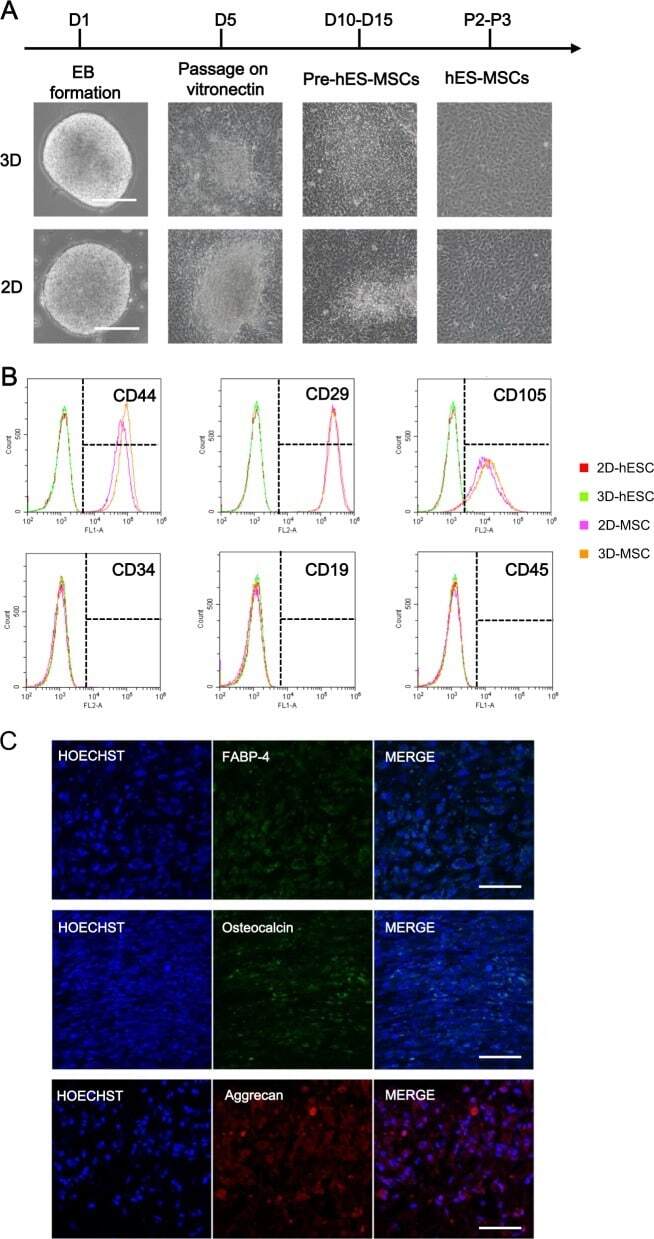
- Fig. 4 Comparison of MSCs derived from 2D-hESCs and 3D-hESCs. a The morphology of 2D- and 3D-hESC-MSCs at different stages of differentiation. b Flow cytometry analysis revealed specific MSC surface markers (CD44, CD29, and CD105) with negative controls (CD34, CD19, and CD45) in 2D- and 3D-hESC-MSCs. c Immunostaining of differentiated 3D-hESC-MSCs expressing an adipocyte marker (FABP-4), osteocytes maker (osteocalcin), and chondrocytes marker (aggrecan)
- Submitted by
- Invitrogen Antibodies (provider)
- Main image
- Experimental details
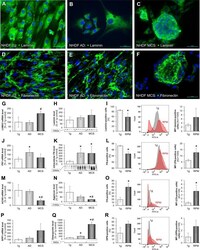
- Figure 2 Changes in the ECM composition of NHDF after a three-day RPM-exposure: Immunofluorescence images of 1 g -control cells, RPM-AD and RPM-MCS of laminin ( A - C ) and fibronectin ( D - F ). Transcriptional and translational laminin analysis: Quantitative gene expression levels of LAMA3 ( G ), intracellular laminin levels ( H ) and flow cytometric analysis of laminin-labeled cells ( I ) displaying the percentage of laminin-positive cells as well as alteration of the median fluorescence intensity (MFI). Transcriptional and translational fibronectin analysis: Quantitative gene expression levels of FN1 ( J ), intracellular fibronectin levels ( K ) and flow cytometric analysis of fibronectin-labeled cells ( L ). Transcriptional and translational aggrecan analysis: Quantitative gene expression level of ACAN ( M ), intracellular aggrecan levels ( N ) and flow cytometric analysis of chondroitin sulfate-labeled cells ( O ). Transcriptional and translational osteopontin analysis: Quantitative gene expression levels of SPP1 ( P ), intracellular osteopontin levels ( Q ) and flow cytometric analysis of osteopontin-labeled cells ( R ). Full-length blots of cropped Western blot images are presented in Supplementary Fig. S1 . *p < 0.05 1 g vs. RPM; # p < 0.05 AD vs. MCS. Scale bars: 50 um.
- Submitted by
- Invitrogen Antibodies (provider)
- Main image
- Experimental details
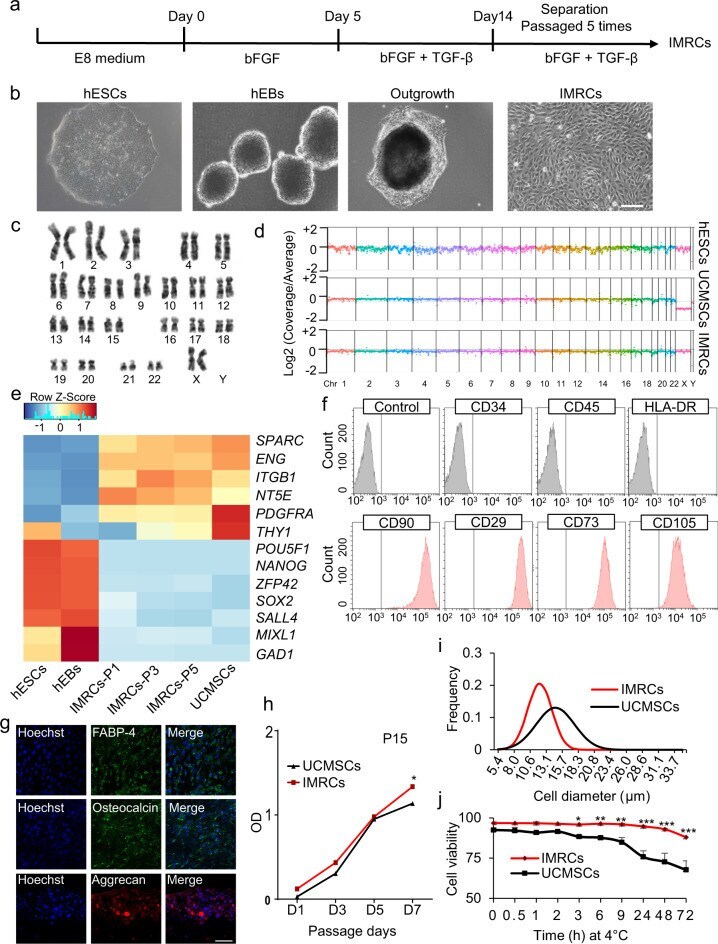
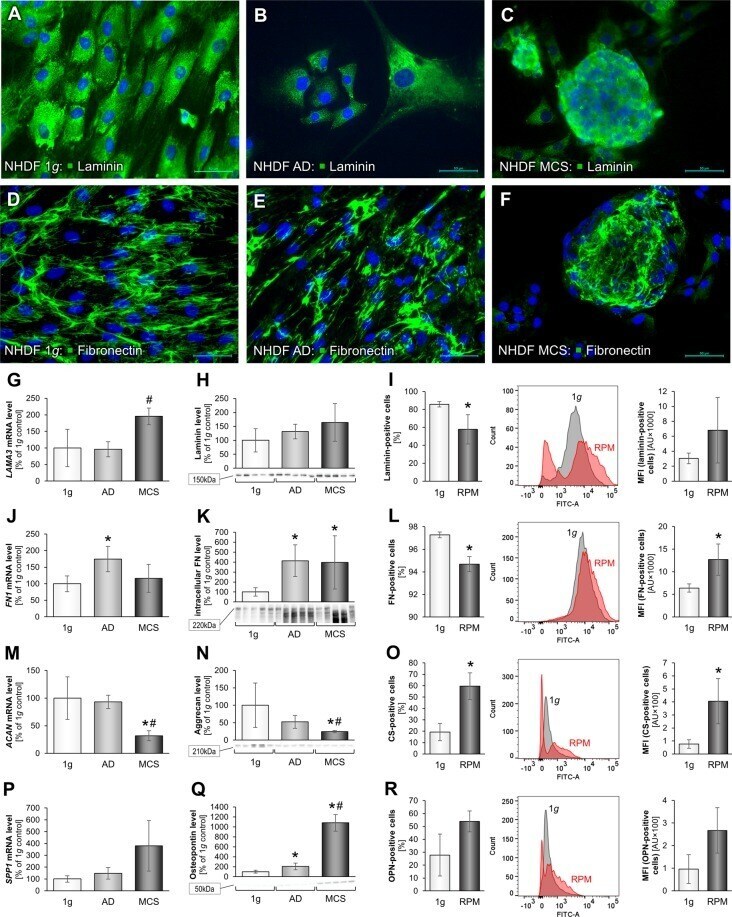
- Fig. 1 Derivation of IMRCs from hESCs. a Different phase of the IMRCs derivation protocol. b Representative morphology of cells at different stages as observed by phase contrast microscopy. hEBs human embryoid bodies. Scale bar, 100 um. c A representative chromosome spread of normal diploid IMRCs with 22 pairs of autosomes and two X chromosomes. d Copy number variation (CNV) analysis by whole-genome sequencing for hESCs, primary UCMSCs and IMRCs. UCMSCs, umbilical cord mesenchymal stem cells. e Heatmap showing MSC-specific marker and pluripotency marker gene expression changes, from hESCs and hEBs to IMRCs at passages 1-5 (P1-5), and primary UCMSCs. f IMRCs' expression of MSC-specific surface markers was determined by flow cytometry. Isotype control antibodies were used as controls for gating. Like MSCs, the IMRCs are CD34 - /CD45 - /HLA-DR - /CD90 + /CD29 + /CD73 + /CD105 + cells. g Representative immunofluorescence staining of IMRCs after they were induced to undergo adipogenic differentiation (FABP-4), osteogenic differentiation (Osteocalcin), and chondrogenic differentiation (Aggrecan). Scale bar, 100 um. h Proliferation curve of IMRCs and UCMSCs at the 15th passage ( n = 5). i Distribution of cell diameters of IMRCs and UCMSCs. j Viability of IMRCs and UCMSCs in clinical injection buffer over time at 4 degC. * P < 0.05, ** P < 0.01, *** P < 0.001; data are represented as the mean +- SEM.